
Abstract
In many applied and industrial settings, the use of Artificial Intelligence (AI) for quality technology is gaining growing attention. AI refers to the broad set of techniques which replicate human cognitive and analytical skills for problem solving, including Machine Learning, Neural Networks and Deep Learning. This paper presents a brief introduction to the special issue, where AI-based solutions are presented to solve problems that are typically faced in the area of quality technology. Limits and advantages of AI-based solutions are briefly discussed to stimulate creative attention to novel solutions and new directions for future research.
1. Introduction
We are continuing to see a significant increase of approaches based on Artificial Intelligence (AI) in our daily life. Similarly, manufacturing, business and services industries are more often including AI solutions to improve the efficiency of their processes, increase the value of their solutions, and design new products to find new businesses and markets. Nearly all the international roadmaps focusing on innovation and research include AI as a fundamental driver of future technology.Footnote1
Despite the current hype, AI has a long history as its origin dates back to the 1950s, when the English mathematician Alan Turing published the fundamental paper “Computing Machinery and Intelligence” (Turing and Haugeland Citation1950) and the computer scientist John McCarthy coined in 1956 the term AI to propose the first Artificial Intelligence conference, the Dartmouth Conference. AI was defined as "the science and engineering of making intelligent machines", to emphasize a new field aimed at creating machines that can replicate human intelligence to act effectively in a wide variety of novel and possibly unexpected situations (Russell and Norvig Citation2021).
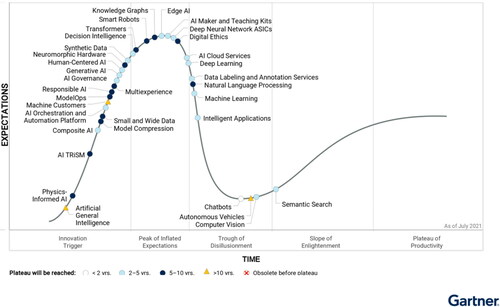
Starting from this early vision, AI is currently embracing a wide spectrum of solutions and approaches, as described in , where different AI topics are shown and located in the Gartner’s “Hype cycle of innovation” (Gartner Citation2021)Footnote2 where Gartner illustrates their view on when different types of AI solutions will reach a mature “Plateau of Productivity”. According to this view, few areas within AI have reached the peak of expectations, and AI remains a rapidly maturing field. Regardless of the exactness of the picture and Gartner’s view on the maturity of AI, it is true that different AI solutions have different maturity levels and different expected times to reach full maturity.
Figure 1. Gartner’s “Hype cycle” for artificial intelligence, 2021 (Gartner Citation2021). © 2021. Gartner. All Rights Reserved. Reproduced with permission.
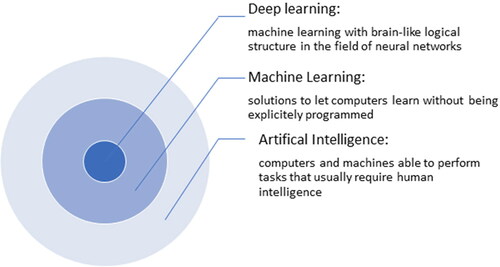
It is important to clarify the terms AI and Machine Learning (ML). illustrates a commonly accepted illustration of these terms, showing ML and deep learning (DL) as subsets of a broader field of AI. Thompson, Hui, and Bolen (Citation2021) state that “AI is the broad science of mimicking human abilities” and ML “is a specific subset of AI that trains a machine how to learn.” Murphy (Citation2012) gives a more in-depth definition of ML, defining it as “a set of methods that can automatically detect patterns in data, and then use the uncovered patterns to predict future data, or to perform other kinds of decision making under uncertainty (such as planning how to collect more data!).” With these views of the relationship between AI, ML, and DL, we see solutions developed using AI, ML, and DL as having a significant impact in changing the way in which data are used to drive decisions in the field of quality technology.
Figure 2. AI, machine learning and deep learning.
Journal of Quality Technology (JQT) views quality technology as a field that emphasizes the application of data analytics to solve real problems related to quality in industry, government, and society. Without question, the “technology” associated with the processes and products of our time are becoming increasingly complex. In addition, the “technology” that generates data from these processes and products is evolving rapidly and opening opportunities for solutions to unprecedented challenges and improvements in many domains. Accordingly, our special issue on “AI and Statistics for Quality Technology” aims to highlight some of the opportunities and challenges to be faced in the near future in the field of quality technology and to demonstrate innovative solutions to these challenges.
In light of the increasing attention to AI and its strong focus on the value of data, this special issue presents a collection of papers showing how ML or DL-based approaches can be usefully considered to solve current problems of interest in quality technology. As the field of quality technology evolves, we see ML, DL and AI solutions emerging as lively and active fields of study that embrace the discipline of Statistics with the power of computer science. The goal of these efforts is to develop automated methods of data analysis with the ultimate goal of continuously improving the quality of products and processes in industry, government and society.
The rest of this paper provides an overview of AI/ML applications in quality technology, and is organized as follows. The next three sections focus on AI solutions for process monitoring, Design of Experiments, and predictive modeling, respectively. The last section provides a brief discussion on advantages and limits of AI-based solutions for quality problems.
2. AI for quality monitoring and surveillance
Traditional Statistical Process Control (SPC) methods developed in the 1920s are still popular today. However, as manufacturing and data have become more complex, so have the monitoring and surveillance methods. Some degree of automation, even in traditional methods, has become inevitable given the size and dimensionality of the data sets collected thanks to advances in sensor technology. Likewise, the application areas for SPC methods have broadened significantly. Much of the research on process monitoring in the past decades focused on improving model-based methods to achieve a desired Average Run Length (ARL). As the monitoring scenarios become more complex in practice, attempts to align a model with the monitoring scenario becomes progressively more difficult.
Increasingly in practice and in research we are noticing a focus on data-driven and algorithmic monitoring methods in SPC. Some early attempts at using AI for process control date back to the 1980s (see, e.g. Thomson Citation1988). Many of the early papers using ML methods for process monitoring focused on developing control charts under a conceptual framework similar to the Shewhart chart. Some of the work focused on identifying control limits in more complex data scenarios such as autocorrelation or multivariate measurements. Much of the work focused on identifying patterns of observations using Neural Networks. Psarakis (Citation2011) and Zorriassatine and Tannock (Citation1998) provide a review of this early application of Neural Networks to control charts. Woodall and Montgomery (Citation2014) noted that “Despite the large number of papers on this topic [Neural Network-based control charts] we have not seen much practical impact on SPC.” In some cases, the performance gains recognized by using Neural Networks in the monitoring frameworks that were similar to the Shewhart approach were marginal. In addition, we found much of this early work difficult to apply in practice due to several factors including lack of generalizability of the methods to a broader class of problems, a lack of practical guidance as to how to adopt many of the methods to different scenarios and lack of documentation and/or compute codes to implement.
Weese et al. (Citation2016) reviewed a broader class of literature on the use of statistical learning methods in statistical process monitoring. Their review cited several main research streams, including dimension reduction methods, one-class classification methods, control chart pattern recognition, profile monitoring, and methods based on risk adjustment, neural networks, support vector machines, ensemble models, and risk-adjusted neural-network-based methods. They noted that many modern processes produce data from multiple streams and/or a hierarchical structure, often with autocorrelation and cyclical patterns. The traditional model-based SPC methods are ill suited to monitoring such data.
Recently, we have seen several important methodological challenges in process monitoring and surveillance that continue to impact SPC practice. Most of these challenges are problem driven and arise from new types of data that originate from technological advances in either the processes that generate the data or the measurement systems that record and store the data. Examples of such challenges include high-dimensionality of data, intricate temporal and spatial structure of data streams, non-stationarity and dynamicity of processes from which data are collected, missing and corrupted data, unstructured (text) data, and manifold data, that is, cases in which the data are concentrated in a nonlinear subspace.
Traditional SPC tools fall short of addressing these process monitoring challenges as their detection power quickly decays with increased data dimensions, and they often require a stationary process and a fixed baseline, or are based on linear dimensionality reduction techniques. Additionally, before monitoring can begin, one must first establish a baseline (traditionally referred to as Phase I) sample. An initial challenge is how to establish such a sample in a complex, high-dimensional situation. Although there may be classical statistical approaches to many of these scenarios, the complexities in the data from many of these scenarios may lend themselves well to algorithmic solutions using AI tools.
Adopting an AI approach for process monitoring is not without cost. Many ML and DL models are difficult to interpret. This problem is not new to process monitoring, as signal interpretation has often been challenging even when using relatively straightforward multivariate methods. With respect to AI models, there is growing interest and rapid development in building algorithms that are transparent, interpretable and understandable. Creating interpretable AI solutions is equally important in process monitoring, where understanding the source of a process change, or the “root cause” is critical to process improvement.
Once an AI solution is built, in order to add value to a business, it must be deployed into practice. In practice, even the best developed model may not work as expected; thus it is critical to monitor the model implementation. A growing area of focus in industry is developing automated methods for monitoring the implementation of AI models in practice. Similar to process monitoring, monitoring an AI model implementation is necessary to ensure the model remains effective over time. Part of an area known as Model Operations (ModelOps), monitoring AI model performance is a key component of an AI implementation strategy. Many of the model monitoring initiatives have developed outside of the industrial statistics community, and we believe these can be enriched by further study in our field.
In this issue, two sets of authors have provided innovative solutions to challenging modern process monitoring problems using MLand DL tools. The papers address topics on complex profile monitoring with image data and monitoring with incomplete data in a sensor network.
In the paper, “Toward a better monitoring statistic for profile monitoring via variational autoencoders”, in this issue, Sergin and Yan (Citation2021) develop a new formulation for the use of Variational Autoencoders (VAE). The VAE is a type of latent variable model that uses high-capacity deep neural networks in place of linear transformations to project high dimensional data into a “deep'' latent space. This work demonstrates limitations in the current uses of VAE for process monitoring and proposes a novel and computationally feasible method that overcomes the limitations in the VAE method. Their work is supported by an extensive simulation study and is applied to image profile monitoring in a hot steel rolling process.
In “Multi-sensor based landslide monitoring via transfer learning”, Li et al. (Citation2021) address the problem of process monitoring with incomplete data in a sensor network with applications in monitoring geographical sensors for landslides. Using a regularized parameter-based learning approach integrated with the LASSO, this research provides a method to effectively transfer information from sensors with sufficient historical data to those with a limited data history. A control chart is also developed to monitor the sensors using the transferred data.
2.1. AI/ML and the design of experiments
Over the years, there has been a continuous tension in the Applied Statistics literature between authors opposed to and authors in favor of using automatic or algorithmic methods (see, e.g., Breiman Citation2001). With the advent of continuously bigger datasets due to the use of better and cheaper sensing equipment in industry, some degree of automation became inevitably necessary.
Even within the field of Design of Experiments (DOE) for industry, a typically “small data" area as experiments are expensive, there has been since its beginnings in the late 40's and early 50's the two aforementioned schools of thought. One school of thought advocated a carefully designed and analyzed sequence of experiments for characterizing, understanding, and eventually, optimizing a process (following the lead of G.E.P. Box and coworkers initiated in the landmark paper by Box and Wilson (Citation1951) which translated and expanded Fisher's agricultural factorial experiments and ANOVA for the optimization of industrial processes). Another school of thought advocated algorithmic methods exclusively for process optimization that depended less on a human, e.g., the initial work of Hotelling (Citation1941) and Friedman and Savage (Citation1947) on sequential experiments for the optimization of a process continued with the classic work by Robbins and Monro (Citation1951) and Kiefer and Wolfowitz (Citation1952). Both schools have descendants in our days, with the former school the most dominant and successful in industrial practice but the latter having a resurgence in recent decades due to the wide availability of data obtained online or as a “stream" and the emergence of computer experiments and ML methods.
One area where ML methods have moved closer to what DOE techniques are intended for is Active Learning (AL). Supervised ML models usually need to be trained on hundreds or even thousands of labeled instances to perform well. The labels are often provided by an oracle, such as a human annotator, in response to different queries about unlabeled instances. While many modern systems can easily produce a large number of unlabeled instances at low cost, the labeling process can be very difficult, expensive or time-consuming (Settles Citation2009). AL has been proposed to solve these problems. The key idea of AL is to let the learning algorithm choose which data to learn from, instead of providing randomly selected labeled instances. The goal is for the algorithm to choose the most informative instance to label so that the learning model will perform better with less training data, thereby reducing the efforts of the labeling process and speeding up learning. The similitudes with DOE are clear: the instances correspond to experimental runs, learning means fitting a model, labeled instances are response values at a corresponding experimental condition, and one can even think of unlabeled data as what in optimal Design of Experiments is called a candidate list of points (for more see Li, Del Castillo, and Runger Citation2020).
An important and open-ended question in AL is how to measure the informativeness of a data point. There have been many variations of query strategies proposed in the AL literature, such as uncertainty sampling, query-by-committee, etc. (see Settles Citation2009 for details). For a binary classification problem, uncertainty sampling is equivalent to querying the instance whose posterior probability of being in any of the two classes is closest to 0.5. For multi-class classification problems, there are other uncertainty measures, such as entropy. An early reference on AL is Cohn, Atlas, and Ladner (Citation1994), who discussed how optimal design of experiments can guide neural network exploration by selecting the training trajectories that will increase the amount of information the most in a limited number of steps.
A concept related to how to measure information in a point is the acquisition function of sequential bayesian optimization techniques, the descendants of the Kiefer-Wolfowitz stochastic optimization methods. These methods are useful, among other problems, in Computer Experiments, where automatic algorithms are sensible, since the "experimentation" is not physical. The goal is to optimize as one performs experiments, so the sequence of design points constitutes a search for the optimum. This is in contrast with classic Response Surface Methods (Box and Draper Citation2007; Myers, Montgomery, and Anderson-Cook Citation2016; Del Castillo Citation2007) where models are fit first and optimization is performed subsequently, either based on first order or second order polynomial models used as local approximations. A most popular acquisition function in Computer Experiments, using a Gaussian Process model as global approximator over a large experimental region, is the Expected Improvement method (Jones, Schonlau, and Welch Citation1998) but other such functions have been proposed in more recent years. For a recent review of sequential Bayesian Optimization methods, see Frazier (Citation2018); for Gaussian Process as a main tool in ML see Rasmussen and Williams (Citation2006) and when used as a tool in Computer Experiments see Gramacy (Citation2020). Sequential optimization of a process can be based on convolutional neural networks (Goodfellow, Bengio, and Courville Citation2016) which in turn can also be aided by DOE-Active Learning ideas.
Related to the aforementioned problems is a very large body of classic literature existing in the Optimizing Control literature, too large to discuss here. For a review of the fundamental statistical Dual Control problem, which involves simultaneously learning and controlling a process, see Pronzato (Citation2000), who makes a connection between Dual Control and classical optimal design of experiments. Another point of contact between ML and design of experiments worth pointing out is the reliance many of these methods have on Bayesian techniques, see the work on Bayesian optimization methods based on classical response surface models by Peterson (Citation2004), summarized by Del Castillo (Citation2007) and in the forthcoming book by Peterson and Del Castillo (Citation2021), and contrast with the Bayesian probabilistic view of ML popularized among others by Murphy (Citation2012). Another very large body of literature that should be mentioned is the current emphasis in ML on finding causal effects from observational data, using, in particular, Bayesian networks (see e.g., Pearl Citation2009, who further developed the classic work on “potential responses” by Rubin Citation1978).
We cannot conclude this section without mentioning two other recent connections between DOE and ML/AI: the popular "A/B Tests" for web-based experiments (for instance, to enhance a web site operation, essentially sequences of 2-level one factor tests, see e.g. Kohavi, Henne, and Sommerfield Citation2007) and the development of new DOE methods in networks of connected components (Eckles, Karrer, and Ugander Citation2017). All these inter-related past and recent developments indicate the great current potential for cross-fertilizing research between the two classical schools in design of optimization experiments in industry.
Recent work has demonstrated how modern ML approaches can contribute to the design and analysis of industrial experiments and vice versa, DOE techniques can be useful for better and faster ML. An example of the former case of approach, in this issue, is the paper by Lin (Citation2021). Here the author shows that if the goal of an experimental design is to make predictions, ML tools such as Random Forests can be used to successfully analyze experimental data under such an objective. As an example of the latter type of contribution in this special issue, Lian et al. (Citation2021) (“Robustness with respect to class imbalance in artificial intelligence classification algorithms”) borrow concepts from mixture experiments to study the robustness of some AI/ML classification algorithms. As it is well known, in order for these algorithms to classify well, the quality of the training data is important, a problem not unrelated to the dual control and active learning problems. In its simplest form, that of a two-class problem, class imbalance in the training data, where one class is much more abundant leads to poor performance. These papers are instances of the two-way cross-fertilization between AI/ML and DOE, but more work is still needed in both directions.
2.2. AI in reliability, prognostic and predictive modeling of quality data
Predictive modeling in ML focuses on forecasting a quantity or an event by analyzing past behavior and discovering nonrandom patterns in the data. In principle, this is nothing different than the goals in classical predictive statistical inference, which has been widely used in quality and reliability modeling. Examples, of predictive modeling applications in quality and reliability include monitoring autocorrelated processes using ARMA models (Alwan and Roberts Citation1988), modeling and control of variation propagation in multistage processes using state space models (Shi Citation2014), offline prediction of mean time to failure of a component using various reliability models (Meeker and Escobar Citation1998), online prediction of residual useful lifetime of a component by modeling its degradation signals (Gebraeel et al. Citation2005), process optimization by learning the relationship between the output and process variables and finding their optimal setpoints (Del Castillo Citation2007). Despite the common goals, some of the methods and the language used in ML differ, creating barriers for cross-communication. An even bigger difference exists in that some of the types of data sets and volume of data used in ML are not common in traditional industrial statistics.
In ML, different types of data sets, by increasing degree of complexity, include numerical data in euclidean spaces (scalars, vectors, matrices or tensors), streaming (time based) data, network, text, and manifold data (scalars, vectors, and tensor data not on an euclidean space). Most of these data types arise in industrial quality and broad areas of work exist about their modeling. Numerical data in euclidean spaces is the basis for most classical “predictive” statistical methods including regression and their multivariable extensions (less frequently is the analysis of tensor data). Numerical data in euclidean spaces is also common in the analysis of one dimensional profile data, common not only in SPC but also in longitudinal data analysis. Streaming data is time series data in very large volumes and at rates not typically considered in traditional SPC., There is considerable work on network data originating from sociology (e.g. Wasserman and Faust Citation1994) and now popularized in different areas in applied science (e.g., Newman Citation2010). While there exists a large literature on categorical data analysis which is classic (e.g. see Agresti Citation2003), it does not include analysis and modeling of large texts. There are a handful examples of the use of manifold data in industrial statistics, given the required different mathematical background necessary (based on differential geometry), see Del Castillo and Zhao (Citation2020a) for a review.
Traditional statistical methods for predictive modeling have been successfully utilized in small-scale problems under some (restricting) assumptions on the data and the process structure, e.g., independence, stationarity and known distribution of data. However, these methods may not be applicable to large datasets with numerous variables or data streams collected with a high-sampling frequency, or to datasets that have functional structure such as images, point-clouds, manifolds, and networks. Additionally, if data are collected from a dynamic process (e.g. in continuous manufacturing processes), the estimated predictive models should be continually updated over time. These data/process characteristics require a new set of flexible and scalable analytical tools for predictive modeling, which are provided by ML and AI.
Low-dimensional learning methods used to reduce the dimensionality in modern process control data, for instance, can greatly benefit from ML methods. Here the subspace where the data lie is not necessarily a linear subspace, thus traditional PCA analysis is not sufficient. Methods including tensor analysis, functional data analysis, manifold learning, dictionary learning, matrix factorization, and low-rank recovery have shown to be effective ML tools to address the foregoing challenges in creating predictive models for quality. For recent examples, Reisi Gahrooei et al. (Citation2021) used tensor analysis for building a predictive model for multiple high-dimensional (HD) inputs and one HD output. Yan, Paynabar, and Pacella (Citation2019) developed a process optimization method for an HD output and LD inputs. Wang and Shi (Citation2021) extended the tensor-based predictive modeling approach to multi-stage processes while Shan and Apley (Citation2008) focused on using high-dimensional measurement data to understand the nature of the variability to facilitate root cause identification. For the purpose of monitoring manifold data, Del Castillo and Zhao (Citation2020b) used the Laplace-Beltrami (LB) operator to measure and monitor the local curvature of a manifold at different points. Del Castillo and Zhao (Citation2020a) review various methods for analyzing manifold data in the SPC and DOE domains. Del Castillo and Colosimo (Citation2011) provide a statistical framework for shape analysis of objects while Bui and Apley (Citation2018) developed ML solutions to detect changes in textured surfaces.
One of the main advantages of traditional predictive statistical models, especially the parametric models, is their interpretability and identifiability. The estimated model parameters can often be associated with the underlying physics/engineering principles governing the process, which make the predictive models interpretable. On the other hand, AI-based predictive models often lack interpretability, and identifying connections between the model components or parameters and the process they are modeling is difficult. Moreover, the main performance metric of this family of AI algorithms is prediction accuracy, usually assessed via multi-fold cross-validation, an idea that originated in mainstream statistics. Thus, in developing these models, little attention has been given to statistical identifiability. For example, in some tensor-based methods different sets of model parameters may result in a similar prediction accuracy, but providing different interpretations (Reisi Gahrooei et al. Citation2021). Another drawback, especially for AI predictive models, is that they require a very large sample size to achieve reasonable accuracy (Du et al. Citation2018). This may not always be available in manufacturing applications, where offline experimental data is expensive to collect and online streaming data are not stationary due to the process dynamics.
ML and DL methods have also been used to build predictive models for reliability analysis and prognostics. Hong, Zhang, and Meeker (Citation2018) discussed the applications of ML and big data analytics in reliability modeling. Fang, Paynabar, and Gebraeel (Citation2019, Fang et al. Citation2021) proposed prognostics frameworks for HD degradation signals using tensor analysis and low-rank recovery methods. Zhang et al. (Citation2019) provided a comprehensive review on the applications of deep learning methods in prognostics and health management (PHM). They discussed the applications of various neural networks in analysis of different types of degradation signals including time-series and image streams.
Reliability engineering research can also benefit from ML techniques and methods. Shortle and Mendel (Citation2001) showed how the space of lifetimes of multiple component systems is not euclidean, and proposed a different space for their analysis, using notions of invariance in differential geometry common to manifold learning. There is a long stream of work on Bayesian reliability analysis, given that reliability problems usually have to deal with considerable degrees of uncertainty and prior engineering and physical knowledge can be incorporated under a Bayesian approach, which is common in ML.
In this special issue, three papers focus on development of novel predictive modeling techniques using AI tools with applications in quality and reliability. These papers address topics on multi-input- multi-output predictive models for quality in multistage manufacturing processes using DL, modeling recurrent event processes using boosted trees, and adaptive sensor selection for effective prognostics using deep neural networks (DNN), respectively.
In the first of these papers, “Deep multistage multi-task learning for quality prediction of multistage manufacturing systems,” Yan et al. (Citation2021) propose a deep multistage multi-task learning (DMMTL) framework to predict multivariate quality characteristics in multi-stage manufacturing processes based on multivariate process variables. The proposed model connects multiple inputs and outputs within and between stages using a small set of fully connected hidden variables. Not only can these hidden variables help with reducing the dimension of the problem, but also capture the correlation among multiple variables. They used simulations as well as a case study to validate their work and compare its performance with a few ML-based predictive models including Random Forests and Elastic Nets.
In the paper entitled “Boost-R: Gradient boosted trees for recurrence data,” Liu and Pan (Citation2021) develop a new nonparametric method for estimation of the cumulative intensity function that characterizes recurrent event processes, which have wide application in reliability modeling and prediction. The proposed method, named Boost-R, combines the gradient boosting approach with additive regression trees. It can take the information of both static and dynamic features into account when estimating the cumulative intensity function. In addition to extensive simulation studies, the authors validated their method using a case study on modeling failure processes of oil and gas wells and provide an R package.
Finally, in “An adaptive sensor selection framework for multisensor prognostics,” Kim et al. (Citation2021) propose a new framework for adaptive selection of informative sensors to estimate the residual useful life of a system based on multivariate degradation signals. Their framework can be used along a variety of neural-network-based predictive models and make them more interpretable. They extend the Relu regularization and neuron-level dropout widely used in DNNs to sensor-level dropout, which randomly removes a sensor and its corresponding nodes and connections from the NN in each iteration of training. The sensor-level dropout along with a sensor disentanglement penalty helps to determine the importance of each sensor. The proposed framework is tested and compared with benchmark methods using simulated degradation processes of turbofan aircraft engines.
3. Statistics vs AI: some final conclusions
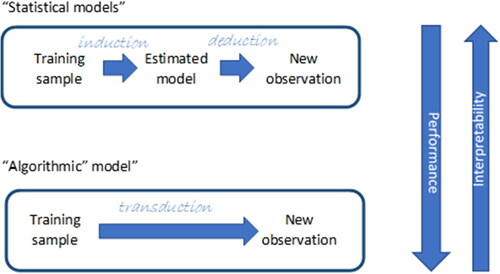
In his seminal paper “Statistical Modeling: The Two Cultures” Breiman (Citation2001), pointed out that two different cultures coexisted among statisticians. The first culture assumes data as generated by a given stochastic model while the second one uses algorithmic models treating the data mechanism as unknown (). According to Breiman, “the statistical community has been committed to the almost exclusive use of data models” (i.e., playing in the first mainstream) leading to “irrelevant theory, questionable conclusions and keeping statisticians from working on a large range of interesting current problems.” Breiman’s experience as consultant before returning to academia allowed him to observe that algorithmic methods from the then incipient ML community could be effectively used to solve many real problems involving large complex data sets or requiring more accurate alternatives to data modeling on small data sets.
Figure 3. Traditional statistics versus ML – courtesy Simone Vantini (ENBIS Workshop, July 12-13, 2021 - Interpretability for Industry 4.0). The notion of transduction, or going from specific training cases to specific test cases, was introduced in the AI/ML literature by V. Vapnik (see Vapnik Citation1998).
Clearly, some of the advantages of AI methods that have been also discussed in previous sections with reference to monitoring, DOE, reliability and prognostics come at the expenses of significant drawbacks in terms of interpretability, explainability and transparency, all features which refer, with different shades, to the opaqueness of AI solutions, in particular DNN and “deep” learning methods. Algorithmic modeling in ML typically involves black-box algorithms, which can undermine trust in safety-critical domains, reduce advances in scientific knowledge, limit the transferability of approaches to domain shifts and the fairness when approaches are used for decision-making (Marcinkevičs and Vogt Citation2020). To overcome all these limitations, eXplainable Artificial Intelligence (XAI) is currently embracing a set of techniques and methods to convert the so-called black-box AI algorithms to white-box algorithms, where the results achieved by the algorithms and all the parameters, variables and steps can be explained and clearly traced (Hussain et al., Citation2021; Murdoch et al. Citation2019).
As authors working in Industrial/Engineering Statistics, we welcome further work that integrates AI, ML, and DL methods in non-opaque, innovative ways to better address old problems or to solve new, relevant problems in modern industry. The data deluge is real and in some domains new methodology is necessary, where some degree of automation is needed. Sensing equipment has advanced at a fast pace, and classical statistics due to “Student”, Fisher and Neyman, based on small samples, are not always relevant in today’s processes. Theoretical statisticians have tried over the past two decades to adapt to the great influence of this other “statistical modeling culture” by defining ML in their own territory under the name Statistical Learning Theory (Hastie, Tibshirani, and Friedman Citation2013). The emergence of Statistical Learning Theory rightly forms an almost mandatory course in today’s training of any theoretical or applied statistician. This theory includes computational statistical methods (Efron and Hastie Citation2016), which have been incorporated into and shown value in industrial statistics over the past 20 years. However, we believe that totally automatic AI algorithms to monitor, control or optimize industrial processes, while maybe possible to eventually achieve, are unnecessary and possibly dangerous. The danger lies in the fact that the fuel for AI is data. A large number of AI/ML algorithms thus require a good deal of data pre-processing. The goodness, correctness, and appropriateness of all data-driven solutions depend on many features of the data, including quality, representativeness of cases, availability of the right variables, as well as ethical and privacy concerns. These elements require human judgment, and we believe this will continue in the foreseeable future. Thus, we envision solutions where AI is used to assist in decision making rather than replace the decision maker. For example, when possible, it is important to fuse preexisting knowledge, including domain knowledge, physics and engineering laws, and first principles into models rather than rely on completely data and data-driven approaches. Additionally, when using data-driven models, one should also evaluate the models in practice with additional testing of the predictions using DOE and/or by monitoring the model performance. We believe that fusing front-end knowledge with data as well as back-end testing of model performance will help to ensure that AI is used responsibly and delivers value.
As with many difficult tradeoffs, the efficiency versus transparency conflict is not going to have a clear winner. The present special issue attempts to highlight how appropriate solutions depend on the context of the problem under study, the type of research question/problem to be faced, the size and type of training and testing data, the level of detail required, and the need to transfer knowledge to different domains or to generalize the proposed method to other contexts. In this complex landscape, “the commitment to data modeling should not prevent” the community “from entering new scientific and commercial fields where the data being gathered is not suitable for analysis by data models”” (Breiman Citation2001). Thus, AI approaches, including ML and DL, should be further investigated and considered as potential competitors or possible solutions to real problems faced in quality technology.
Disclosure statement
No potential conflict of interest was reported by the authors.
Additional information
Notes on contributors
Bianca Maria Colosimo
Bianca Maria Colosimo is Professor in the Department of Mechanical Engineering of Politecnico di Milano, where she received her MSc and PhD (cum Laude) in Industrial Engineering. Her research interest is mainly in the area of big data modeling monitoring and control, with special attention to surface point clouds, signal, images and video data in advanced manufacturing applications, additive manufacturing among the others. She is Editor-in-Chief of the Journal of Quality Technology, Senior Editor of Informs Journal of Data Science, member of the QSR Advisory Board at INFORMS, Council member of ENBIS, Member of the platform of the European commission Manufuture. She is included among the top 100 Italian woman scientists in STEM – (https://100esperte.it/search?id=170).
Enrique del Castillo
Enrique del Castillo is a Distinguished Professor of Industrial and Manufacturing Engineering at the Pennsylvania State University where he is also a Professor of Statistics. He received a B.S. degree in Mechanical and Electrical Engineering from the National University of Mexico (UNAM)/Universidad Panamericana, an M.Eng. degree in Operations Research from Cornell University, and a Ph.D. in Industrial Engineering (Statistics concentration) from Arizona State University. Dr. del Castillo is a past recipient of a National Science Foundation CAREER Award, past editor-in-chief of the Journal of Quality Technology where he currently serves in its editorial board, past Associate Editor of the Technometrics and IIE Transactions journals, and a two-times Fulbright Scholar. He is the author of the textbooks Statistical Process Adjustment for Quality Control (Wiley, 2002) and Process Optimization, a Statistical Approach (Springer, 2007).
L. Allison Jones-Farmer
L. Allison Jones-Farmer is the Van Andel Professor of Business Analytics at Miami University in Oxford, Ohio. Her research focuses on developing practical methods for analyzing data in industrial and business settings. She is the current Editor-Elect of Journal of Quality Technology. She is on the editorial board of Quality Engineering and is a former Associate editor for Technometrics. She received a B.S. in Mathematics from Birmingham-Southern College, an M.S. in Applied Statistics from the University of Alabama, and a Ph.D. in Applied Statistics from the University of Alabama. She is a senior member of ASQ.
Kamran Paynabar
Kamran Paynabar is the Fouts Family Early Career Professor and Associate Professor in the H. Milton Stewart School of Industrial and Systems Engineering at Georgia Tech. He received his B.Sc. and M.Sc. in Industrial Engineering from Iran, and his Ph.D. in IOE and M.A. in Statistics from The University of Michigan. His research interests comprise both applied and methodological aspects of machine-learning and statistical modeling integrated with engineering principles. He served as the chair of QSR of INFORMS, and the president of QCRE of IISE. He is an Associate Editor for Technometrics and IEEE-TASE, a Department Editor for IISE-Transactions and a member of the editorial board for Journal of Quality Technology.
Notes
References
- Agresti, A. 2003. Categorical data analysis, vol. 482. New York: John Wiley & Sons.
- Alwan, L. C., and H. V. Roberts. 1988. Time-series modeling for statistical process control. Journal of Business & Economic Statistics 6:87–95.
- Box, G. E., and N. R. Draper. 2007. Response surfaces, mixtures, and ridge analyses, vol. 649. New York, NY: John Wiley & Sons.
- Box, G. E. P., and K. Wilson. 1951. On the experimental attainment of optimum conditions. Journal of the Royal Statistical Society: Series B (Methodological) 13 (1):1–38. doi: https://doi.org/10.1111/j.2517-6161.1951.tb00067.x.
- Breiman, L. 2001. Statistical modeling: the two cultures (with comments and a rejoinder by the author). Statistical Science 16 (3):199–231. doi: https://doi.org/10.1214/ss/1009213726.
- Bui, A., and D. W. Apley. 2018. Monitoring for changes in the nature of stochastic textured surfaces. Journal of Quality Technology 50 (4):363–78. doi: https://doi.org/10.1080/00224065.2018.1507559.
- Castillo, E., and B. M. Colosimo. 2011. Statistical shape analysis of experiments for manufacturing processes. Technometrics 53 (1):1–15. doi: https://doi.org/10.1198/TECH.2010.08194.
- Cohn, D., L. Atlas, and R. Ladner. 1994. Improving generalization with active learning. Machine Learning 15 (2):201–21. doi: https://doi.org/10.1007/BF00993277.
- Del Castillo, E. 2007. Process optimization: A statistical approach, vol. 105. New York, NY: Springer Science & Business Media.
- Del Castillo, E., and X. Zhao. 2020a. Industrial statistics and manifold data. Quality Engineering 32 (2):155–67. doi: https://doi.org/10.1080/08982112.2019.1641608.
- Del Castillo, E., and X. Zhao. 2020b. Statistical process monitoring for manifold data. In Wiley Stats-Ref: Statistics Reference Online. https://doi.org/https://doi.org/10.1002/9781118445112.
- Du, S. S., Y. Wang, X. Zhai, S. Balakrishnan, R. Salakhutdi-nov, and A. Singh. 2018. How many samples are needed to estimate a convolutional neural network? In Advances in neural information processing systems, 371–381.
- Eckles, D., B. Karrer, and J. Ugander. 2017. Design and analysis of experiments in networks: Reducing bias from interference. Journal of Causal Inference 5 (1):2017. doi: https://doi.org/10.1515/jci-2015-0021.
- Efron, B., and T. Hastie. 2016. Computer age statistical inference. New York, NY: Cambridge University Press.
- Fang, X., K. Paynabar, and N. Gebraeel. 2019. Image-based prognostics using penalized tensor regression. Technometrics 61 (3):369–84. doi: https://doi.org/10.1080/00401706.2018.1527727.
- Fang, X., H. Yan, N. Gebraeel, and K. Paynabar. 2021. Multi-sensor prognostics modeling for applications with highly incomplete signals. IISE Transactions 53 (5):597–613. doi: https://doi.org/10.1080/24725854.2020.1789779.
- Frazier, P. I. 2018. Bayesian optimization. In Recent advances in optimization and modeling of contemporary problems, 255–78. INFORMS. https://doi.org/https://doi.org/10.1287/educ.2018.0188
- Friedman, M., and L. Savage. 1947. Planning experiments seeking maxima. In Selected techniques of statistical analysis, 364–372. New York, NY: McGraw Hill.
- Gartner. 2021. Hype Cycle for Artificial Intelligence, 2021. Gartner Identifies Four Trends Driving Near-Term Artificial Intelligence Innovation. https://www.gartner.com/en/newsroom/press-releases/2021-09-07-gartner-identifies-four-trends-driving-near-term-artificial-intelligence-innovation
- Gebraeel, N. Z., M. A. Lawley, R. Li, and J. K. Ryan. 2005. Residual-life distributions from component degradation signals: A Bayesian approach. IiE Transactions 37 (6):543–57. doi: https://doi.org/10.1080/07408170590929018.
- Goodfellow, I., Y. Bengio, and A. Courville. 2016. Deep learning. Cambridge, MA: MIT press.
- Gramacy, R. B. 2020. Surrogates: Gaussian process modeling, design, and optimization for the applied sciences. Boca Raton, FL: Chapman and Hall/CRC.
- Hong, Y., M. Zhang, and W. Q. Meeker. 2018. Big data and reliability applications: The complexity dimension. Journal of Quality Technology 50 (2):135–49. doi: https://doi.org/10.1080/00224065.2018.1438007.
- Hastie, T., R. Tibshirani, and J. Friedman. 2013. The elements of statistical learning: Data mining, inference, and prediction, 2nd ed., Springer Series in Statistics. Springer.
- Hotelling, H. 1941. Experimental determination of the maximum of a function. The Annals of Mathematical Statistics 12 (1):20–45. 1941. doi: https://doi.org/10.1214/aoms/1177731784.
- Hussain, F., R. Hussain, and E. Hossain. 2021. Explainable artificial intelligence (XAI): An engineering perspective. arXiv preprint arXiv:2101.03613.
- Jones, D. R., M. Schonlau, and W. J. Welch. 1998. Efficient global optimization of expensive black-box functions. Journal of Global Optimization 13 (4):455–92. doi: https://doi.org/10.1023/A:1008306431147.
- Kiefer, J., and J. Wolfowitz. 1952. Stochastic estimation of the maximum of a regression function. The Annals of Mathematical Statistics 23 (3):462–6. doi: https://doi.org/10.1214/aoms/1177729392.
- Kim, M., J.-R. C. Cheng, and K Liu. 2021. An adaptive sensor selection framework for multisensor prognostics. Journal of Quality Technology. doi: https://doi.org/10.1080/00224065.2021.1960934.
- Kohavi, R., R. M. Henne, and D. Sommerfield. 2007. Practical guide to controlled experiments on the web: Listen to your customers not to the HiPPO. In Proceedings of the 13th ACM SIGKDD International Conference on Knowledge Discovery and Data Mining, 959–67.
- Lian, J., L. Freeman, Y. Hong, and X. Deng. 2021. Robustness with respect to class imbalance in artificial intelligence classification algorithms. Journal of Quality Technology. doi: https://doi.org/10.1080/00224065.2021.1963200.
- Li, H., E. Del Castillo, and G. Runger. 2020. On active learning methods for manifold data. Test 29 (1):1–33. doi: https://doi.org/10.1007/s11749-019-00694-y.
- Li, W., F. Tsung, Z. Song, K. Zhang, and D. Xiang. 2021. Multi-sensor based landslide monitoring via transfer learning. Journal of Quality Technology. doi: https://doi.org/10.1080/00224065.2021.1960936.
- Lin, C.-Y. 2021. Forward stepwise random forest analysis for experimental designs. Journal of Quality Technology. doi: https://doi.org/10.1080/00224065.2020.1865853.
- Liu, X., and R. Pan. 2021. Boost-R: Gradient boosted trees for recurrence data. Journal of Quality Technology. doi: https://doi.org/10.1080/00224065.2021.1948373.
- Marcinkevičs, R., and J. E. Vogt. 2020. Interpretability and explainability: A machine learning zoo mini-tour. arXiv preprint arXiv:2012.01805.
- Meeker, W. Q., and L. A. Escobar. 1998. Statistical methods for reliability data. New York: Wiley.
- Murdoch, W. J., C. Singh, K. Kumbier, R. Abbasi-Asl, and B. Yu. 2019. Definitions, methods, and applications in interpretable machine learning. Proceedings of the National Academy of Sciences 116 (44):22071–80. doi: https://doi.org/10.1073/pnas.1900654116.
- Murphy, K. P. 2012. Machine learning: A probabilistic perspective. Cambridge, MA: MIT press.
- Myers, R. H., D. C. Montgomery, and C. M. Anderson-Cook. 2016. Response surface methodology: Process and product optimization using designed experiments. New York, NY: John Wiley & Sons.
- Newman, M. 2010. Networks. Oxford, UK: Oxford University Press.
- Pearl, J. 2009. Casualty, models, reasoning and inference, 2nd ed. New York, NY: Cambridge University Press.
- Peterson, J. J. 2004. A posterior predictive approach to multiple response surface optimization. Journal of Quality Technology 36 (2):139–53. doi: https://doi.org/10.1080/00224065.2004.11980261.
- Peterson, J., and E. del Castillo. 2021. Process optimization with multiple response variables: A predictive distribution approach with R and stan. forthcoming, Boca Raton, FL: CRC Press.
- Pronzato, L. 2000. Adaptive optimization and D-optimum experimental design. Annals of Statistics 28 (6):1743–61.
- Psarakis, S. 2011. The use of neural networks in statistical process control charts. Quality and Reliability Engineering International 27 (5):641–50. doi: https://doi.org/10.1002/qre.1227.
- Rasmussen, C. E., and., and C. K. I. Williams. 2006. Gaussian processes for machine learning. Cambridge, MA: The MIT Press.
- Reisi Gahrooei, M., H. Yan, K. Paynabar, and J. Shi. 2021. Multiple tensor-on-tensor regression: An approach for modeling processes with heterogeneous sources of data. Technometrics 63 (2):147–59. doi: https://doi.org/10.1080/00401706.2019.1708463.
- Robbins, H., and S. Monro. 1951. A stochastic approximation method. The Annals of Mathematical Statistics 22 (3):400–7. doi: https://doi.org/10.1214/aoms/1177729586.
- Rubin, D. B. 1978. Bayesian inference for causal effects: The role of randomization. Annals of Statistics 7:34–58.
- Russell, S., and P. Norvig. 2021. Artificial intelligence: A modern approach. 4th ed. Pearson.
- Sergin, N. D., and H. Yan. 2021. Toward a better monitoring statistic for profile monitoring via variational autoencoders. Journal of Quality Technology. doi: https://doi.org/10.1080/00224065.2021.1903821.
- Settles, B. 2009. Active learning literature survey. https://minds.wisconsin.edu/handle/1793/60660
- Shan, X., and D. W. Apley. 2008. Blind identification of manufacturing variation patterns by combining source separation criteria. Technometrics 50 (3):332–43. doi: https://doi.org/10.1198/004017008000000316.
- Shi, J. 2014. Stream of variations analysis. In Encyclopedia of systems and control, ed. J. Baillieul, T. Samad. London: Springer.
- Shortle, J. F., and M. B. Mendel. 2001. Physical foundations for lifetime distributions. In System and Bayesian reliability: Essays in honor of Professor Richard E Barlow on his 70th birthday, 257–66.
- Thompson, W., L. Hui, and A. Bolen. 2021. Artificial intelligence, machine learning, deep learning and more. SAS. https://www.sas.com/en_us/insights/articles/big-data/artificial-intelligence-machine-learning-deep-learning-and-beyond.html.
- Thomson, A. C. 1988. Real-time artificial intelligence for process monitoring and control. IFAC Proceedings Volumes 21 (13):67–72. doi: https://doi.org/10.1016/S1474-6670(17)53701-5.
- Turing, A. M., and J. Haugeland. 1950. Computing machinery and intelligence, 29–56. Cambridge, MA: MIT Press.
- Vapnik, V. N. 1998. Statistical learning theory. New York: Wiley.
- Wang, A., and J. Shi. 2021. Holistic modeling and analysis of multistage manufacturing processes with sparse effective inputs and mixed profile outputs. IISE Transactions 53 (5):582–596. doi: https://doi.org/10.1080/24725854.2020.1786197.
- Wasserman, S., and K. Faust. 1994. Social network analysis: Methods and applications. Cambridge University Press.
- Weese, M., M. Waldyn, M. M. Fadel, and A. Jones-Farmer. 2016. Statistical learning methods applied to process monitoring: An overview and perspective. Journal of Quality Technology 48 (1):4–24. doi: https://doi.org/10.1080/00224065.2016.11918148.
- Woodall, W. H., and D. C. Montgomery. 2014. Some current directions in the theory and application of statistical process monitoring. Journal of Quality Technology 46 (1):78–94. doi: https://doi.org/10.1080/00224065.2014.11917955.
- Yan, H., K. Paynabar, and M. Pacella. 2019. Point cloud data analysis for process modeling and optimization. Technometrics 61 (3):385–395. doi: https://doi.org/10.1080/00401706.2018.1529628.
- Yan, H., N. D. Sergin, W. A. Brenneman, S. J. Lange, and S. Ba. 2021. Deep multistage multi-task learning for quality prediction of multistage manufacturing systems. Journal of Quality Technology. doi: https://doi.org/10.1080/00224065.2021.1903822.
- Zhang, L. W., J. Lin, B. Liu, Z. C. Zhang, X. H. Yan, and M. H. Wei. 2019. A review on deep learning applications in prognostics and health management. IEEE Access. 7:162415–38. doi: https://doi.org/10.1109/ACCESS.2019.2950985.
- Zorriassatine, F., and J. D. T. Tannock. 1998. A review of neural networks for statistical process control. Journal of Intelligent Manufacturing 9 (3):209–224. doi: https://doi.org/10.1023/A:1008818817588.