
Article title: Design and properties of the predictive ratio cusum (PRC) control charts.
Authors: Bourazas, K., Sobas, F., & Tsiamyrtzis, P.
Journal: Journal of Quality Technology
Bibliometrics: Volume 55, Number 4, pages 404–421
DOI: https://doi.org/10.1080/00224065.2022.2161435
The R-code in the Supplementary Materials that produced had a minor issue; an updated version can be found under the Supplementary Materials for the original article and is also available via the R-package “bayespm” on CRAN (https://cran.r-project.org/web/packages/bayespm/). As a result, and the obtained FWER in Section 5 of the article have been updated.
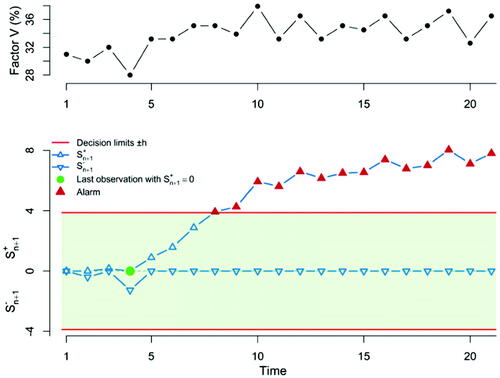
Figure 7. Predictive ratio cusum (PRC) for normal data. At the top panel, the data are plotted, while at the lower panel, we provide the PRC control chart focused on detecting an upward or downward mean step change of on standard deviation size, when we a FWER = 5% for 21 observations.
The corrections are as follows:
Page 416:
“h+ = 3.882” has been updated to “h+ = 3.749”
“h− = −3.882” has been updated to “h− = −3.749.”
“FWER = 5%” has been updated to “FWER = 10%”
“FWER = 2.5%” has been updated to “FWER = 5%”
Page 417:
has been replaced with an updated graphic.
“FWER = 5%” has been updated to “FWER = 10%” in the caption for .
The original version of and the corresponding text are preserved below:
“We derive the decision limit h+ = 3.882 (h− = −3.882) to achieve FWER = 5% for 21 observations (because we run two tests we used Bonferroni’s adjustment resulting FWER = 2.5% for each of the PRCs).”