
ABSTRACT
We investigate how the stereotype of the poor (vs. middle class) influences behavioral predictions. In Study 1, participants made predictions regarding another person’s economic behavior in scenarios pertaining to rate of time preferences (loss, gain of smaller and larger amount). We find that participants, across scenarios, expect individuals with low SES to show more short-sightedness—i.e., steeper temporal discounting. This pattern persisted until strong diagnostic information about previous economic behavior was provided. These results are novel but consistent with previous work on stereotype application. Study 2 probed stereotype accuracy. Participants with lower vs. higher SES reported how they would act in scenarios matching those of Study 1. We find that they respond very similarly, which is in contrast to the stereotype that poor people are more short-sighted and may possibly be taken to suggest that the association between low SES and short-sightedness is biased.
Stereotypes are beliefs about the attributes characterizing a social category or a group of people (Ashmore & Del Boca, Citation1981). Relying on stereotypes can allow us to make judgments and decisions quickly and with limited cognitive effort. This contributes to making stereotyping a common activity in our social lives, which even occurs automatically, outside awareness (Devine, Citation1989). However, stereotypes also cause faulty judgments and predictions. This is likely to happen if the content of the stereotype is inaccurate, or if there is an overreliance on the stereotype as compared to more diagnostic individuating behavior. Although stereotyping is a core issue in social psychological research, little is known regarding the effects of the stereotype of poor people on judgments of their economic behavior. The current study investigates, for the first time, the extent to which the stereotype of the poor influences predictions of individuals’ economic behavior, in the sense of whether or not they delay rewards.
The stereotype of the poor
The stereotype of poor people is similar across Western countries and includes unfavorable characteristics, such as laziness, irrationality, being uneconomical, and short-sighted (see e.g., Cozzarelli, Wilkinson, & Tagler, Citation2001; Kreidl, Citation2000; Lott, Citation2002; Woods, Kurtz-Costes, & Rowley, Citation2005); the stereotype appears both in free associations and implicit associations (Lindqvist, Björklund, & Bäckström, Citation2017). Since poor people are thought to be uneconomical and short-sighted, the stereotype may have an impact on judgments of their economic behavior. In fact, it has been suggested that poor individuals may be less willing to delay rewards (see e.g., Lawrance, Citation1991). This brings us to economic studies, where some economists have argued that individuals with low socio-economic status (SES) lack certain cognitive skills and abilities for making rational choices concerning work and education and thinking about the future, which they see as partly causing poverty (cf. Blank, Citation2003; Jung & Smith, Citation2007). Notably, however, certain behavioral economists instead explain the assumed differences in time preferences (i.e., the propensity to delay rewards) in terms of the perceived scarcity among individuals with low SES, which they argue would influence most people with shortage of money (Mani, Mullainathan, Shafir, & Zhao, Citation2013; Mullainathan & Shafir, Citation2013). In other words, whereas there is a consensus regarding the contents of the stereotype of the poor there is little consensus regarding whether the stereotype is accurate or not.
Time preferences
One particularly interesting aspect of the stereotype of the poor is the assumed short-sightedness. This relates directly to an issue that has been investigated intensely in both economics and psychology; the temporal aspect of rewards. The relative value put on an earlier vs. later reward is referred to as time preferences in economics, and as delay discounting or delay of gratification in psychology (Doyle, Citation2013; Frederick, Loewenstein, & O’Donoghue, Citation2002). Time preferences measure the extent to which current gratification is delayed for later reward, where the rate of time preference (RoT) can be quantified as the amount required to compensate for the delay. We use the term RoT as a measurement of (perceived) individual time preferences—i.e., the perceived steepness of the temporal discounting. Higher RoT implies short-sightedness, since it indicates a preference for gratification right now, even though this means a smaller gratification. RoT varies across different types of choices, but gains are generally discounted more than losses, and small amounts are discounted more than large amounts (Frederick et al., Citation2002). The present research concerns the predicted time preferences of individuals with low SES. We investigate whether poor people are stereotyped with regard to their RoT behavior.
Does the stereotype of the poor affect predictions of economic behavior?
As we have seen, the content of the stereotype suggests that poor people have a higher RoT. But to what extent is the stereotype of the poor applied in situations in which a particular individual is in focus rather than the group? Although we are not aware of any stereotyping studies regarding the poor, the general stereotyping mechanism has received considerable attention in social cognition, to which we turn next.
According to social cognitive theories, stereotypes are stored in memory. When triggered by a salient stimulus (e.g., gender, age, attire), they may be applied to a specific individual and affect the interpretation of the individual’s behavior. The stereotype also provides behavioral expectations, which allows for predictions of the individual’s future actions (Jones, Citation1990). When the behavioral information is sparse, such as when all we know is that the individual belongs to a certain group, we are particularly likely to rely on the stereotype for judgments and behavioral predictions.
Sometimes we have relevant information regarding an individual’s previous behavior and sometimes we don’t. When we have relevant behavioral information, we tend to rely on this rather than on the stereotype, particularly if the stereotype is relatively weak and the behavioral information relatively strong (Krueger & Rothbart, Citation1988). However, in many cases the behavioral information is weak, and ambiguous with regard to how it is to be interpreted. This opens up for the stereotype to influence how the behavior is mentally construed in the perceiver’s mind, and it may influence expectations about future behavior.
Previous related research in behavioral economics (Mobius & Rosenblat, Citation2006) and in social psychology (Carlsson, Björklund, & Bäckström, Citation2012) has asked participants to predict future behavior based on incomplete information—i.e., where the available relevant information for the prediction is limited. In these occasions, participants need to base their prediction on something more than just the information provided, where stereotypes might fill the gap. These earlier studies have attempted to mimic real-life situations, related to, e.g., recruitment, where predictions of others’ behavior are based on limited information (one piece of relevant behavior has been presented to anchor the judgment and act as a counterweight to the stereotype). The results show that behavioral predictions are affected by the activated stereotype, which concerned physical attractiveness (Mobius & Rosenblat, Citation2006) or nationality or profession (Carlsson et al., Citation2012). To date, there is no related research on the stereotype of the poor.
Are the poor so strongly associated with having high RoT that activation of the stereotype will affect predictions of their economic behavior? To test this, one may ask people to make predictions of poor and nonpoor individuals’ future behavior based on the exact same prior information. If there is little or unspecific prior behavioral information, the appeal of the stereotype should be relatively large. If the descriptions of the nature of the prior behavior are specific enough to be diagnostic, they should be perceived to form a better basis for prediction of future related behavior and leave less room for influence of the stereotype (Kunda & Sherman-Williams, Citation1993). To compare the influence of the stereotype and behavioral information on predictions of future behavior, the level of diagnosticity of the behavioral information can be manipulated in a systematic fashion. We will adopt this approach in the current study, and our participants will either be provided with no information on the individual’s previous RoT-behavior, with one relevant previous RoT-behavior, or with information on the individual’s general RoT-behavior in relevant previous situations. We analyze how different judgments of future economic behavior of individuals with low vs. high SES changes in the face of more diagnostic individuating behavior, in order to test the persistence of the stereotype, where the poor are predicted as less economic than the nonpoor.
In a related previous study, Kunda, Sinclair, and Griffin (Citation1997) found that stereotypes may indeed affect predictions of future behavior even when individuating information undermining the stereotype is presented, since stereotypes are multifaceted. In their study, the stereotypes concerned two different professions (lawyer and construction worker), and the behavioral predictions concerned the likelihood for future aggressiveness. The findings showed that the influence of the stereotype on predictions of future behavior was undermined in the presence of strongly diagnostic behavior regarding aggressiveness. Furthermore, however, the results also showed that, in spite of the behavioral information, there was still some room for the stereotype to exert influence on behavioral predictions regarding aggressiveness, since other aspects of the stereotype remained unchallenged. The current study differs from that of Kunda et al. (Citation1997) in that it concerns the stereotype of the poor and a particular kind of behavior: economic behavior pertaining to RoT. However, the same general pattern of findings as in Kunda and colleagues’ (Citation1997) study may appear. It is possible that, although more behavioral information leaves less room for the stereotype to guide the expectations of how the target individual will behave, the effect of the stereotype might not disappear completely, at least not when the diagnostic information is only of moderate strength (as compared to very strong and unquestionable).
Hypotheses
In the present research, we approach time preferences from a new angle; participants are asked to predict the RoT and economic behavior of others. We also investigate how the predicted economic short-sightedness of individuals with low and high SES differs depending on the amount of diagnostic information provided. Our hypotheses are:
(H1)
The stereotype of the poor will affect predictions of time preferences such that individuals with low SES are expected to make more short-sighted economic decisions than individuals with higher SES.
(H2)
When diagnostic information about earlier economic short-sightedness is provided, there will no longer be any difference between the predictions of individuals with low and higher SES.
Study 1 – The prediction of economic decisions depending on the agent’s SES
In the first study, we investigate how the stereotype of the poor influences predictions of other people’s economic decisions. These are set in three different decision contexts, pertaining to loss, small gain, and large gain.
Experimental design
All three experiments in Study 1 follow the same design but were run (simultaneously) on three different samples of participants. In each experiment, the participants were given a paper-and-pencil questionnaire consisting of a scenario with a short description of an individual (see Appendix AFootnote1). The three experiments concerned different scenarios, each representing a kind of situation (loss, small gain, large gain) in which discounting tendencies have been observed (cf. Frederick et al., Citation2002). In 50% of the scenarios, the individual was clearly described as having low SES, while they were clearly described as having high SES in the remaining 50%; otherwise, the scenarios were the same. There were no other cues to activate the stereotype of the poor, despite the information about personal finances. The participants were randomly assigned to either of the versions.
Each scenario was followed by a description of a situation in which the described individual had to make an economic decision. The participants were also provided with different levels of diagnostic information concerning how the individuals in the scenarios had acted earlier in similar situations (cf. Carlsson et al., Citation2012; Mobius & Rosenblat, Citation2006). One third of the scenarios had no diagnostic information; one third had moderately strong diagnostic information; one third had strong diagnostic information. To decrease the risk of revealing the aim of the study, the diagnostic information confirmed rather than disconfirmed the stereotype of the poor, and we analyzed the extent to which this information reduced the difference between how a low SES and a high SES individual was predicted to behave. The moderately strong diagnostic information stated that the individual once before had made a short-sighted decision in a similar situation, whereas the strong diagnostic information stated that the individual had a tendency to always show short-sightedness when making decisions in similar situations; the specific phrasing is found in Appendix A. The design was hence a 2 (SES) x 3 (diagnostic information) between subjects design.
Manipulation check
In social psychology, the stereotype content model (SCM) organizes all stereotypes into the two dimensions of warmth and competence (Fiske, Cuddy, Glick, & Xu, Citation2002). According to SCM, the content of the stereotype of the poor varies between low warmth/low competence to medium warmth/low competence depending on contextual factors (see e.g., Asbrock, Citation2010; Cuddy et al., Citation2009; Durante et al., Citation2013, Citation2017; Lindqvist et al., Citation2017). In order to validate that the stereotype of the poor was activated in our experiments (“manipulation check”), participants were asked to indicate how they perceived the described individuals in terms of warmth (friendly, well-intentioned, trustworthy, warm, good-natured, sincere) and competence (competent, confident, capable, efficient, intelligent, skillful). Ratings of the 12 items were made on a 5-point Likert scale, where higher values imply higher warmth and higher competence, respectively (cf. SCM; Fiske et al., Citation2002). Earlier research on stereotypes about the poor in a Swedish context has revealed that the stereotype consists of medium warmth/low competence, in which the differences compared to groups with higher SES primarily are found concerning significantly lower ratings on competence (Lindqvist et al., Citation2017).
Stimulus materials and procedure
Participants were asked to make two different predictions—one that was a direct measure of predicted time preferences (an RoT prediction) and one that was an indirect measure of time preferences (a far-sightedness prediction). In the prediction of economic far-sightedness, we informed the participants about the most economically sensible choice, which accordingly corresponded to low time preferences. Their task was to rate how likely they believed it was that the target individual would make the decision corresponding to low time preferences. Lastly, the participants were asked to guess the aim of the study, which no one succeeded in.
In the literature on time discounting, some empirical regularities appear. For example, gains are discounted more than losses, and small amounts are discounted more than large amounts (see e.g., Frederick et al., Citation2002). These regularities are described as anomalies to the discount utility model (see Samuelson, Citation1937), since the discount rate, according to the model, should be the same for all types of intertemporal decisions (Frederick et al., Citation2002). We used scenarios relating to these anomalies to form three different measures (different operationalizations of RoT).
Scenario 1, loss
In the first scenario, the individual received a traffic ticket of 200 SEK (25 USD) that could be paid either now or later. The RoT prediction was to state how much more one believed the individual was willing to pay if the payment could be delayed for three months. The far-sightedness prediction was to rate the likeliness that the individual would pay the ticket right away if the fee for delaying the payment was 85 SEK (10 USD).
Scenario 2, gain of smaller amount
In the second scenario, the individual was given the choice between buying a cheaper light bulb lasting for 400 h, for the price of 15 SEK (2 USD) or a more expensive light bulb lasting for 2800 h—i.e., seven times longer. The RoT prediction was to state how much more one believed the individual was willing to pay for the more expensive bulb. The far-sightedness prediction was to rate the likeliness that the individual would buy the more expensive light bulb if the cost was 90 SEK (11 USD).
Scenario 3, gain of a larger amount
In the third scenario, the individual was given the choice between a reward of 2000 SEK (240 USD) now or a larger amount delayed for 3 months. The RoT prediction was to state how much larger one believed the reward had to be for the individual to choose the delay. The far-sightedness prediction was to rate the likeliness that the individual would wait 3 months if the payment was 300 SEK (36 USD).
Individuals with low SES may of course not always have a choice—i.e., they may “have to” delay a payment due to lack of money. To control for this possible effect in the predictions, we informed the participants that the individuals in the scenarios had the money needed (for showing low-time preferences).
Participants
The experiment leader recruited the participants in a small city in Sweden, so accordingly participants were Swedish. The experiments took about 10 minutes to complete.
Scenario 1
One hundred and twenty individuals (self-identified as 59 women, 61 men) between 20–37 years old (M = 23.3, SD = 2.7). Their monthly income ranged between 0–96 000 SEK (M = 9 985 SEK ≈ 850 GBP).
Scenario 2
One hundred and twenty individuals (self-identified as 59 women, 61 men) between 18 and 38 years old (M = 23.8, SD = 3.0). Their monthly income ranged between 0 and 100 000 SEK (M = 9 589 SEK ≈ 810 GBP).
Scenario 3
One hundred and eighty individuals (self-identified as 90 women, 69 men, 4 non-binary, 15 did not indicate gender) between 20 and 44 years old (M = 23.6, SD = 3.2). Their monthly income ranged between 0 and 35 000 SEK (M = 9 190 SEK ≈ 780 GBP).
Manipulation check
shows mean values of rated warmth and competence of the described individual in Scenario 1–3. The difference in warmth depending on condition (SES) was not significant in Scenario 1, but in Scenario 2 and 3, in which the individual with low SES was rated as medium warm (FSc1(1, 113) = 3.05, p = .08; FSc2(1, 114) = 4.00, p = .048; FSc3(1, 167) = 5.86, p = .017). There was a significant difference in evaluated competence depending on SES in Scenario 1 (F(1, 114) = 74.62, p < .001) and Scenario 2 (F(1, 114) = 6.63, p = .011) and almost in Scenario 3 (F(2, 169) = 2.76, p = .066), showing a tendency to rate the individual with low SES as significantly less competent than the individual with high SES. Since these results correspond to earlier findings concerning the stereotype of the poor in a Swedish context, in which differences in competence are more noteworthy than differences in warmth (cf. Lindqvist et al., Citation2017), they validate that the participants perceived the target individuals to belong to the intended socioeconomic groups.
Table 1. Rated warmth and competence for the described individual in scenario 1–3 in Study 1, depending on SES (low/high) and diagnostic information (standard deviation within parentheses).
Results1
Does the stereotype of the poor (H1) and diagnostic information (H2) affect predictions of RoT and short-sightedness? To test the hypotheses, we performed an ANOVA with RoT in percent as the dependent variable, and SES and level of diagnostic information as independent variables. To adjust for differences in RoT between scenarios (cf. ), the RoT values for each of the three scenarios were transformed into the same scale, with a range between 0–100. Results showed a main effect of SES (F(1, 390) = 7.53, p = .006, η2 = .019) and diagnostic information (F(2, 390) = 12.72, p < .001, η2 = .061), but no interaction effect F(2, 390) = .932, p = .395, η2 = .005. Tukey’s post hoc tests revealed a significant difference between the condition with strong diagnostic information and the conditions with moderately diagnostic information (p < .001) and no information (p = .007), but not between the conditions with no and moderately diagnostic information (p = .164). The results indicate that the effect of SES ceased in the condition with strong diagnostic information—i.e. that the apparent size-difference of the SES-effect in the strong diagnostic condition held up in a direct statistical test.
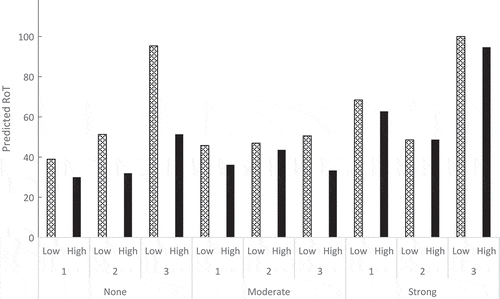
Figure 1. The predicted RoT (y-axis, in percent) of the described individual depending on their SES (low, high), scenario (1, 2, 3) and diagnostic information (none, moderate, strong).
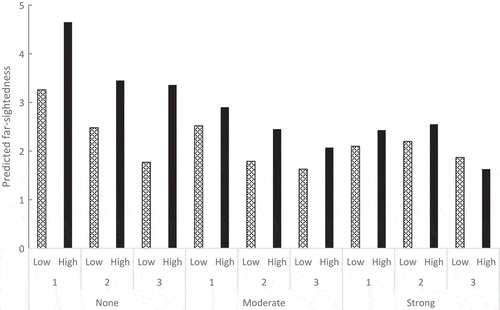
We also performed an ANOVA with far-sightedness as the dependent variable, and SES and level of diagnostic information as independent variables. Results showed a main effect of SES (F(1, 412) = 41.74, p < .001, η2 = .092) and diagnostic information (F(2, 412) = 39.94, p < .001, η2 = .162). Tukey’s post hoc tests revealed a significant difference between the condition with no diagnostic information and the conditions with moderately diagnostic information (p < .001) and strong information (p < .001), but not between the conditions with moderately and strong diagnostic information (p = .675). There was also a significant interaction effect of SES x diagnostic info (F(2, 412) = 14.43, p < .001, η2 = .065) where high values imply higher levels of assumed far-sightedness. The results support the supposition that the effect of SES ceases with diagnostic information.
To get a deeper understanding of the results, we also performed one ANOVA for each level of diagnostic information, with Scenario (1–3) and SES (low/high) as independent variables, and with both RoT (in percent) and far-sightedness as dependent variables. The mean values are shown in . shows the differences in RoT for each scenario depending on if the individual in the first scenario was described as having low or high SES and the amount of diagnostic information provided. High RoT implies preference for short-sighted decision-making receiving a smaller monetary reward sooner rather than a larger amount later. shows the evaluated far-sightedness depending on SES and level of diagnosticity for each scenario. High values imply higher levels of assumed far-sightedness.
Table 2. The estimated RoT (in percent) and far-sightedness (from 1–5) of the described individual for each level of diagnostic information provided in Study 1, depending on scenario (1–3) and SES (low/high) (standard deviation within parentheses).
Figure 2. Mean values of predicted far-sightedness (y-axis, from 1–5) of the described individual depending on their SES (low, high), scenario (1, 2, 3) and diagnostic information (no, moderate, strong).
No diagnostic information
For both RoT and far-sightedness, there was a main effect of scenario (FRoT(2, 118) = 4.67, p = .011; Ffar-sightedness(2, 132) = 24.47, p < .001). These differences between the three scenarios could be compared to earlier research on discounting. In that research, different kinds of economic situations imply different decisions in which small gains are discounted more than large gains, whereas large gains are discounted more than losses (cf. Frederick et al., Citation2002). These tendencies can be visually inspected in . More importantly, there was an effect of SES (FRoT(1, 118) = 3.97, p = .049, η2 = .280; Ffar-sightedness(1, 132) = 61.60, p < .001, η2 = .270), but no interaction effect (FRoT(2, 118) = .840, p = .434; Ffar-sightedness(2, 132) = 1.22, p = .298). Accordingly, in all three scenarios, low SES implied a tendency to estimate the individual’s RoT and short-sightedness as higher compared to if the individual were described as having high SES. This supports H1, confirming that the economic behavior of an individual with low SES is evaluated according to the stereotype of the poor.
Moderately diagnostic information
Results show a main effect of SES for both RoT (F(1, 129) = 8.91, p = .003, η2 = .038) and far-sightedness (F(1, 134) = 11.30, p = .001, η2 = .078). As in the condition with no diagnostic information, low SES implied a tendency to estimate the individual’s RoT and short-sightedness as higher compared to if the individual were described as having high SES, and it did so in all three scenarios (there was no interaction effect for either RoT, F(2, 129) = 1.54, p = .218, or far-sightedness, F(1, 134) = .322, p = .726. In accordance with H1, this indicates that the stereotype had an effect also when moderately diagnostic behavioral information was provided. With regard to differences across scenarios, there was an effect concerning far-sightedness, (F(2, 134) = 12.75, p < .001) but not for RoT (F(2, 129) = .542, p = .583).
Strong diagnostic information
Results show no main effect of SES (FRoT(1, 131) = .469, p = .495, η2 = .011; Ffar-sightedness(1, 134) = .748, p = .389, η2 = .006). This implies that the effect of the stereotype was no longer present in the conditions with strong diagnostic information. In other words, when individuals with high SES were described as having strong tendencies to make short-sighted economic decisions, they were evaluated as being just as uneconomical as the individuals with low SES. In addition to this, there was a main effect of scenario for both RoT (F(2, 131) = 8.23, p < .001) and far-sightedness (F(2, 134) = 5.80, p = .004), but no interaction effects (FRoT(2, 131) = .259, p = .772; Ffar-sightedness(2, 134) = 1.43, p = .243).
Participants’ personal income
To analyze whether the ratings of the described individuals differed depending on the income level of the participants, we made a median split of the participants’ personal income in all three scenarios, dividing them into the groups “low income” (<9 900 SEK ≈ 839 GBP) and “high income” (>9 901 SEK). Thereafter, we performed two ANOVAs with RoT and far-sightedness as dependent variables, respectively, and with scenario (1–3), diagnostic info (none, moderate, strong), SES of the described individual (low, high) and participants’ personal income (low, high) as independent variables. As expected, results showed main effects of scenario (FRoT(2, 356) = 8.453, p < .001, η2 = .045; Ffar-sightedness(2, 377) = 27.939, p < .001, η2 = .129), diagnostic info (FRoT(2, 356) = 7.442, p = .001, η2 = .040; Ffar-sightedness(2, 377) = 43.627, p < .001, η2 = .188) and SES of described individual (FRoT(1, 356) = 3.723, p = .054, η2 = .045; Ffar-sightedness(1, 377) = 37.623, p < .001, η2 = .091). However, results showed no main effects of participants’ own income (FRoT(1, 356) = .040, p = .842, η2 < .001; Ffar-sightedness(1, 377) = .233, p = .629, η2 = .001), and no interaction effect of SES of described individual and participants’ own income (FRoT(1, 356) = .012, p = .911, η2 < .001; Ffar-sightedness(1, 377) = .288, p = .592, η2 = .001), indicating that the ratings in Study 1 were not affected by income level.
To summarize, in line with H1, low SES implied the tendency to predict the individual’s short-sightedness to be significantly higher, compared to when the individual’s SES was high. The same tendency was found across scenarios not only in the condition with no diagnostic information, but also in the condition with moderately strong diagnostic information. Support for H2 was received by the findings from the condition with strong diagnostic information; in this condition, individuals with high SES were predicted to act just as short-sighted as the individuals with low SES. This was matched by the effect size for the SES-manipulation, which was large in the condition with no diagnostic information, intermediate in the condition with moderately strong diagnostic information, and very weak in the condition with strong diagnostic information.
Discussion
In three scenarios, we investigated whether the expected time preferences differ depending on whether the target individual has low or high SES. This approach, in which participants do not report on their own behavior but the predicted time preferences of another individual depending on their SES, is new for research on economic behavior. We expected that individuals with low SES would be predicted to make more short-sighted decisions in economic situations than individuals with high SES (H1). We also analyzed whether the predictions of an individual with low SES as more economically short-sighted compared to an individual with high SES decreased as diagnostic information concerning earlier short-sighted decisions was provided (H2).
The results from all three scenarios are striking in that they consistently show that individuals with low SES are predicted to make more short-sighted and uneconomical decisions compared to individuals with high SES. This was shown both in assumed rate of time preferences (RoT) and in assumed short-sightedness. When adding moderately diagnostic information concerning how the individual had chosen in similar situations before, there was still was an effect of SES despite the participants being provided with a piece of diagnostic information regarding the target individual’s previous behavior. Not until strong diagnostic information was provided did the differences between the individuals with low and high SES decrease such that the individual with high SES was evaluated as being just as short-sighted as the individual with low SES. Taking this together, our results suggest that stereotypes have a relatively robust effect on judgments of economic behavior, in which people with low SES are predicted to make relatively short-sighted decisions. Corresponding to previous research on other stereotypes (Kunda & Thagard, Citation1996), the difference in predictions of future behavior between our two target groups disappeared only when strong diagnostic information was provided.
Study 1 was conducted in Sweden. Although Sweden is perceived as a relatively egalitarian country, the stereotype content of the poor is similar to the stereotype observed in other Western countries, such as the UK (Lindqvist et al., Citation2017). It appears that, across cultures, the poor are perceived to be incompetent and somewhat cold. This suggests that our results regarding the influence of SES on predictions of economic behavior should be generalizable to other cultures, although notably what we study is the difference between the poor and the nonpoor.
Study 2 – Is the stereotype about poor people accurate?
The results from Study 1 showed that, unless strong diagnostic individuating information was provided, individuals with low SES were predicted to have higher time preferences and make more short-sighted economic decisions, which is in line with the stereotype of the poor. The assumption that poor people have high RoT may appear biased and problematic at first glance but requires careful consideration. Certain researchers in social psychology make the claim that the content of stereotypes generally is accurate (Lee, McCauley, & Jussim, Citation2013). Could this be the case regarding the economic behavior of the poor? Although there is data to suggest that the stereotype of low SES-students correctly reflects lower motivation (Madon et al., Citation1998), there is very limited research on the accuracy of the stereotype of the poor (Jussim et al., Citation2016) and no studies examining the accuracy of the stereotype in relation to economic behavior.
Research on time preferences and its connection to poverty/low SES has often been conducted in rural households in relatively poor societies. The results have varied. For example, in rural Mexico (Carvalho, Citation2010), Zimbabwe (Murphree, Citation1993) and in Vietnam (Tanaka, Camerer, & Nguyen, Citation2010) poor individuals tend to be more short-sighted and have relatively high time preferences, whereas in African countries such as Niger, Chad, and Mali, poor individuals rather tend to show relatively low time preferences, particularly when there is a shortage of food (Moseley, Citation2001). There is still a lack of research on the connection between time preferences and poverty in the Western world, and in addition to the inconsistencies in the findings from other parts of the world, cultural (cf. Wang, Rieger, & Hens, Citation2016) and welfare-level differences make it difficult to generalize the results to the West. In order to probe the accuracy of the stereotype of the poor, Study 2 investigated whether the economic decisions of individuals with low SES differ from those of individuals with higher SES. The study had a between subjects design, in which the participants were divided into two groups depending on their SES (low/high), and the decision scenarios matched those in Study 1.
Participants
The 600 participants (self-identified as 282 women, 309 men, 7 non-binary, 4 did not indicate gender) between 18 and 66 years old (M = 32.4; SD = 10.7) were recruited through the Web platform Prolific (www.prolific.ac), where it is possible to invite registered users to participate in research studies. It is also possible to screen the participants on background factors such as SES, which is assessed on a 10-point scale from 1 = lowest possible SES to 10 = highest possible SES, with anchoring descriptions of the highest and lowest steps (see Appendix B1). To make sure that the sample of poorer individuals would be large enough, we first (unbeknownst to the participants) restricted the sampling so that only participants with low SES (i.e., 1–3) were informed about the study and then later opened up the study to anyone. The self-defined SES of all 600 participants ranged from 1 to 9 with a mean value of 4.41 (SD = 1.83). The participants were divided into two groups depending on their SES, either “low SES” (1–3) or not low, called “medium/high SES” (4–9). In total, 231 participants (38.5 %) had “low” SES, and 369 participants (61.5 %) had “medium/high” SES.
To validate the results based on self-reported SES, we also included personal income in the analyses. In total, 253 participants (41.4 %) had provided information about their personal income. Among those, 177 participants (66%) had a yearly income of less than £ 20 000 (“low income”), while the remaining 91 (44%) had a yearly income of more than £ 20 000 (“medium/high income”).
Stimulus material
Participants were presented with three different scenarios describing economic situations. Their task was to indicate what decision they would make in each of the situations. This online questionnaire took about 10 minutes to complete.
The economic situations match those in Study 1. In the first situation, representing loss, the participants were asked to imagine that they had received a traffic ticket of 17 GBP that could be paid either now or later. They first stated how much more they were willing to pay if the payment could be delayed for 3 months. They then indicated how likely it was that they would pay the ticket right away if the fee for delaying the payment was 7 GBP (i.e., 40% more).
In the second situation, representing gain of a smaller amount, the participants were asked to imagine that they were about to buy a light bulb. Their choice was between a cheaper light bulb lasting for 400 hours, for the price of 1.5 GBP, or a more expensive light bulb lasting for 2800 hours—i.e., seven times longer. They first stated how much more they were willing to pay for the more expensive bulb. They then indicated how likely it was that they would buy the more expensive light bulb if the cost were 8 GBP (i.e., 15% less than buying seven cheaper bulbs).
In the third situation, representing gain of a larger amount, the participants were asked to imagine that they were given the choice between a reward of 170 GBP now, or a larger amount delayed for 3 months. They first stated how much larger the reward had to be for them to choose the delay for 3 months. They then indicated if they would delay the reward if the amount were 195 GBP—i.e., 15% larger.
We assume that for all three situations the most sensible choice is to demonstrate low RoT, since that decision implies a larger reward in the long run. Following the design of Study 1, the first task of each situation (“RoT”) could be seen as a direct measure of the rate of time preferences, whereas the second task (“far-sightedness”) could be seen as an indirect measure of time preferences.
Results1
The general tendencies in time preferences observed in previous research (cf. Frederick et al., Citation2002) were confirmed. In that research, small gains (M = 93.18, SD = 2.71) are discounted more than large gains (M = 8.98, SD = 10.48), t(599) = 192.69, p < .001, whereas large gains are discounted more than losses (M = 2.91, SD = 4.61), t(599) = 13.97, p < .001 (mean values represent the amount required to compensate for the delay in percent, and higher values imply higher time preferences).
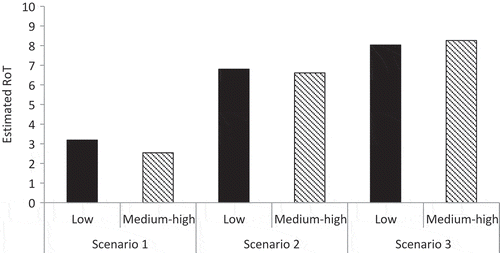
and show the participants’ RoT for each of the three scenarios, depending on their self-reported SES () or their personal income (). To enable comparison across scenarios, the values are transformed into percentages. Higher values correspond to higher RoTs. The bars of the figures represent how much more the participants were willing to pay to delay their payment (Scenario 1); how much more they wanted to gain in order to buy the more expensive bulb (Scenario 2); and how much larger the reward had to be for them to delay it (Scenario 3).
Figure 3. Estimated RoT (y-axis, in percent) of the participants for each of the scenarios (1–3) depending on their SES (low, high).
Scenario 1: For which sum will the participant delay their payment? Scenario 2: How much cheaper must the more expensive bulb be for the participant to buy it? Scenario 3: How much larger must the reward be for the participant to delay it?
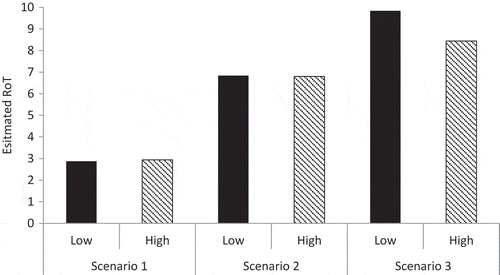
Figure 4. Estimated RoT (y-axis, in percent) of the participants for each of the scenarios (1–3) depending on their income (low, medium-high).
Scenario 1: For which sum will the participant delay their payment? Scenario 2: How much cheaper must the more expensive bulb be for the participant to buy it? Scenario 3: How much larger must the reward be for the participant to delay it?
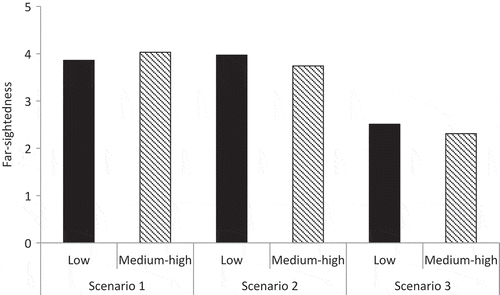
and show the predicted far-sightedness of the participants for each of the three scenarios, depending on their self-reported SES () or their personal income (). Each bar represents participants’ ratings of how likely they would be to make the most economically sensible decision (from 1–5), in which higher values imply higher likelihood—i.e., higher far-sightedness.
Figure 5. Mean values of estimated far-sightedness of the participants (y-axis, from 1–5, high values imply higher far-sightedness) for each of the scenarios (1–3) depending on their SES (low, medium-high).
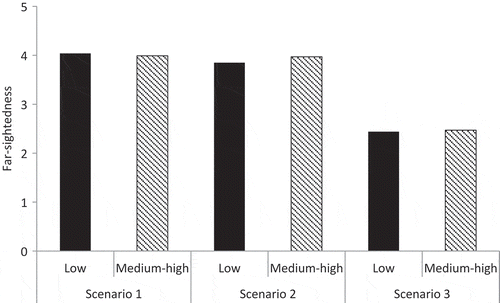
Figure 6. Mean values of estimated far-sightedness of the participants (y-axis, from 1–5, high values imply higher far-sightedness) for each of the scenarios (1–3) depending on their income (low, medium-high).
To reveal the overall effects of scenario, SES, and income on the economic decisions, two ANOVAs were performed, one with RoT as dependent variable and one with far-sightedness as dependent variable. It is worth noting that not all participants could be included in these analyses of variance, only those who had provided information about their income. shows the results from the analyses. As revealed in , there was a main effect of scenario for both RoT and far-sightedness, which was expected due to different discount tendencies for different economic situations. More importantly, there was no main effect of SES, no main effect of income, and no interaction effects of scenario and SES or of scenario and income.
Table 3. The results from ANOVAs analyzing the effects of scenario, and of participants’ SES and income, on economic decisions (RoT and far-sightedness) in Study 2.
Because we also wanted to analyze the effect of SES for all participants, not only those who had provided information about their income, we performed two more ANOVAs with RoT and far-sightedness as dependent variables, respectively, and scenario and SES as independent variables. shows the results from the analyses. As revealed in , the results follow those from the previous ANOVAs: For both RoT and far-sightedness, we found the expected main effect of scenario. However, we did not find a main effect of SES and no interaction effect of scenario and SES for either RoT or far-sightedness.
Table 4. The results from ANOVAs analyzing the effects of scenario, and of participants’ SES, on economic decisions (RoT and far-sightedness) in Study 2.
As a complement to the analyses of group differences, we also analyzed the pattern of correlations between SES and the economic decision variables, results are shown in . There were no significant correlations between SES and RoT or far-sightedness, or between income and RoT or far-sightedness. However, there was a significant positive correlation between SES and income (r = .33, p < .001).
Table 5. The correlations between participants’ SES, income, and their economic decisions (RoT and far-sightedness) in the different scenarios (1–3) in Study 2.
To summarize, there was no significant difference in RoT or far-sightedness between participants with low SES or medium/high SES, or between low income and medium/high income, in any of the three scenarios.
Assessing the stereotype (in)accuracy
In order to assess the (in)accuracy between the consensual stereotype of the poor and actual group characteristics for individuals with low SES or low income, we used discrepancy scores (i.e., mean differences between perception/stereotype, and actual values/criteria, cf. Jussim, Crawford, & Rubinstein, Citation2015) for RoT.
Effect sizes for Study 1 were calculated by subtracting the mean for predicted values of “poor” individuals with low SES (using data from the condition with no diagnostic information) from the mean for predicted values of “nonpoor” individuals and dividing this difference by the pooled standard deviation. Effect sizes for study 2 were calculated in the same way, by subtracting the mean for predicted values of respondents with low SES from the mean for predicted values of respondents with medium/high SES, and dividing this difference by the pooled standard deviation. The effect sizes were then translated into correlations, following the procedure described by Jussim and colleagues (Citation2016). According to their suggested standards, scores above .40 should be regarded as “accurate.” shows the correlations and discrepancy scores for RoT in all three scenarios. As shown in , all discrepancy scores were below .40 and cannot be interpreted as proof of stereotype accuracy.
Table 6. The perceived/predicted (Study 1) and actual (Study 2) correlation scores for all three scenarios. The actual scores are divided into the criteria of SES and income, representing our two definitions of “poor” in Study 2.
Discussion
Study 2 probed the accuracy of the idea that individuals with low SES are more short-sighted and make less sensible economical decisions, which is part of the stereotype of the poor (see e.g., Cozzarelli et al., Citation2001; Woods et al., Citation2005). If this aspect of the stereotype is correct, participants with low SES should differ from other participants in their economic behavior. However, in the three scenarios in which our participants were asked to indicate their economic decisions, we found no support for the idea that individuals with low SES have higher RoT. Hence we found no support for the idea that people with low SES have higher time preferences or are less economical compared to participants with medium/high SES. The findings are inconsistent not only with the stereotype content of the poor and with the findings from Study 1, in which individuals with low SES were predicted to act in a short-sighted manner, but also with previous research on time preferences suggesting that low SES implies high RoT (e.g., Lawrance, Citation1991).
It should be noted that our methodological approach differs from previous studies on RoT, which have often been conducted in rural villages in relatively poor countries (as in e.g., Moseley, Citation2001; Murphree, Citation1993). It is a limitation to our study that the situations our participants faced were hypothetical, and that they were asked to predict what decisions they believed they would make. This is different from most related economic research, which has concerned actual behavior. Finally, it is possible that the part of our sample that we refer to as poor differs from what came to our participant’s mind when they read the scenarios in Study 1 (i.e., the social group that was activated). However, given our rather substantial sample and variation in SES, the fact that low SES was unrelated to high RoT appears more consistent with an interpretation in terms of stereotype inaccuracy than stereotype accuracy.
General discussion and concluding remarks
The two studies reported here investigated the stereotype of the poor in relation to economic decisions, by analyzing how the stereotype affects predictions of others’ economic behavior as well as probing the accuracy of the stereotype itself. The measurement in focus was time preferences, following earlier research suggesting that individuals with low socioeconomic status (SES) discount more than individuals with higher SES. To our knowledge, this is the first time that time preferences have been analyzed in relation to stereotypes.
The first study revealed a consistent effect of the stereotype of the poor on the prediction of economic decisions, in which individuals with low SES were assumed to have higher RoT and make more short-sighted economic decisions compared to individuals with higher SES. These results are in accordance with the stereotype of the poor, hence confirming its impact on predictions of other’s behavior. The differences in how individuals with low and higher SES were predicted to behave did not cease until the individuals were described as having strong tendencies to make short-sighted economic decisions. Under moderately diagnostic information there was still a significant difference between the predictions of individuals with low and high SES.
The second study concerned stereotype accuracy and provided no support for the idea that poor individuals make particularly bad economic decisions: Participants with low SES showed neither higher RoT nor higher short-sightedness than participants with higher SES. This is in contrast with some earlier findings, which have indicated that the poor have high time preferences (see e.g., Carvalho, Citation2010; Murphree, Citation1993; Tanaka et al., Citation2010). However, earlier approaches have not statistically analyzed stereotype accuracy. Also, as already mentioned, there is little consensus regarding the RoT of the poor. Some researchers point to contextual factors such as scarcity as the cause of a higher RoT (cf. Mullainathan & Shafir, Citation2013). Since earlier research on poor people and their economic behavior has resulted in conflicting results, it is far too early to draw any strong conclusions regarding the actual RoT of the poor. Moreover, as most previous research on RoT of the poor have been field studies on deprived households and the like, it is possible that the conflicting results may be ascribed to population characteristics or to methodological differences. Vignettes and hypothetical scenarios are common in social psychological research. Although, in the present research, we attempted to create scenarios that correspond to situations that people face in their everyday lives, which increases the likelihood that participants are in the same psychological state as when in the real situation, their artificiality is an obvious limitation, but at the same time they enable creating comparable measurements, since all participants respond to the exact same information. Investigating stereotype accuracy is a complex endeavor, and the results of our second study does not present any conclusive evidence to suggest that applying the stereotype of the poor on their economic behavior is generally irrational. Rather, the results are merely tentative. Observing actual behavior, or designing novel experimental tasks that narrow the gap to how actual economic situations are experienced, thereby increasing the ecological validity of the results, are important avenues for future accuracy research.
We conclude with some thoughts regarding the practical implications of the current results. Our focus has been on how the stereotype of the poor affects people’s judgments in situations in which there is little at stake—i.e., typical expectancies of how low-SES individuals will behave in the kinds of economical situations that we all face in our everyday lives. In other contexts, the motivation for making accurate judgments concerning economic behavior will be higher. This is likely the case in professional contexts, such as when a bank clerk is granting a loan. In such cases, one is clearly responsible for the evaluation (cf. accountability; Lerner & Tetlock, Citation1999) and likely to put more time and effort into the evaluation. We can thus not infer from the present results that the poor are more likely than others to be denied resources—i.e., discriminated on the basis of their group membership. Suffice to say that to the extent that poor people are expected to make short-sighted economic decisions they should be less likely overall to receive financial support from others, and that the validity of such expectations may be put into question.
Data availability statement
The data described in this article are openly available in the Open Science Framework at http://dx.doi.org/10.17605/OSF.IO/4NT2W
Open Scholarship
 This article has earned the Center for Open science badges for Open Data and Open Materials through Open Practices Disclosure. The data and materials are openly accessible at http://dx.doi.org/10.17605/OSF.IO/4NT2W
Acknowledgments
This research was funded by the Swedish Research Council (grant 2014-203). The authors are grateful to Professor Martin Bäckström for valuable input on the research design. The authors also want to thank Professor Liam Delaney and his research group for valuable input on time preferences.
Notes
1. All materials and data can be found here: http://dx.doi.org/10.17605/OSF.IO/4NT2W.
References
- Asbrock, F. (2010). Stereotypes of social groups in Germany in terms of warmth and competence. Social Psychology, 41(2), 76–81. doi:10.1027/1864-9335/a000011
- Ashmore, R. D., & Del Boca, F. K. (1981). Conceptual approaches to stereotypes and stereotyping. In D. L. Hamilton (Ed.), Cognitive processes in stereotyping and intergroup behavior (pp. 1–35). New York, NY: Psychology Press.
- Blank, R. (2003). Selecting among anti-poverty policies: Can an economist be both critical and caring? Review of Social Economy, 61(4), 447–469. doi:10.1080/0034676032000160949
- Carlsson, R., Björklund, F., & Bäckström, M. (2012). Mixed discriminatory judgments of individuals’ warmth and competence-related abilities. Social Psychology, 43(3), 160–167. doi:10.1027/1864-9335/a000094
- Carvalho, L. S. (2010). Poverty and time preference (RAND Working Paper Series WR-759). doi:10.2139/ssrn.1625524
- Cozzarelli, C., Wilkinson, A. V., & Tagler, M. J. (2001). Attitudes toward the poor and attributions for poverty. Journal of Social Issues, 57(2), 207–227. doi:10.1111/0022-4537.00209
- Cuddy, A. J. C., Fiske, S. T., Kwan, V. S. Y., Glick, P., Demoulin, S., Leyens, J.-P., … Ziegler, R. (2009). Stereotype content model across cultures: Towards universal similarities and some differences. British Journal of Social Psychology, 48(1), 1–33. doi:10.1348/014466608X314935
- Devine, P. G. (1989). Stereotypes and prejudice: Their automatic and controlled components. Journal of Personality and Social Psychology, 56(1), 5–18. doi:10.1037/0022-3514.56.1.5
- Doyle, J. R. (2013). Survey of time preference, delay discounting models. Judgment and Decision Making, 8(2), 116–135. doi:10.2139/ssrn.1685861
- Durante, F., Fiske, S. T., Kervyn, N., Cuddy, A. J. C., Akande, A., Adetoun, B. E., … Storari, C. C. (2013). Nations’ income inequality predicts ambivalence in stereotype content: How societies mind the gap. British Journal of Social Psychology, 52(4), 726–746. doi:10.1111/bjso.12005
- Durante, F., Tablante, C. B., & Fiske, S. T. (2017). Poor but warm, rich but cold (and competent): Social classes in the stereotype content model. Journal of Social Issues, 73(1), 138. doi:10.1111/josi.12208
- Fiske, S. T., Cuddy, A. J., Glick, P., & Xu, J. (2002). A model of (often mixed) stereotype content: Competence and warmth respectively follow from perceived status and competition. Journal of Personality and Social Psychology, 82(6), 878–902. doi:10.1037/0022-3514.82.6.878
- Frederick, S., Loewenstein, G., & O’Donoghue, T. (2002). Time discounting and time preference: A critical review. Journal of Economic Literature, 40(2), 351–401. doi:10.1257/002205102320161311
- Jones, E. E. (1990). Interpersonal perception. New York, NY: W.H. Freeman.
- Jung, S., & Smith, R. (2007). The economics of poverty: Explanatory theories to inform practice. Journal of Human Behavior in the Social Environment, 16(1/2), 21–39. doi:10.1300/J137v16n01_03
- Jussim, L., Crawford, J. T., Anglin, S. M., Chambers, J. R., Stevens, S. T., & Cohen, F. (2016). Stereotype accuracy: One of the largest and most replicable effects in all of social psychology. In T. D. Nelson (Ed.), Handbook of prejudice, stereotyping, and discrimination (2nd ed., pp. 31–63). New York, NY: Psychology Press.
- Jussim, L., Crawford, J. T., & Rubinstein, R. S. (2015). Stereotype (in) accuracy in perceptions of groups and individuals. Current Directions in Psychological Science, 24(6), 490–497. doi:10.1177/0963721415605257
- Kreidl, M. (2000). Perceptions of poverty and wealth in western and post-communist countries. Social Justice Research, 13(2), 151–176. doi:10.1023/A:1007597807110
- Krueger, J., & Rothbart, M. (1988). Use of categorical and individuating information in making inferences about personality. Journal of Personality and Social Psychology, 55(2), 187–195. doi:10.1037/0022-3514.55.2.187
- Kunda, Z., & Sherman-Williams, B. (1993). Stereotypes and the construal of individuating information. Personality and Social Psychology Bulletin, 19(1), 90–99. doi:10.1177/0146167293191010
- Kunda, Z., Sinclair, L., & Griffin, D. (1997). Equal ratings but separate meanings: Stereotypes and the construal of traits. Journal of Personality and Social Psychology, 72(4), 720–734. doi:10.1037/0022-3514.72.4.720
- Kunda, Z., & Thagard, P. (1996). Forming impressions from stereotypes, traits, and behaviors: A parallel-constraint-satisfaction theory. Psychological Review, 103(2), 284–308. doi:10.1037/0033-295X.103.2.284
- Lawrance, E. C. (1991). Poverty and the rate of time preference: Evidence from panel data. Journal of Political Economy, 99(1), 54–77. doi:10.1086/261740
- Lee, Y.-T., McCauley, C., & Jussim, L. (2013). Stereotypes as valid categories of knowledge and human perceptions of group differences. Social and Personality Psychology Compass, 7(7), 470–486. doi:10.1111/spc3.12039
- Lerner, J. S., & Tetlock, P. E. (1999). Accounting for the effects of accountability. Psychological Bulletin, 125(2), 255–275. doi:10.1037/0033-2909.125.2.255
- Lindqvist, A., Björklund, F., & Bäckström, M. (2017). The perception of the poor: Capturing stereotype content with different measures. Nordic Psychology, 1–17. doi:10.1080/19012276.2016.1270774
- Lott, B. (2002). Cognitive and behavioral distancing from the poor. American Psychologist, 57(2), 100–110. doi:10.1037/0003-066X.57.2.100
- Madon, S., Jussim, L., Keiper, S., Eccles, J., Smith, A., & Palumbo, P. (1998). The accuracy and power of sex, social class, and ethnic stereotypes: A naturalistic study in person perception. Personality and Social Psychology Bulletin, 24(12), 1304–1318. doi:10.1177/01461672982412005
- Mani, A., Mullainathan, S., Shafir, E., & Zhao, J. (2013). Poverty impedes cognitive function. Science, 341(6149), 976–980. doi:10.1126/science.1238041
- Mobius, M. M., & Rosenblat, T. S. (2006). Why beauty matters. American Economic Review, 96(1), 222–235. doi:10.1257/000282806776157515
- Moseley, W. G. (2001). African evidence on the relation of poverty, time preference and the environment. Ecological Economics, 38, 317–326. doi:10.1016/S0921-8009(01)00184-7
- Mullainathan, S., & Shafir, E. (2013). Scarcity: Why having too little means so much. New York, NY: Times Books, Henry Holt and Company.
- Murphree, M. W. (1993). Communal land wildlife resources and rural district council revenues. Mount Pleasant, Harare: Centre for Applied Social Sciences, University of Zimbabwe.
- Samuelson, P. (1937). A note on measurement of utility. The Review of Economic Studies, 4(2), 155–161. doi:10.2307/2967612
- Tanaka, T., Camerer, C. F., & Nguyen, Q. (2010). Risk and time preferences: Linking experimental and household survey data from Vietnam. American Economic Review, 100(1), 557–571. doi:10.1257/aer.100.1.557
- Wang, M., Rieger, M. O., & Hens, T. (2016). How time preferences differ: Evidence from 53 countries. Journal of Economic Psychology, 52, 115–135. doi:10.2139/ssrn.1481443
- Woods, T., Kurtz-Costes, B., & Rowley, S. (2005). The development of stereotypes about the rich and poor: Age, race, and family income differences in beliefs. Journal of Youth and Adolescence, 34(5), 437–445. doi:10.1007/s10964-005-7261-0