


 ?Mathematical formulae have been encoded as MathML and are displayed in this HTML version using MathJax in order to improve their display. Uncheck the box to turn MathJax off. This feature requires Javascript. Click on a formula to zoom.
ABSTRACT
A stereotype is a generalization about a class of people which is often used to make probabilistic predictions about individuals within that class. Can stereotypes can be understood as conditional probabilities that distinguish among groups in ways that follow Bayesian posterior prediction? For instance, the stereotype of Germans as industrious can be understood as the conditional probability of someone being industrious given that they are German. Whether such representations follow Bayes’ rule was tested in a replication and extension of past work. Across three studies (N = 2,652), we found that people’s judgments of different social categories were appropriately Bayesian, in that their direct posterior predictions were aligned with what Bayes’ rule suggests they should be. Moreover, across social categories, traits with a high calculated diagnostic ratio generally distinguished stereotypic from non-stereotypic traits. The effects of cognitive ability, political orientation, and motivated stereotyping were also explored.
What is the likelihood that a person has a certain trait given they belong to a certain group? This fundamental stereotyping question is, at its core, a question of prediction involving conditional probabilities. For instance, would we predict that Tom is more industrious than his colleagues because he is German? As a conditional probability, such prediction should be governed by Bayes’ theorem. Hence, an important question in stereotyping research is the following: when we use stereotypes to predict people’s traits, do our predictions follow Bayes’ rule? Moreover, given that prediction is useful to the extent that it provides diagnostic information (the fact that Tom breathes oxygen is uninformative), are the traits that we include in our stereotypes those that distinguish one group from another? This way of thinking about stereotypes is consistent with the definition of stereotypes as probabilistic predictions that distinguish one group from another. The current work aims to test the degree to which people’s stereotype representation and use follows Bayesian reasoning.
Along with studying stereotypes as probabilistic predictions, there are three additional goals of the current work. First, we aim to reinvigorate McCauley and Stitt’s research program (Citation1978) which conceptualized stereotypes as diagnostic Bayesian predictions. Second, we test the role of cognitive ability in stereotyping, as people with higher cognitive ability can be relatively more efficient at forming and updating stereotypes (Lick et al., Citation2018). Third, we explore the ways in which this research program might provide a novel approach to studying motivated stereotyping (Dunton & Fazio, Citation1997; Kunda & Sherman-Williams, Citation1993; Kundra & Sinclair, Citation1999; Sinclair & Kunda, Citation2000). Below we briefly define stereotypes, explain Bayes’ Theorem, elaborate on McCauley and Stitt’s prior work (Citation1978), and then describe our experiments.
How are stereotypes defined?
Lippman (Citation1922) first defined stereotypes as “factually incorrect, produced through illogical reasoning, rigid.” Since then, researchers have defined stereotypes in several ways, including for example as a generalization or concept that may be good, bad, or neutral (Brigham, Citation1971; Secord, Citation1959; Vinacke, Citation1949) or as an inaccurate judgment that is learned incorrectly (Klineberg, Citation1951), overgeneralized (Allport, Citation1958), exaggerated (Jost & Hamilton, Citation2005; Katz & Braly, Citation1935; Lippman, Citation1922; Mullen & Johnson, Citation1990), or rigid (Adorno et al., Citation1950; Lippman, Citation1922). Nonetheless, category information is often used to make (i.e., diagnose) predictions about people within a particular group. But how do people generally represent and use stereotype information? The current work evaluates stereotype information within the framework of Bayes’ theorem.
Bayes’ theorem and stereotypes
McCauley and Stitt (Citation1978) proposed conceptualizing stereotypes as Bayesian conditional probabilities that distinguish one group from another.Footnote1 Bayes’ Theorem is the normative model for calculating conditional probabilities and is defined as follows:
The equation contains four components:
p(A|B) = posterior probability: probability of event A given event B
p(A) = prior probability of event A
p(B|A) = probability of event B given event A and
p(B) = probability of event B
where #3 and #4 make up the likelihood ratio. The posterior probability of event A given event B is derived by multiplying the prior by the likelihood ratio. We aimed to determine whether people’s stereotype representations followed Bayes’ theorem. To illustrate, we can rewrite Bayes’ rule as the conditional probability of an individual possessing a certain trait given that they belong to a certain group in the abstract:
And as a specific example:
Thus, the probability of A given B represents the probability that a person has a certain trait given that they belong to a certain group; for example, the probability a person is industrious given that he is German. Now, we ask whether people’s stereotypes are appropriately Bayesian––that is, does a person’s estimated stereotype (i.e., p(Trait|Group) or the probability that Tom is industrious, given being German) match what Bayes says it should be, given the component parts of Bayes” rule? This is the main idea behind McCauley and Stitt’s work (Citation1978), which is foundational for the current studies.
Our first goal was to extend this initial work by testing whether people’s judgments about a range of updated social category stereotypes are appropriately Bayesian. Moreover, within this broad question, there are several relevant subsidiary questions: 1) Does a Bayesian approach distinguish stereotypic traits from non-stereotypic traits for a given group? 2) What does it mean when people deviate from Bayes’ rule? 3) Are there personality or ideological characteristics associated with being more or less Bayesian?
The first question highlights an important feature of stereotype content: that such content distinguishes one group from another (McCauley et al., Citation1980). That is, stereotypes provide information about categories to aid prediction and help distinguish group members from other groups. The second question provides a potential avenue for identifying motivated stereotyping processes (see Experiment 3 for details). The third question explores important individual differences that may shed light on when and why people are Bayesian in their judgments of social groups.
Before getting into details of the present research, we want to make an important distinction between our questions and questions about stereotype accuracy. Stereotype accuracy concerns the degree to which people’s stored stereotype content accurately reflects existing group differences. For example, a person in fact is more likely to be industrious if he is German rather than Italian. In contrast, we are agnostic on the issue of accuracy. We focus solely on whether people’s mental representations and stereotype use follows Bayes’ theorem, and not on whether such information accurately reflects differences across social groups (see, e.g., Jussim et al., Citation2015, for more on stereotype accuracy).5
McCauley and Stitt’s (1978) experiment
Bayes’ rule is the normative theory for revising prediction given some data. McCauley and Stitt (Citation1978) hypothesized that, insofar as stereotypes are probabilistic predictions, people’s stereotyping judgments might follow Bayes’ rule. They presented participants with stereotypical and non-stereotypical traits about Germans and asked for a set of probabilistic judgments (described below). They wanted to test if 1) participants’ judgments followed Bayes’ rule and 2) stereotypical traits helped diagnose category membership. Specifically, they asked four questions corresponding to each element in Bayes’ Theorem (see EquationEquation 1(1)
(1) ), as follows:
1. p(A|B) = Probability of being industrious given that one is German: “What percent of Germans do you think are industrious?”
2. p(A) = Prior probability of being industrious: “What percent of all the world’s people do you think are industrious?”
3. p(B|A) = Probability of being German given that one is industrious: “What percent of industrious people do you think are German?”
4. p(B) = Prior probability of being German: “What percent of the world’s people do
you think are German?”
Q1 was the central stereotype judgment and participants directly estimated this quantity (the probability of being industrious given being German). They called this the judged posterior probability. They then computed the degree to which this judged posterior probability matched the calculated posterior probability. The calculated posterior probability is what Bayes’ theorem says the stereotype judgments should be, given component parts on the righthand side of Bayes’ theorem. The calculated posterior was derived by substituting values in the general formula with responses to the questions representing the prior and likelihood ratio. Imagine that participants’ responses to the above four questions (as measured on a scale ranging from 0 to 100) were 80, 45, 60, and 30, respectively. The calculated posterior would be:
This calculated posterior represented what Bayes’ rule states people’s responses should have been, whereas the judged posterior was participants’ own estimate of an existing stereotype about Germans (here, judged posterior = 80). If the calculated and judged posterior probabilities were highly correlated, this would indicate responding as per Bayes’ rule. Indeed, results showed a large correlation (r = 0.91). Another important aspect of the Bayesian approach is the claim that stereotypes are diagnostic – they distinguish one group from another. McCauley and Stitt (Citation1978) provided evidence of this by calculating a diagnostic ratio (DR). This ratio is the revision of a conditional probability considering base rate information:
Essentially, a DR was derived by dividing the judged posterior probability value (e.g., a person being industrious given that she is German) by the overall probability of any given person being industrious. DRs distinguish stereotypic traits from non-stereotype traits, such that stereotypic traits produce DRs greater than 1 and non-stereotypic traits produce DRs less than 1. Conceptually, DRs >1 suggest that it is more probable for a group to possess a certain trait than for the world in general to possess that trait. McCauley and Stitt (Citation1978) showed that stereotypically German traits (e.g., nationalistic, industrious) had DRs >1 whereas non-stereotypic traits did not (e.g., ignorant, impulsive). In sum, the authors showed that mental representations followed Bayes’ rule and diagnostic ratios were a reliable indicator of whether some trait was considered stereotypical of a given group (i.e., it distinguished one group from another).
The present experiments
We build on McCauley and Stitt’s (Citation1978) foundational work in several ways. An important first step given the age of original publication was to replicate and extend the original work to determine whether conceptualizing stereotypes as diagnostic predictions remains applicable today. A second advance was to explore the possibility of motivated stereotyping where known stereotypes did not yield DRs >1. A third advance was to study the role of cognitive ability to ask whether those with relatively higher cognitive ability reported judgments more closely aligned with Bayes’ theorem.
In Experiment 1, we focused on McCauley and Stitt’s (Citation1978) original experiment and extended their work by including eight social categories. We also added a free-response question asking participants to report stereotypes about a particular social category. In Experiment 2, we updated stereotypes based on responses to the free-response question from Experiment 1 and included six social categories. We included Motivation to Control Prejudiced Reactions (MCPR) and political orientation scales at the end of the experiment as exploratory questions (details discussed below). Experiments 1 and 2 used college student samples. In Experiment 3, we collected data from Amazon’s Mechanical Turk, used six social categories, a free-response question, and scales to measure Motivation to Control Prejudiced Reactions, political orientation, and cognitive ability (Raven’s Progressive Matrices or RPM).
Experiment 1
Here, we wanted to provide an initial test of whether people’s judgments about various social groups followed Bayes’ theorem. We hypothesized that 1) participants’ predictions would generally follow Bayes’ Theorem and 2) diagnostic ratios would be a measure of stereotypes – they would distinguish stereotypic from non-stereotypic traits.
Sample size, preregistration, and analytic approach
We collected data from XXX’s human subjects pool where participants completed the survey online in return for course credit (N = 652; Mage = 19.72 years, SDage = 2.14; 70.1% female; 62.1% White/European American, 17.8% Asian/Asian American, 8.92% Black/African American, 4.02% Hispanic, 3.32% Middle Eastern, 0.18% American Indian/Alaska Native, 0.18% Native Hawaiian/Pacific Islander, 3.5% other/prefer not to say). This study was preregistered on OSF (https://osf.io/8kbf6/). Data and analysis scripts can be found at https://osf.io/26v3m.
Methods
The present study involved a replicating and extending McCauley and Stitt’s (Citation1978) original experiment, with two changes. First, we included eight different social categories (two each of gender, sexual orientation, ethnic, and professional groups) instead of one category (Germans). Second, we included 10 traits specific to each category (five stereotypic, five non-stereotypic) chosen based on prior literature (e.g., Devine & Elliot, Citation1995; Jackson et al., Citation1997; Walker, Citation1958) and educated guesses. We used a mixed design wherein the between-subjects variable was that each participant was presented only one of eight social categories, and the within-subjects variable was that all participants within a social category saw all ten traits for that category. The traits used within each category are in of the Appendix. Additionally, at the end of the study participants listed common stereotypes about a social category (different from the one they saw in the main experiment) in a free-response format. We collected these data with the intention of revising any stereotype content as needed for Experiment 2.
Procedure & measures
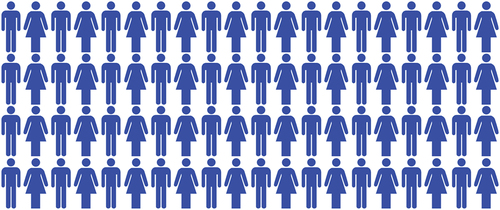
The main task included four questions about each of ten traits for a given social category. Participants were shown an icon array and asked to imagine that the icons represented all the people from a certain category (e.g., Asians) or with a certain trait (e.g., scientific; see ).
Figure 1. Icon array displayed across all the studies.
Participants were presented four questions corresponding to component parts of Bayes’ theorem for every trait within a category. For example, if the category was “male” and the trait was “ambitious,” participants were asked:
p(A|B) = “What percent of males do you think are ambitious?”
p(A) = “What percent of all the world’s people do you think are ambitious?”
p(B|A) = “What percent of ambitious people do you think are male?”
p(B) = “What percent of the world’s people do you think are male?”
These questions were presented in a random order to get all four components of Bayes’ theorem from EquationEquation 1(1)
(1) . After this, participants were randomly presented the next trait for the category “male” and again asked all four questions.
Once all 10 traits for a given category were presented, participants gave free response listings of stereotypes of a different social category than the one they received in the main task. We asked participants: “Please list common stereotypes about X category. You are not being asked to report your personal opinions or whether you think these stereotypes are true. You are simply being asked to list as many or as few stereotypes that other people might believe about that category.”
Results
The main predictions focused on the correlation between judged and calculated posterior probabilities (henceforth referenced as rJC) and whether the diagnostic ratios distinguished stereotypic from non-stereotypic traits. Recall that participants were asked four questions corresponding to Bayes’ rule from which a posterior probability was calculated (using responses to Qs 2–4 above) and compared to the judged posterior probability (Q1 above). A large rJC correlation would indicate that participants’ responses about the stereotype matched what Bayes’ rule states their responses should have been, given their responses on the component pieces of Bayes’ theorem. Indeed, we found that across all categories the rJC correlation was large (rJC = 0.80, t(78) = 11.72, 95% CI = [0.70, 0.87], p < .001), although there was relatively larger uncertainty in the estimates for the gay and lesbian categories compared to other categories and the correlation was not significant for lawyers (see ).Footnote2
Table 1. Correlations between participants’ judged and calculated posterior probabilities in experiment 1.
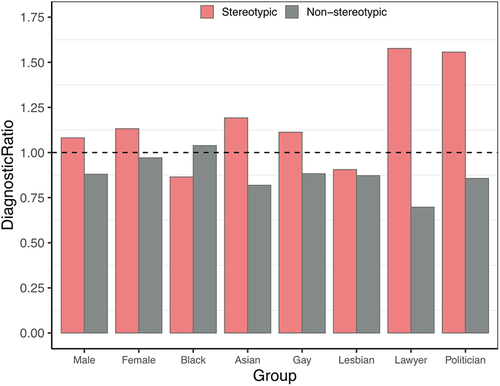
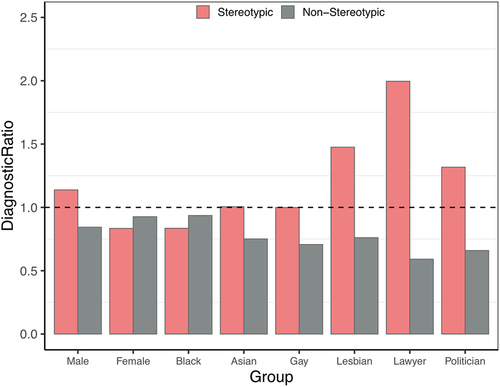
Next, we looked at the Diagnostic Ratio (DR; Equation 5). shows that the stereotypic traits for most social categories had DRs above 1.0, suggesting that these traits were more diagnostic of belonging to that particular category than the other categories. The average DR for stereotypic traits was 1.18 (SD = 0.33) and 0.87 (SD = 0.20) for non-stereotypic traits. This suggests that, on average, traits chosen as stereotypic in our experiment were also generally considered stereotypic of the given social categories by participants in our study.
Figure 2. Diagnostic ratios across all social groups in experiment 1.
Discussion
In Experiment 1, we tested whether participants’ predictions would generally follow Bayes’ Theorem and whether Diagnostic Ratios would distinguish stereotypic from non-stereotypic traits. In general, we found that participants’ responses were highly correlated with what Bayes’ theorem would suggest their responses should be (i.e., their responses for judged and calculated posterior probabilities were highly correlated). We also found that Diagnostic Ratios helped distinguish one category from another – stereotypic traits of a given group were more diagnostic of belonging to that group than any other group. Thus, both hypotheses were generally supported.
However, it is clear from that DRs from two categories did not follow the general trend. First, for the category lesbian, there was no difference in DRs between stereotypic and non-stereotypic traits. We suspected this might be due to outdated stereotypic traits of lesbians (a hypothesis we tested by feeding the free-response data for this category from Experiment 1 into Experiment 2). Second, for the category Black, non-stereotypic traits had higher diagnostic ratios overall compared to stereotypic traits. The stereotypic traits used were athletic, poor, criminals, aggressive, and loud; the non-stereotypic traits were loving, understanding, mature, secretive, and enthusiastic. A closer look at the pattern of results revealed that all positive traits received DRs greater than 1, whereas all negative traits received DRs less than 1; hence, participants appeared to be responding based on valence rather than stereotypicality (at least, “stereotypicality” as established by prior work). We suspected this pattern might reflect motivated responding.
To summarize, we suspected lesbian and Black data failed to follow the general pattern for two different causes. For the lesbian category, we predicted that updating the stereotype traits would produce the expected difference in DRs between stereotype and non-stereotype traits. For the Black category, we predicted that participants’ motivation to control prejudiced reactions (Dunton & Fazio, Citation1997) would relate to evaluative bias in DRs. To explore these possibilities and replicate results from Experiment 1, we conducted a second experiment.
Experiment 2
This experiment used the same design as Experiment 1 with one major change: we had six traits total (three stereotypic and three non-stereotypic) within each category instead of 10 traits (see in the Appendix). These traits were derived from the free-response question in Experiment 1 (i.e., traits with largest frequencies were used). The social categories remained the same as in Experiment 1. Our hypotheses were the same as in Experiment 1:1) participants’ predictions would generally follow Bayes’ Theorem and 2) diagnostic ratios would be a measure of stereotypes – they would distinguish one category from another. Additionally, we explored whether participants’ Motivation to Control Prejudiced Reactions and political orientation correlated with their DRs for the category Black.
Sample size, preregistration, and analytic strategy
We collected data from XXX’s human subjects participation pool (N = 800; Mage = 19.77 years, SDage = 2.01; 76.5% female; 66.1% White/European American, 13.6% Asian/Asian American, 9.05% Black/African American, 4.38% Hispanic, 2.12% Middle Eastern, 0.14% American Indian/Alaska Native, 4.67% other/prefer not to say; 10.7% strongly conservative, 31% conservative, 13.7% slightly conservative, 25.3% moderate, 8.2% slightly liberal, 9.19% liberal, 1.84% strongly liberal). This study was also preregistered on OSF (click here to view). Our analytic strategy was the same as in Experiment 1. Data and analysis scripts can be found at https://osf.io/gcw5v/.
Motivation, political orientation, & stereotyping
Was motivated cognition responsible for the DRs of the category Black? We approached this question in two ways. One research tradition has measured these tendencies directly, as indicated by individual difference variable “Motivation to Control Prejudiced Reactions” or MPCR. While not getting into the difference between prejudice and stereotyping, given the items of such scales (e.g., I always express my thoughts and feelings, regardless of how controversial they might be; I feel guilty when I have a negative thought or feeling about a Black person; If I have a prejudiced thought or feeling, I keep it to myself), it is reasonable to predict that participants high in MCPR would also be most likely to selectively endorse positive stereotypes of Black people.
Besides measuring motivation to control prejudiced reactions directly, one could also look to correlates of this tendency. Researchers have demonstrated large differences in stereotypes that conservatives and liberals hold (Nosek et al., Citation2007). Conservatives tend to show stronger (implicit and explicit) stereotypes than liberals such that stereotyping increases monotonically at each step from strong liberalism to strong conservatism. In the current work, we suspected people might differ in their motivation to control stereotyping toward certain categories (e.g., Black Americans) and that political orientation might be a proxy measure for such motivation. Hence, we measured these two variables and sought to explore how they impact participants’ judgments in our task. Below we note relevant details of the MCPR and political orientation scales, respectively.
Motivation to control prejudiced reactions
This self-report scale aimed to measure individual differences in people’s motivation to control prejudiced reactions (Dunton & Fazio, Citation1997). MCPR includes 17 items to which participants can either strongly disagree (−3) or strongly agree (3) using a 7-point Likert scale. The scale midpoint indicated “Neither agree not disagree.” MPCR’s reliability, predictive validity, and factor structure has been reported across multiple samples (Cronbach’s α > 0.74; Dunton & Fazio, Citation1997).
Political orientation
This was a single-item self-report scale to measure individual differences in people’s political orientations. The specific question used in the current work was: “When it comes to politics, do you think of yourself as a liberal, conservative, or moderate?.” The response scale ranged from “Strongly Liberal” to “Strongly Conservative” with the midpoint being “Moderate, middle of the road.” Such single-item scales are widely used and able to consistently measure liberal vs. conservative ideology (see Jost, Citation2006; Sibley et al., Citation2012).
Results
Like Experiment 1, our main predictions focused on the correlation between judged and calculated posterior probabilities and diagnostic ratios. Regarding the first prediction, we found a large rJC correlation, rJC = 0.78, t(46) = 8.42, 95% CI = [0.64, 0.87], p < .001. This replicated our findings from Experiment 1 and indicated that participants’ responses about the stereotype matched what Bayes’ rule states their responses should have been (see ).2
Table 2. Correlations between participants’ judged and calculated posterior probabilities in experiment 2.
The second prediction regarding Diagnostic Ratios was also generally supported, such that for five of eight categories stereotypic traits had DRs above 1.0 (see ). For six of eight categories, DRs were higher for stereotypic than non-stereotypic traits. The average DR for stereotypic traits was 1.13 (SD = 0.47), whereas for non-stereotypic traits was 0.77 (SD = 0.19). Hence, overall, the traits chosen as stereotypic in our experiment were also considered stereotypic of most social categories by participants in our study.
Figure 3. Diagnostic ratios across all social groups in experiment 2.
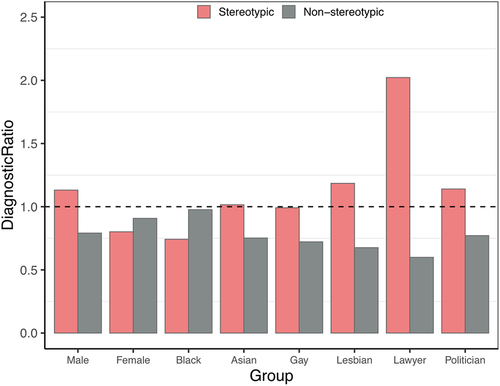
Importantly, the category lesbian now showed the predicted pattern, with stereotypic traits producing higher DRs than non-stereotypic traits. Updating traits based on data from Experiment 1 appeared to yield the predicted pattern, thus supporting our hypothesis that outdated trait terms may be responsible for DR’s failure to reach the 1.0 threshold for this category in Experiment 1.
Exploratory predictions & analyses
We explored whether two individual difference measures––Motivation to Control Prejudiced Reactions (MCPR) and political orientation––related to participants’ responses in two different ways. First, we tested whether they correlated with the degree to which DRs distinguished stereotypic from non-stereotypic traits. To do this, we computed average DRs for each participant based on trait type and then calculated a difference score by subtracting DRs for non-stereotypic traits from stereotypic traits, DRdiff. We then correlated this index with the individual difference measures. For instance, we correlated DRdiff with participants’ MCPR scores to test whether participants with higher motivation to control prejudiced reactions were more likely to separate stereotypic from non-stereotypic traits. We did this for the overall sample and subsetting responses for the category Black only. The only significant correlation that emerged was between DRdiff and political orientation among responses to the category Black. This indicated differences in how conservative and liberal participants distinguished stereotypic from non-stereotypic traits for the category Black, r = 0.27, t(89) = 2.64, 95% CI = [0.06, 0.45], p = .01.Footnote3
Second, we tested whether these individual differences related to the degree to which participants’ judged posteriors matched their calculated posteriors (i.e., the degree to which they were appropriately Bayesian in their judgments). To do this, we first computed the rJC correlation for each participant. We then correlated rJC values with each individual difference measure. For instance, we correlated rJC with political orientation to get an estimate of whether political orientation related to the degree to which participants were appropriately Bayesian in their judgments. We also broke this analysis down by stereotypic and non-stereotypic traits, to see whether the relationship held for only one or the other trait type. We did this for the overall sample and responses to the category Black only and found no significant correlations.3
In sum, the individual difference measures (motivation to control prejudiced reactions, political orientation) did not impact participants’ ability to make judgments or distinguish diagnostic traits for a certain category compared to others. However, political orientation may have impacted people’s judgments for the category Black. We wish to highlight that these analyses were exploratory and hence, should be considered with caution.
Discussion
In general, findings from Experiment 2 indicated participants’ responses were highly correlated with what Bayes’ theorem would predict their responses to be (i.e., their responses for judged and calculated posterior probabilities were highly correlated). We also found that diagnostic ratios helped distinguish one category from another – stereotypic traits of a given group were more diagnostic of belonging to that group than any other group. Thus, both hypotheses were supported.
However, DRs from two categories did not follow the general trend. First, for the female category, none of the traits were diagnostic of that category. Given that we observed the predicted pattern in Experiment 1, it is possible that this null finding is Type 2 error. Second, and more importantly, diagnostic ratios for most traits that were considered stereotypic of the Black category were all below 1.0, whereas all non-stereotypic traits were above 1.0. Although we did not find the predicted relationships with MCPR, this may be due to our sample being undergraduate participants who are particularly liberal (e.g., see Sidanius et al., Citation2008). Indeed, some findings suggest older people rely more on stereotypes and are more prejudiced than younger people (e.g., Gonsalkorale et al., Citation2009; Von Hippel et al., Citation2000). To explore these possibilities and replicate our findings from both prior experiments, we conducted Experiment 3 using a different sample.
Experiment 3
This experiment used the same design as Experiment 2, with six traits (three stereotypic, three non-stereotypic) within each category (see in Appendix). At the end of the study, we also included measures for Motivation to Control Prejudiced Reactions, political orientation, and an additional measure for cognitive ability (Raven’s Progressive Matrices; details below). We included these measures to replicate findings from Experiment 2 and test whether these variables correlated with participants’ judgments or accuracy in following Bayes’ theorem in three possible ways. First, in Experiments 1 and 2 we found that for the category Black, participants had higher DRs for non-stereotypic traits than for stereotypic traits and we wanted to test this relationship in a more diverse, adult sample. Second, Nosek, Smyth, Hansen, Devos, Lindner, Ranganath, and others (Citation2007) showed in a large review that political orientation impacts the strength of people’s stereotype beliefs. Third, Lick et al. (Citation2018) suggest cognitive ability might play a role in how people update their stereotypes (we discuss this point in more detail below). We also included the free-response question from Experiment 1 wherein we asked participants to report common stereotypes about a group other than the one they rated.
Our hypotheses were the same as in Experiments 1 and 2:1) participants’ predictions would generally follow Bayes’ Theorem and 2) diagnostic ratios would be a measure of stereotypes – they would distinguish one category from another. Additionally, as an exploratory investigation, we tested whether 1) people with relatively higher cognitive ability provided stereotype predictions that were more likely to follow Bayes’ rule than those with lower cognitive ability and 2) political orientation related to participants’ predictions.
Sample size, preregistration, and analytic strategy
We collected data from Amazon’s Mechanical Turk (N = 1200; Mage = 40.87 years, SDage = 13.59; 69.5% female; 70.5% White/European American, 5.31% Asian/Asian American, 10.6% Black/African American, 6.55% Hispanic, 0.62% Middle Eastern, 0.53% American Indian/Alaska Native, 0.53% Native Hawaiian/Pacific Islander, 5.31% other/prefer not to say; 5.67% strongly conservative, 13% conservative, 10.5% slightly conservative, 25.5% moderate, 10.7% slightly liberal, 21.2% liberal, 13.4% strongly liberal) and participants were paid $0.50 for participating in the study. This study was not preregistered but documentation about the project overview, data collection plan, procedure, and predictions were uploaded on OSF before data collection began (here). Our analytic strategy was the same as in Experiments 1 and 2. Data and analysis scripts can be found at https://osf.io/cr8sh/.
Stereotyping & cognitive ability
Stereotypes can be conceptualized as learned behavioral patterns about a group that can be generalized to individuals within that group. This suggests that pattern detection is an important ability which can differentially influence stereotype activation and use among individuals. Lick et al. (Citation2018) found that people with higher cognitive ability were better at learning, activating, and applying stereotypes. Further, people more readily update their stereotypes when given counter-stereotypical information. Given these findings, we included a test of cognitive ability to explore whether participants’ judgments differed by their cognitive abilities. Specifically, using Raven’s 2, we wanted to test whether relatively superior pattern detectors provided stereotype predictions more aligned with Bayes’ theorem compared to inferior pattern detectors.
Raven’s progressive matrices (Raven’s 2)
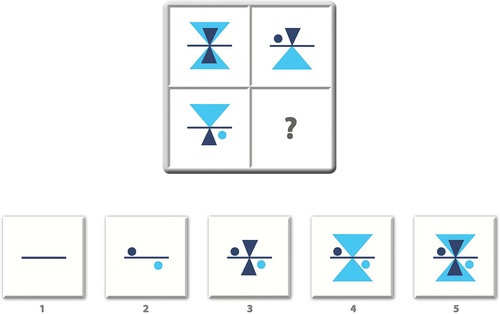
Raven’s 2 is a nonverbal self-report scale aimed at measuring individual differences in cognitive ability like observation skills, reasoning ability, and intellectual capacity (Raven, Citation2000, Citation2003). The test consists of a series of monochrome diagrams or designs with a missing part which is completed when people recognize the missing part from the options provided under each diagram (see ). Raven’s 2 combines three older batteries into one test and includes novel test items because older items have been widely used and exist within the public domain. The test’s long form has colored items and can be administered on adults above 18 years of age. The test has been normed against a representative US sample and has high internal consistency reliability, r = 0.89. More information about Raven’s 2 is available here.
Figure 4. An example of the Raven’s 2 item.
Results
As in the prior two experiments, our main predictions focused on the correlation between judged and calculated posterior probabilities and the role of diagnostic ratios. We found a large rJC correlation, rJC = 0.79, t(46) = 8.67, 95% CI = [0.65, 0.88], p < .001. This replicated our findings from Experiments 1, 2 and indicated that participants’ judged responses matched their responses computed based on Bayes’ rule (see ).2
Table 3. Correlations between participants’ judged and calculated posterior probabilities in experiment 3.
The second prediction about DRs indicated that for approximately five of eight categories, stereotypic traits had DRs above 1.0, which suggests these traits were more diagnostic of belonging to that particular category than the other categories (see ). For six of eight categories, DRs for stereotypic traits were higher than DRs for non-stereotypic traits. Overall, the average DR for stereotypic traits was 1.20 (SD = 0.49), whereas for non-stereotypic traits, it was 0.77 (SD = 0.16). So, participants’ diagnostic ratios did distinguish stereotype from non-stereotype traits overall.
Figure 5. Diagnostic ratios across all social groups in experiment 3.
Exploratory predictions & analyses
As in Experiment 2, here we explored individual difference measures, namely, motivation to control prejudiced reactions (MCPR), political orientation, and cognitive ability (using Raven’s 2). Again, we related these measures to participants’ responses by exploring how their responses and rJC correlations related to each individual difference measure. First, we computed DRdiff by averaging DRs for each participant and subtracting non-stereotypic trait DRs from stereotypic trait DRs. We then correlated DRdiff with the individual difference measures for the overall sample and subsetting responses for Black category only. The only significant correlation emerged between cognitive ability and DRdiff, suggesting that people with relatively higher cognitive ability were better at diagnosing whether certain traits were more likely associated with a certain category than any other categories, r = 0.12, t(1119) = 3.92, 95% CI = [0.05, 0.17], p < .001.3
Second, we computed the rJC correlation and correlated this value with the individual difference measures. We also broke down this analysis by stereotypic and non-stereotypic traits to explore the relationship by trait type. Again, we analyzed data for the overall sample and for responses to the category Black only. There were small, statistically significant correlations between 1) MCPR and rJC in the overall sample, r = 0.06, t(1097) = 2.06, 95% CI = [0.003, 0.12], p = .04 and 2) political orientation and rJC for non-stereotypic traits, r = −0.10, t(555) = −2.48, 95% CI = [−0.18, −0.02], p = .01.3
In sum, participants with higher motivation to control prejudiced reactions and liberals followed Bayes’ theorem more closely in our task, whereas people with relatively high cognitive ability were able to diagnose the likelihood of certain traits being associated with certain social groups.3 However, these analyses were exploratory and should be interpreted with caution.
General discussion
The current experiments built on foundational work by McCauley and Stitt (Citation1978) in several ways. First, we conducted a replication and extension to determine whether defining stereotypes as diagnostic posterior predictions remains applicable today. Overall, there was general successful replication across three experiments with different samples. Second, we explored the possibility of motivated stereotyping in cases where known stereotypes were not rated as diagnostic of a certain category. Preliminary results did not support the idea that those with relatively higher motivation to control prejudiced reactions were less likely to be Bayesian in their judgments. Third, liberals followed Bayes’ theorem more closely than conservatives in our task. Fourth, those with higher cognitive ability could diagnose the likelihood of certain traits being associated to certain social groups compared to those with lower cognitive ability (who were less able to do so in our task).
Overall, these results suggest people’s predictions about certain social groups possessing certain traits were highly correlated with their calculated Bayesian posteriors. This finding is consistent with theoretical and empirical work within stereotyping literature which claims that stereotype-based predictions can be accurate –– even without explicit knowledge of an individual’s actual behavior (see Reflection-Construction Model in Jussim, Citation1991).Footnote4 Jussim’s model is among the few which allow for the possibility that social reality is constructed from theoretically valid perceptions and expectations. Accurate stereotype-based judgments can help people actively navigate the social world by minimizing threats and maximizing opportunities to meet adaptive goalsFootnote5 (see Affordance Management models; Brown et al., Citation2022; Neuberg et al., Citation2020; Sng et al., Citation2020). Cognitive and evolutionary sciences emphasize adaptive processes which are sensitive to environmental patterns because inaccuracy is maladaptive and can lead to fitness costs (e.g., Clark, Citation2013, Citation2015; Dhami et al., Citation2004; Hogarth, Citation1981; Hohwy, Citation2013; Kaplan & Gangestad, Citation2015; Lejarraga & Hertwig, Citation2021; Little, Citation2017; Marczyk, Citation2017; Pleskac & Hertwig, Citation2014; Sng et al., Citation2020; Tappin & Gadsby, Citation2019; Trivers, Citation2017). Using stereotype-based information or base rates can thus be beneficial, at least when no other information (or only ambiguous individuating information) is available (Jussim, Citation2018; Jussim et al., Citation2018). Future work must empirically test 1) the mechanisms involved in formation and reinforcement of stereotype beliefs and 2) possible inaccuracies and constraints around using Bayesian reasoning to understand stereotype-based judgments in the real world.
Inaccurate societal stereotypes can emerge via arbitrary, minimal differences between social groups or even stem from social roles. For example, gay men will be perceived as relatively more masculine when portrayed in highly masculine roles (e.g., truck-driver) compared to being portrayed in feminine roles or as gay men in general (see Social Role Theory; Banchefsky et al., Citation2016; Eagly & Karau, Citation2002; Eagly & Koenig, Citation2021; Fingerhut & Peplau, Citation2006; Gustafsson Sendén & Sikström, Citation2020; Sy et al., Citation2010). They can emerge without variables like malicious intent, intrinsic group differences, cognitive limitations on the perceiver, or variations in information accessibility among social groups affecting perceivers. For instance, 16- to 25-year-old men are more likely to be charged higher automobile insurance than their female counterparts because they get into more accidents (see Statistical Discrimination Theory; e.g., Abdou, Citation2019; Bai, Fiske, et al., Citation2022; Bai, Griffiths, et al., Citation2022; Butler et al., Citation1988; Phelps, Citation1972; Tajfel, Citation1970; Tajfel et al., Citation1971). Thus, people can make rational decisions in some cases (as in the current Bayesian framework), but the limitations of such applications must be appreciated. Finally, there is little evidence supporting interventions that have attempted to change stereotype beliefs (Cox & Devine, Citation2019; Forscher et al., Citation2019; Paluck et al., Citation2021; but see; Bai et al., Citation2020; Eagly & Koenig, Citation2021; Koenig & Eagly, Citation2014), suggesting that social stereotypes are persistent and difficult to change.
Researchers can compare the current Bayesian framework with other approaches to empirically test whether people can form and use stereotype-based judgments. For example, probability estimates of individually reinforced stereotypes can be modeled using the current Bayesian framework to measure judgments over time (see Social Role Theory; Eagly & Koenig, Citation2021). The contextual multi-armed bandit problem (Bai, Griffiths, et al., Citation2022, Citation2020; W. R. Thompson, Citation1933) can make estimates about different social groups based on contextual features. Context is not explicitly quantified within the Bayesian framework but is important to identify cases like forbidden base rates where people may be cognitively able but unwilling to apply Bayesian reasoning due to moral, religious, political, or ethical considerations (Jussim et al., Citation2018; Tetlock et al., Citation2000). Unique constraints exist in examining judgments about social groups, especially where using base rates with negative stereotype content (e.g., race) might be considered unacceptable.
More broadly, even studying the topic of stereotype accuracy has been “forbidden” within the field, as researchers conformed to norms that stereotypes were biased and inaccurate (see Jussim, Citation2012; Mackie, Citation1973). In fact, most past work fails to explicitly acknowledge the existence of any evidence supporting stereotype accuracy (see Jussim et al., Citation2015, Citation2018), despite there being considerable evidence for the same (e.g., Chan et al., Citation2012; Jussim, Citation2018; Jussim et al., Citation2015; Löckenhoff et al., Citation2014). Researchers may have had to trade-off between exploring controversial information about social groups and exploiting preexisting knowledge due to social and professional pressure (e.g., stereotypes are inaccurate beliefs; J. D. Cohen et al., Citation2007; Sutton & Barto, Citation2018). So, another important, real-world consideration relates to research pursuits of (accurate) stereotype-based judgments being constrained by professional norms and/or social stigma (Inbar & Inzlicht, Citation2018; Jussim, Citation2013; Jussim et al., Citation2018; Stevens et al., Citation2017).
Exploratory variables
Regarding the exploratory variables of motivation to control prejudiced reactions, political orientation, and cognitive ability, we found some initial evidence suggesting that these variables may influence how people make judgments related to stereotype information. We recommend caution in interpreting these results as these analyses were exploratory. Regarding cognitive ability, Lick et al. (Citation2018) provided evidence that superior pattern detectors (i.e., those with higher cognitive ability) are better at detecting, learning, and using stereotypes; we found initial evidence consistent with these findings. Although motivation to control prejudiced reactions specifically was not related in the expected way to Bayesian judgments in the current work, motivation to control prejudiced reactions and its correlates are often considered informative for stereotype use. For example, one correlate is political orientation and researchers have demonstrated a large difference in the stereotypes conservatives and liberals hold (Nosek et al., Citation2007, Citation2007b; Olcaysoy Okten & Saribay, Citation2019). Political orientation might also be important from the historical affordances standpoint, which can impact which beliefs are propagated within a society (Bai, Fiske, et al., Citation2022; Bai, Griffiths, et al., Citation2022; Hardy et al., Citation2020; Hawkins et al., Citation2019; B. Thompson & Griffiths, Citation2021). Future work can explore how social interactions at the individual- or societal-level are amplified within entire populations (e.g., see Bai, Fiske, et al., Citation2022; Bai, Griffiths, et al., Citation2022).
Within the current work, it may be the case that the MCPR scale, which was created in 1997, no longer assesses how such motivations operate over two decades later. Note that data collection began in October 2020 and ended around March 2022. This coincides with the COVID-19 pandemic, prevalence of news coverage about George Floyd’s murder, and accompanying protests mobilized by the Black Lives Matter movement. These socio-political events may have impacted how people think about race in particular and different social groups in general (e.g., availability heuristics; Tversky & Kahneman, Citation1973). Still, the present results remain consistent across all three experiments and replicate past work (McCauley & Stitt, Citation1978), suggesting the generalizability of these effects.
Overall, these results suggest that people’s direct posterior predictions about certain social groups possessing certain traits were highly correlated with their calculated posterior predictions as per Bayes’ rule. However, the intervals around some correlations had relatively larger uncertainty than others.4 For instance, the confidence intervals around the categories lawyer, lesbian, and gay were generally wider than any other category across all experiments (see ). Follow-up analyses looking at the frequency of responses for questions corresponding to each component of Bayes’ theorem revealed one particular question (i.e., p(Group) in Equation 2) for which responses were highly positively skewed (see Figures S1, S2, and S3 in the Supplementary Materials). Specifically, people’s predictions for what percent of all the world’s people are lawyers (or gay, or lesbian) were clustered between 1% and 20%. In comparison, responses to the same question for categories with narrower confidence intervals (e.g., female, Black) were more normally distributed (see Figures S1, S2, and S3 in the Supplementary Materials). Participants’ priors were more uncertain when estimating the population of some categories compared to others because, for instance, people may have a stronger intuitive understanding of the number of females in the world compared to the number of lawyers. For “lawyer,” it may also be the case that people are not in the habit of thinking about demographic estimates of professional groups in terms of a world percentage. Indeed, web searches for professional demographics typically result in country-specific breakdowns, but a comparison of the percentage of lawyers reported in our study to the true percentage in the United States (0.40%; American Bar Association, Citation2022) still indicates an overestimation about this category.
Another explanation might be that people’s estimates of minority categories might be biased and overestimated (Kardosh et al., Citation2022; Khaw, Kranton, et al., Citation2021; Khaw, Stevens, et al., Citation2021; Landy et al., Citation2018). A recent Gallup poll found that U.S.A. residents estimate over 20% of the population identifies as LGBTQ+ but the true proportion seems closer to around 3.5%, among which roughly 1.7% identify as lesbian or gay (Gates, Citation2011; Gates & Newport, Citation2012; Newport, Citation2015). Such findings in the demographic estimation literature generally invoke explanations centered on topic-specific biases (e.g., xenophobia or homophobia), although such views have been criticized by some, e.g., see Martinez et al., Citation2008). Other explanations for inflated beliefs about minority population size are related to media over-representation, increased social contact, or more domain-general processes related to the (over)estimation of demographic proportions (Alba et al., Citation2005; Herda, Citation2013; Landy et al., Citation2018; Wong, Citation2007).
As discussed above, correlations for some categories had wider intervals (e.g., lawyer, lesbian, gay); however, DRs for those categories had values above 1.0, suggesting that stereotypic traits in our study were also considered stereotypic by participants. Recall that calculating the diagnostic ratio involved dividing the judged posterior by the prior predictions (see Equation 5). The value p(Group) in Equation 2 was not involved in the DR calculation which may help explain why DRs for categories with larger uncertainty in the rJC correlations still had DRs >1.0. That is, the DR separation between stereotypic and non-stereotypic traits can be large even if judged posteriors are uncorrelated to calculated posteriors or if there is large uncertainty surrounding the rJC correlation for a specific group. As McCauley and Stitt (Citation1978) suggested, future research can explore diagnostic ratios as a novel stereotype measure to test which traits are considered stereotypic of which social categories. Next steps can also involve a greater number of social categories and/or traits to test whether judgments are made in accordance with Bayes’ Theorem and which traits are considered diagnostic of which social categories.
Bayesian impression formation
While the social cognitive literature has long debated the type of information people use when forming impressions of others (e.g., Benjamin et al., Citation2019; Fiske et al., Citation2018; Hilton & Fein, Citation1989; Hugenberg et al., Citation2010; Kunda & Sherman-Williams, Citation1993; Locksley et al., Citation1982; Pennycook & Thompson, Citation2016; Tversky & Kahneman, Citation1981), one line of research has demonstrated ways in which people combine categorical (stereotype) information with individuating information in a manner consistent with Bayes’ theorem (McCauley, Citation1994; Rasinski et al., Citation1985). For example, when given both, social category information and trait-related behavioral information, people formed impressions as per the Bayesian normative criterion rather than neglecting base rates (Rasinski et al., Citation1985).4
In general, impression formation theories (e.g., Fiske et al., Citation2018) describe a dynamic process in which people update their impressions of others based on new information. Adopting a Bayesian perspective to inform impression formation theory appears to be a promising future direction to measure people’s prior beliefs and set a normative criterion against which to compare and identify systematic biases in their judgments.
Conclusion
We explored whether stereotypes can be understood as conditional probabilities that distinguish social groups as per Bayesian posterior prediction. Across three experiments we found that this was indeed the case. We also provided support for Diagnostic Ratios as a novel stereotype measure. Adopting a Bayesian perspective may prove fruitful in developing more explicit connections between the stereotyping literature and the cognitive judgment and impression formation literature.
Open scholarship


This article has earned the Center for Open Science badges for Open Data, Open Materials and Preregistered. The data and materials are openly accessible at DOI: DOI 10.17605/OSF.IO/ZDGXN or https://osf.io/zdgxn/ (this link has all 3 studies linked as components). Individual DOIs as follows: DOI 10.17605/OSF.IO/8KBF6 (Study 1), DOI 10.17605/OSF.IO/ZDGXN (Study 2), DOI 10.17605/OSF.IO/YCA5X (Study 3). https://doi.org/10.17605/OSF.IO/85MTZ (Study 1), https://doi.org/10.17605/OSF.IO/26V3M (Study 2), Study 3 was not preregistered.
Supplemental Material
Download MS Word (2.2 MB)Disclosure statement
No potential conflict of interest was reported by the author(s).
Supplementary material
Supplemental data for this article can be accessed online at https://doi.org/10.1080/00224545.2024.2368017.
Additional information
Funding
Notes on contributors
Prachi Solanki
Prachi Solanki recently earned a PhD in Social Psychology from Michigan State University. Broadly, she is interested in judgement, decision-making, and social cognition research.
Joseph Cesario
Joseph Cesario is professor of psychology at Michigan State University. His social cognition research includes stereotyping, decision-making, and automaticity.
Notes
1. Although many stereotype definitions have included the claim that stereotypic traits are distinctive, the general Bayesian framework plays little to no role in most models (Stangor, Citation2016).
2. Also see Tables S1 through S6 in the Supplementary Online Materials for 1) the rJC correlation with restricted range on the calculated posterior values (between 0 to 200) and 2) correlations between all components of Bayes’ theorem in Equation 1. These correlations were computed in all three experiments to assess their potential influence on the rJC correlations reported in the main paper.
3. We report full details of these analyses in the Appendix.
4. Although there is much debate in the literature about whether “accurate” stereotype-based judgments are merely biased self-fulfilling prophecies, Jussim (Citation2012, Citation2017) argue that self-fulfilling prophecy effects are small and disappear over time. On the other hand, Madon et al. (Citation2018) provide empirical support for self-fulfilling prophecy effects to accumulate across perceivers, and Villiger (Citation2023) proposes a middle path wherein stereotype accuracy and self-fulfilling prophecies can be considered two sides of the same coin with both sides helping to reduce errors in social judgments. For an exploratory analysis on the degree of judgment accuracy within our task, see Jussim’s discrepancy score section in the Supplementary Online Materials.
5. Note that the current work is focused on stereotype use which does not concern itself with whether people’s stereotype beliefs are accurate or not. Stereotype content work discusses accuracy vs. inaccuracy in the people’s stereotype beliefs (for more on stereotype content see Jussim et al., Citation2015).
References
- Abdou, D. S. (2019). Using big data to discriminate charged price in the car insurance industry: Evidence from united states. Proceedings of Business and Economic Studies, 2(6). https://doi.org/10.26689/pbes.v2i6.696
- Adorno, T. W., Frenkei-Brunswik, E., Levinson, D. J., & Sanford, R. N. (1950). The authoritarian personality. Harper and Row.
- Alba, R., Rumbaut, R. G., & Marotz, K. (2005). A distorted nation: Perceptions of racial/ethnic group sizes and attitudes toward immigrants and other minorities. Social Forces, 84(2), 901–919. https://doi.org/10.1353/sof.2006.0002
- Allport, G. (1958). The nature of prejudice. Doubleday and Company.
- American Bar Association. (2022). ABA lawyers survey. ABA news archives. https://www.americanbar.org/news/abanews/aba-news-archives/2022/06/aba-lawyers-survey/
- Bai, X., Fiske, S. T., & Griffiths, T. L. (2022). Globally inaccurate stereotypes can result from locally adaptive exploration. Psychological Science, 33(5), 671–684. https://doi.org/10.1177/09567976211045929
- Bai, X., Griffiths, T., & Fiske, S. (2022). Explore-exploit tradeoffs generate cascading societal stereotypes. PsyArxiv Preprints. https://doi.org/10.31234/osf.io/zw3s8
- Bai, X., Ramos, M. R., & Fiske, S. T. (2020). As diversity increases, people paradoxically perceive social groups as more similar. Proceedings of the National Academy of Sciences, 117(23), 12741–12749. https://doi.org/10.1073/pnas.2000333117
- Banchefsky, S., Westfall, J., Park, B., & Judd, C. M. (2016). But you don’t look like a scientist!: Women scientists with feminine appearance are deemed less likely to be scientists. Sex Roles, 75(3–4), 95–109. https://doi.org/10.1007/s11199-016-0586-1
- Benjamin, D., Bodoh-Creed, A., & Rabin, M. (2019). Base-rate neglect: Foundations and implications. Base-Rate Neglect: Foundations and Implications, 1–62. https://www.semanticscholar.org/paper/Base-Rate-Neglect-%3A-Foundations-and-Implications-%E2%88%97-Benjamin-Bodoh-Creed/09f60f9d08b36242c4278ba97635b8ffa3000b28
- Brigham, J. C. (1971). Ethnic stereotypes. Psychological Bulletin, 76(1), 15–38. https://doi.org/10.1037/h0031446
- Brown, M., Boykin, K., & Sacco, D. F. (2022). Functional inferences of mating orientations through body fat and sex-typical body features. Journal of Social and Personal Relationships, 39(7), 2228–2238. https://doi.org/10.1177/02654075221076455
- Butler, P., Butler, T., & Williams, L. L. (1988). Sex-divided mileage, accident, and insurance cost data show that auto insurers overcharge most women.
- Chan, W., McCrae, R. R., De Fruyt, F., Jussim, L., Löckenhoff, C. E., De Bolle, M., Costa, P. T., Sutin, A. R., Realo, A., Allik, J., Nakazato, K., Shimonaka, Y., Hřebíčková, M., Graf, S., Yik, M., Brunner-Sciarra, M., de Figueroa, N. L., Schmidt, V. & Pramila, V. S. (2012). Stereotypes of age differences in personality traits: Universal and accurate? Journal of Personality & Social Psychology, 103(6), 1050–1066. https://doi.org/10.1037/a0029712
- Clark, A. (2013). Whatever next? predictive brains, situated agents, and the future of cognitive science. The Behavioral and Brain Sciences, 36(3), 181–204. https://doi.org/10.1017/S0140525X12000477
- Clark, A. (2015). Surfing uncertainty: Prediction, action, and the embodied mind. Oxford University Press.
- Cohen, J. D., McClure, S. M., & Yu, A. J. (2007). Should I stay or should I go? How the human brain manages the trade-off between exploitation and exploration. Philosophical Transactions of the Royal Society B: Biological Sciences, 362(1481), 933–942. https://doi.org/10.1098/rstb.2007.2098
- Cox, W. T., & Devine, P. G. (2019). The prejudice habit-breaking intervention: An empowerment-based confrontation approach. In R. K. Mallett & M. J. Monteith (Eds.), Confronting prejudice and discrimination (pp. 249–274). Elsevier.
- Devine, P. G., & Elliot, A. J. (1995). Are racial stereotypes really fading? the Princeton trilogy revisited. Personality and Social Psychology Bulletin, 21(11), 1139–1150. https://doi.org/10.1177/01461672952111002
- Dhami, M. K., Hertwig, R., & Hoffrage, U. (2004). The role of representative design in an ecological approach to cognition. Psychological Bulletin, 130(6), 959–988. https://doi.org/10.1037/0033-2909.130.6.959
- Dunton, B., & Fazio, R. (1997). An individual difference measure of motivation to control prejudiced reactions. Personality and Social Psychology Bulletin, 23(3), 316–326. https://doi.org/10.1177/0146167297233009
- Eagly, A. H., & Karau, S. J. (2002). Role congruity theory of prejudice toward female leaders. Psychological Review, 109(3), 573–598. https://doi.org/10.1037/0033-295X.109.3.573
- Eagly, A. H., & Koenig, A. M. (2021). The vicious cycle linking stereotypes and social roles. Current Directions in Psychological Science, 30(4), 343–350. https://doi.org/10.1177/09637214211013775
- Fingerhut, A. W., & Peplau, L. A. (2006). The impact of social roles on stereotypes of gay men. Sex roles, 55(3–4), 273–278. https://doi.org/10.1007/s11199-006-9080-5
- Fiske, S. T., Lin, M., & Neuberg, S. L. (2018). The continuum model: Ten years later. In Social Cognition (1st ed., pp. 41–75). Routledge.
- Forscher, P. S., Lai, C. K., Axt, J. R., Ebersole, C. R., Herman, M., Devine, P. G., & Nosek, B. A. (2019). A meta-analysis of procedures to change implicit measures. Journal of Personality and Social Psychology, 117(3), 522–559. https://doi.org/10.1037/pspa0000160
- Gates, G. J. (2011). How many people are lesbian, gay, bisexual, and transgender? JSTOR.
- Gates, G. J., & Newport, F. (2012). Special report: 3.4% of us adults identify as LGBT. Gallup.
- Gonsalkorale, K., Sherman, J. W., & Klauer, K. C. (2009). Aging and prejudice: Diminished regulation of automatic race bias among older adults. Journal of Experimental Social Psychology, 45(2), 410–414. https://doi.org/10.1016/j.jesp.2008.11.004
- Gustafsson Sendén, M., & Sikström, S. (2020). Social psychology: Evaluations of social groups with statistical semantics. In S. Sikström & D. Garcia (Eds.), Statistical Semantics: Methods and Applications (pp. 209–218). Springer.
- Hardy, M., Thompson, B., Krafft, P. M., & Griffiths, T. (2020). Population-level amplification of perceptual bias. Cogsci proceedings.
- Hawkins, R. X., Goodman, N. D., & Goldstone, R. L. (2019). The emergence of social norms and conventions. Trends in Cognitive Sciences, 23(2), 158–169. https://doi.org/10.1016/j.tics.2018.11.003
- Herda, D. (2013). Too many immigrants? Examining alternative forms of immigrant population innumeracy. Sociological Perspectives, 56(2), 213–240. https://doi.org/10.1525/sop.2013.56.2.213
- Hilton, J. L., & Fein, S. (1989). The role of typical diagnosticity in stereotype-based judgments. Journal of Personality and Social Psychology, 57(2), 201–211. https://doi.org/10.1037/0022-3514.57.2.201
- Hogarth, R. M. (1981). Beyond discrete biases: Functional and dysfunctional aspects of judgmental heuristics. Psychological Bulletin, 90(2), 197–217. https://doi.org/10.1037/0033-2909.90.2.197
- Hohwy, J. (2013). The predictive mind. OUP Oxford.
- Hugenberg, K., Young, S. G., Bernstein, M. J., & Sacco, D. F. (2010). The categorization-individuation model: An integrative account of the other-race recognition deficit. Psychological Review, 117(4), 1168–1187. https://doi.org/10.1037/a0020463
- Inbar, Y., & Inzlicht, M. (2018). Wtf is the idw. Podcast. https://www.fourbeers.com/3
- Jackson, L. A., Lewandowski, D. A., Ingram, J. M., & Hodge, C. N. (1997). Group stereotypes: Content, gender specificity, and affect associated with typical group members. Journal of Social Behavior and Personality, 12(2), 381–396.
- Jost, J. T. (2006). The end of the end of ideology. American Psychologist, 61(7), 651–670. https://doi.org/10.1037/0003-066X.61.7.651
- Jost, J. T., & Hamilton, D. L. (2005). Stereotypes in our culture. In J. Dovidio, L. A. Glick, & P. Rudman (Eds.), On the nature of prejudice: Fifty years after allport (pp. 208–224). Blackwell Publishing.
- Jussim, L. (1991). Social perception and social reality: A reflection-construction model. Psychological Review, 98(1), 54–73. https://doi.org/10.1037/0033-295X.98.1.54
- Jussim, L. (2012). Social perception and social reality: Why accuracy dominates bias and self-fulfilling prophecy. OUP USA.
- Jussim, L. (2013). Liberal bias in social psychology: Personal experience iii. Psychology Today.
- Jussim, L. (2017). Précis of social perception and social reality: Why accuracy dominates bias and self-fulfilling prophecy. Behavioral and Brain Sciences, 40, e1. https://doi.org/10.1017/S0140525X1500062X
- Jussim, L. (2018). The accuracy of demographic stereotypes. PsyArxiv Preprints. https://doi.org/10.31234/osf.io/beaq3
- Jussim, L., Crawford, J. T., & Rubinstein, R. S. (2015). Stereotype (in)accuracy in perceptions of groups and individuals. Current Directions in Psychological Science, 24(6), 490–497. https://doi.org/10.1177/0963721415605257
- Jussim, L., Stevens, S. T., & Honeycutt, N. (2018). Unasked questions about stereotype accuracy. Archives of Scientific Psychology, 6(1), 214–229. https://doi.org/10.1037/arc0000055
- Kaplan, H. S., & Gangestad, S. W. (2015). Life history theory and evolutionary psychology. In D. M. Buss (Ed.), The Handbook of Evolutionary Psychology (pp. 68–95), Wiley. https://doi.org/10.1002/9780470939376
- Kardosh, R., Sklar, A. Y., Goldstein, A., Pertzov, Y., & Hassin, R. R. (2022). Minority salience and the overestimation of individuals from minority groups in perception and memory. Proceedings of the National Academy of Sciences, 119(12), e2116884119. https://doi.org/10.1073/pnas.2116884119
- Katz, D., & Braly, K. W. (1935). Racial prejudice and racial stereotypes. The Journal of Abnormal and Social Psychology, 30(2), 175–193. https://doi.org/10.1037/h0059800
- Khaw, M. W., Kranton, R., & Huettel, S. (2021). Oversampling of minority categories drives misperceptions of group compositions. Cognition, 214, 104756. https://doi.org/10.1016/j.cognition.2021.104756
- Khaw, M. W., Stevens, L., Woodford, M., & van den Berg, R. (2021). Individual differences in the perception of probability. PloS Computational Biology, 17(4), e1008871. https://doi.org/10.1371/journal.pcbi.1008871
- Klineberg, O. (1951). The scientific study of national stereotypes. International Social Science Bulletin, 3(3), 505–515. https://unesdoc.unesco.org/ark:/48223/pf0000262339
- Koenig, A. M., & Eagly, A. H. (2014). Evidence for the social role theory of stereotype content: Observations of groups’ roles shape stereotypes. Journal of Personality and Social Psychology, 107(3), 371–392. https://doi.org/10.1037/a0037215
- Kunda, Z., & Sherman-Williams, B. (1993). Stereotypes and the construal of individuating information. Personality and Social Psychology Bulletin, 19(1), 90–99. https://doi.org/10.1177/0146167293191010
- Kundra, Z., & Sinclair, L. (1999). Motivated reasoning with stereotypes: Activation, application, and inhibition. Psychological Inquiry, 10(1), 12–22. https://doi.org/10.1207/s15327965pli1001_2
- Landy, D., Guay, B., & Marghetis, T. (2018). Bias and ignorance in demographic perception. Psychonomic Bulletin & Review, 2(5), 1606–1618. https://doi.org/10.3758/s13423-017-1360-2
- Lejarraga, T., & Hertwig, R. (2021). How experimental methods shaped views on human competence and rationality. Psychological Bulletin, 147(6), 535–564. https://doi.org/10.1037/bul0000324
- Lick, D. J., Alter, A. L., & Freeman, J. B. (2018). Superior pattern detectors efficiently learn, activate, apply, and update social stereotypes. Journal of Experimental Psychology: General, 147(2), 209–227. https://doi.org/10.1037/xge0000349
- Lippman, W. (1922). Public opinion. Harcourt, Brace & Co.
- Little, A. C. (2017). An evolutionary approach to accuracy in social perception. Behavioral and Brain Sciences, 40, e8. https://doi.org/10.1017/S0140525X15002356
- Löckenhoff, C. E., Chan, W., McCrae, R. R., De Fruyt, F., Jussim, L., De Bolle, M. (2014). Gender stereotypes of personality: Universal and accurate? Journal of Cross-Cultural Psychology, 45(5), 675–694. https://doi.org/10.1177/0022022113520075
- Locksley, A., Hepburn, C., & Ortiz, V. (1982). Social stereotypes and judgments of individuals: An instance of the base-rate fallacy. Journal of Experimental Social Psychology, 18(1), 23–42. https://doi.org/10.1016/0022-1031(82)90079-8
- Mackie, M. (1973). Arriving at “truth” by definition: The case of stereotype inaccuracy. Social Problems, 20(4), 431–447. https://doi.org/10.2307/799706
- Madon, S., Jussim, L., Guyll, M., Nofziger, H., Salib, E. R., Willard, J., & Scherr, K. C. (2018). The accumulation of stereotype-based self-fulfilling prophecies. Journal of Personality and Social Psychology, 115(5), 825–844. https://doi.org/10.1037/pspi0000142
- Marczyk, J. (2017). Why would we expect the mind to work that way? The fitness costs to inaccurate beliefs. The Behavioral and Brain Sciences, 40. https://doi.org/10.1017/S0140525X1500237X
- Martinez, M. D., Wald, K. D., & Craig, S. C. (2008). Homophobic innumeracy? Estimating the size of the gay and lesbian population. Public Opinion Quarterly, 72(4), 753–767. https://doi.org/10.1093/poq/nfn049
- McCauley, C. R. (1994). Stereotypes as base rate predictions: Commentary on Koehler on base-rate. Psycoloquy, 5, 05. https://www.cogsci.ecs.soton.ac.uk/cgi/psyc/newpsy?5.05
- McCauley, C. R., & Stitt, C. L. (1978). An individual and quantitative measure of stereotypes. Journal of Personality and Social Psychology, 36(9), 929–940. https://doi.org/10.1037/0022-3514.36.9.929
- McCauley, C. R., Stitt, C. L., & Segal, M. (1980). Stereotyping: From prejudice to prediction. Psychological Bulletin, 87(1), 195–208. https://doi.org/10.1037/0033-2909.87.1.195
- Mullen, B., & Johnson, C. (1990). Distinctiveness-based illusory correlations and stereotyping: A meta-analytic integration. British Journal of Social Psychology, 29(1), 11–28. https://doi.org/10.1111/j.2044-8309.1990.tb00883.x
- Neuberg, S. L., Williams, K. E., Sng, O., Pick, C. M., Neel, R., Krems, J. A., & Pirlott, A. G. (2020). Toward capturing the functional and nuanced nature of social stereotypes: An affordance management approach. In B. Gawronski (Ed.), Advances in experimental social psychology (Vol. 62, pp. 245–304). Elsevier.
- Newport, F. (2015, May 21). Americans greatly overestimate percent gay, lesbian in us. Gallup News. https://news.gallup.com/poll/259571/americans-greatly-overestimate-gay-population.aspx#:~:text=WASHINGTON%2C%20D.C.%20%2D%2D%20U.S.%20adults,2011%20and%2023.2%25%20in%202015
- Nosek, B. A., Smyth, F. L., Hansen, J. J., Devos, T., Lindner, N. M., Ranganath, K. A. (2007). Pervasiveness and correlates of implicit attitudes and stereotypes. European Review of Social Psychology, 18(1), 36–88. https://doi.org/10.1080/10463280701489053
- Olcaysoy Okten, I., & Saribay, S. A. (2019). Stereotype activation and self-regulation by conservatives and liberals in political encounters. The Journal of Social Psychology, 159(1), 46–60. https://doi.org/10.1080/00224545.2018.1447436
- Paluck, E. L., Porat, R., Clark, C. S., & Green, D. P. (2021). Prejudice reduction: Progress and challenges. Annual Review of Psychology, 7(1), 533–560. https://doi.org/10.1146/annurev-psych-071620-030619
- Pennycook, G., & Thompson, V. A. (2016). Base-rate neglect. In R. F. Pohl (Ed.), Cognitive illusions (3rd ed., pp. 54–71). Psychology Press.
- Phelps, E. S. (1972). The statistical theory of racism and sexism. The American Economic Review, 62(4), 659–661.
- Pleskac, T. J., & Hertwig, R. (2014). Ecologically rational choice and the structure of the environment. Journal of Experimental Psychology: General, 143(5), 2000–2019. https://doi.org/10.1037/xge0000013
- Rasinski, K. A., Crocker, J., & Hastie, R. (1985). Another look at sex stereotypes and social judgments: An analysis of the social perceiver’s use of subjective probabilities. Journal of Personality and Social Psychology, 49(2), 317–326. https://doi.org/10.1037/0022-3514.49.2.317
- Raven, J. (2000). The raven’s progressive matrices: Change and stability over culture and time. Cognitive Psychology, 41(1), 1–48. https://doi.org/10.1006/cogp.1999.0735
- Raven, J. (2003). Raven progressive matrices. In R. S. McCallum (Ed.), Handbook of nonverbal assessment (pp. 223–237). Kluwer Academic/Plenum Publishers.
- Secord, P. F. (1959). Stereotyping and favorableness in the perception of negro faces. Journal of Abnormal and Social Psychology, 5(3), 309–314. https://doi.org/10.1037/h0042001
- Sibley, C. G., Osborne, D., & Duckitt, J. (2012). Personality and political orientation: Meta-analysis and test of a threat-constraint model. Journal of Research in Personality, 46(6), 664–677. https://doi.org/10.1016/j.jrp.2012.08.002
- Sidanius, J., Levin, S., Van Laar, C., & Sears, D. O. (2008). The diversity challenge: Social identity and intergroup relations on the college campus. Russell Sage Foundation.
- Sinclair, L., & Kunda, Z. (2000). Motivated stereotyping of women: She’s fine if she praised me but incompetent if she criticized me. Personality and Social Psychology Bulletin, 26(11), 1329–1342. https://doi.org/10.1177/0146167200263002
- Sng, O., Williams, K. E., & Neuberg, S. L. (2020). Sex-age stereotyping: Social perceivers as lay adaptationists. Evolution and Human Behavior, 41(2), 136–149. https://doi.org/10.1016/j.evolhumbehav.2019.12.001
- Stangor, C. (2016). The study of stereotyping, prejudice, and discrimination within social psychology: A quick history of theory and research. In T. Nelson (Ed.), Handbook of prejudice, stereotyping, and discrimination (pp. 3–27). Psychology Press.
- Stevens, S. T., Jussim, L., Anglin, S. M., Contrada, R., Welch, C. A., Labrecque, J. S. (2017). Political exclusion and discrimination in social psychology: Lived experiences and solutions. In Politics of social psychology (pp. 210–244). Psychology Press.
- Sutton, R. S., & Barto, A. G. (2018). Reinforcement learning: An introduction. MIT press.
- Sy, T., Shore, L. M., Strauss, J., Shore, T. H., Tram, S., Whiteley, P., & Ikeda-Muromachi, K. (2010). Leadership perceptions as a function of race–occupation fit: The case of Asian Americans. Journal of Applied Psychology, 95(5), 902–919. https://doi.org/10.1037/a0019501
- Tajfel, H. (1970). Experiments in intergroup discrimination. Scientific American, 223(5), 96–103. https://doi.org/10.1038/scientificamerican1170-96
- Tajfel, H., Billig, M. G., Bundy, R. P., & Flament, C. (1971). Social categorization and intergroup behaviour. European Journal of Social Psychology, 1(2), 149–178. https://doi.org/10.1002/ejsp.2420010202
- Tappin, B. M., & Gadsby, S. (2019). Biased belief in the Bayesian brain: A deeper look at the evidence. Consciousness and Cognition, 68, 107–114. https://doi.org/10.1016/j.concog.2019.01.006
- Tetlock, P. E., Kristel, O. V., Elson, S. B., Green, M. C., & Lerner, J. S. (2000). The psychology of the unthinkable: Taboo trade-offs, forbidden base rates, and heretical counterfactuals. Journal of Personality and Social Psychology, 78(5), 853–870. https://doi.org/10.1037/0022-3514.78.5.853
- Thompson, B., & Griffiths, T. L. (2021). Human biases limit cumulative innovation. Proceedings of the Royal Society B, 288(1946), 20202752. https://doi.org/10.1098/rspb.2020.2752
- Thompson, W. R. (1933). On the likelihood that one unknown probability exceeds another in view of the evidence of two samples. Biometrika, 25(3–4), 285–294. https://doi.org/10.1093/biomet/25.3-4.285
- Trivers, R. L. (2017). Parental investment and sexual selection. In B. Campbell (Ed.), Sexual selection and the descent of man (pp. 136–179). Routledge.
- Tversky, A., & Kahneman, D. (1973). Availability: A heuristic for judging frequency and probability. Cognitive Psychology, 5(2), 207–232. https://doi.org/10.1016/0010-0285(73)90033-9
- Tversky, A., & Kahneman, D. (1981). Evidential impact of base rates (Tech. Rep.). Stanford University CA Dept of Psychology.
- Villiger, D. (2023). Stereotypes and self-fulfilling prophecies in the bayesian brain. Inquiry, 1–25. https://doi.org/10.1080/0020174X.2023.2166983
- Vinacke, W. E. (1949). Stereotyping among national-racial groups in Hawaii: A study in ethnocentrism. The Journal of Social Psychology, 30(2), 265–291. https://doi.org/10.1080/00224545.1949.9712341
- Von Hippel, W., Silver, L. A., & Lynch, M. E. (2000). Stereotyping against your will: The role of inhibitory ability in stereotyping and prejudice among the elderly. Personality and Social Psychology Bulletin, 26(5), 523–532. https://doi.org/10.1177/0146167200267001
- Walker, K. F. (1958). A study of occupational stereotypes. Journal of Applied Psychology, 42(2), 122–124. https://doi.org/10.1037/h0045472
- Wong, C. J. (2007). “little” and “big” pictures in our heads: Race, local context, and innumeracy about racial groups in the United States. Public Opinion Quarterly, 71(3), 392–412. https://doi.org/10.1093/poq/nfm023
Appendix
Table A1 Social categories and their corresponding traits used in Experiment 1.
Table A2 Social categories and their corresponding traits used in Experiments 2 and 3.
Exploratory Analyses Experiment 2
DRdiff Correlations with MCPR and Political Orientation
Overall, for motivation to control prejudiced reactions, there was no significant relationship with DRdiff, indicating those high and low in MCPR were similar in distinguishing stereotypic from non-stereotypic traits, r = -0.02, t(698) = -0.43, 95% CI = [-0.09, 0.05], p = .66. For political orientation too, we found no significant correlation between political orientation and DRs, indicating conservative and liberal participants were no more likely to distinguish stereotypic from non-stereotypic traits, r = 0.04, t(698) = 1.04, 95% CI = [-0.03, 0.11], p = .29.
Looking only at responses for the category Black, there was no significant relationship between MCPR and DRdiff, indicating those high and low in MCPR were not different in distinguishing stereotypic from non-stereotypic traits, r = 0.05, t(89) = 0.49, 95% CI = [-0.15, 0.25], p = .62.
RJC Correlations with MCPR and Political Orientation
Regarding motivation to control prejudiced reactions, overall, we found no significant correlation between MCPR and rJC, r = 0.02, t(687) = 0.52, 95% CI = [-0.05, 0.09], p = .67. This indicated that participants with relatively higher or lower MCPR made judgments similarly in our task. When broken down by trait type too, there were no significant findings: for stereotypic traits, r = -0.06, t(309) = -1.07, 95% CI = [-0.17, 0.05], p = .28 and for non-stereotypic traits, r = 0.07, t(376) = 1.40, 95% CI = [-0.02, 0.17], p = .16. For political orientation, again, we found no overall correlation between political orientation and rJC, r = 0.01, t(687) = 0.37, 95% CI = [-0.06, 0.08], p = .71. That is, conservatives and liberals within our sample were no different at making judgments. This remained true even when broken down by trait type: stereotypic traits, rJC r = 0.05, t(309) = 0.92, 95% CI = [-0.05, 0.16], p = .35 and non-stereotypic traits rJC r = -0.02, t(376) = -0.34, 95% CI = [-0.11, 0.08], p = .72.
For the Black category only, there was no significant correlation between MCPR and rJC, r = 0.04, t(89) = 0.41, 95% CI = [-0.16, 0.24], p = .68. When broken down by trait type too, there were no significant findings: for stereotypic traits, r = -0.22, t(49) = -1.54, 95% CI = [-0.46, 0.06], p = .13 and for non-stereotypic traits, r = 0.21, t(38) = 1.34, 95% CI = [-0.11, 0.49], p = .18. For political orientation for the category Black, we found no overall correlation between political orientation and rJC, r = 0.15, t(89) = 1.41, 95% CI = [-0.06, 0.34], p = .16. That is, conservatives and liberals within our sample were no different at making judgments for this category. This remained true even when broken down by trait type: stereotypic traits, rJC r = 0.09, t(49) = 0.63, 95% CI = [-0.19, 0.35], p = .53 and non-stereotypic traits, rJC r = 0.14, t(38) = 0.93, 95% CI = [-0.16, 0.44], p = .36.
Exploratory Analyses Experiment 3
DRdiff Correlations with MCPR, Political Orientation, and Cognitive Ability
For motivation to control prejudiced reactions, overall, there was no significant relationship with DRdiff, indicating those high and low in MCPR distinguished stereotypic from non-stereotypic traits to a similar degree, r = -0.03, t(1119) = -1.00, 95% CI = [-0.08, 0.02], p = .31. For political orientation, we found no significant correlation between political orientation and DRs, indicating conservative and liberal participants were no more likely to distinguish stereotypic from non-stereotypic traits, r = 0.02, t(1119) = 0.65, 95% CI = [-0.03, 0.07], p = .51.
Looking only at the category Black, there was no significant relationship with DRdiff and MCPR (r = 0.10, t(129) = 1.17, 95% CI = [-0.07, 0.26], p = .24), DRdiff and political orientation (r = 0.15, t(129) = 1.75, 95% CI = [-0.02, 0.31], p = .08), or DRdiff and cognitive ability (r = 0.10, t(129) = 1.11, 95% CI = [-0.08, 0.26], p = .27). This suggests that people’s motivation to control prejudiced reactions, political orientation, and cognitive ability did not impact whether they were better at diagnosing certain traits as more diagnostic of some categories than other categories.
RJC Correlations with MCPR, Political Orientation, and Cognitive Ability
Regarding motivation to control prejudiced reactions, when broken down by trait type, there were no significant findings for stereotypic traits (r = 0.06, t(540) = 1.49, 95% CI = [-0.20, 0.14], p = .16) or non-stereotypic traits (r = 0.06, t(555) = 1.43, 95% CI = [-0.02, 0.14], p = .15). For political orientation, we found no overall correlation between political orientation and rJC (r = -0.06, t(1097) = -1.98, 95% CI = [-0.11, 0.001], p = .05) and no significant correlation between stereotypic traits and rJC, r = -0.01, t(540) = -0.23, 95% CI = [-0.09, 0.07], p = .82. To explore whether cognitive ability had an impact on participants’ judgments, we tested the relationship between participants’ Raven’s 2 scores and rJC. We found that there was no correlation between these two variables, r = 0.04, t(1097) = 1.39, 95% CI = [-0.02, 0.10], p = .16. In other words, there was no difference in judgments between those with high versus low cognitive ability as measured on Raven’s 2. This remained the case even when the data was broken down by trait type (stereotypic traits: r = 0.05, t(540) = 1.11, 95% CI = [-0.03, 0.13], p = .27; non-stereotypic traits: r = 0.04, t(555) = 0.85, 95% CI = [-0.04, 0.11], p = .39).
Looking only at responses to the category Black, there was no significant relationship with rJC and MCPR (r = 0.07, t(129) = 0.80, 95% CI = [-0.10, 0.23], p = .42), rJC and political orientation (r = -0.08, t(129) = -0.86, 95% CI = [-0.24, 0.09], p = .38), or rJC and cognitive ability (r = 0.09, t(129) = 1.06, 95% CI = [-0.07, 0.26], p = .28). There were no significant differences when breaking down each of these variables by trait type (i.e., stereotypic vs. non-stereotypic traits). For MCPR, stereotypic traits: r = -0.04, t(62) = -0.32, 95% CI = [-0.28, 0.21], p = .74; non-stereotypic traits: r = 0.18, t(65) = 1.51, 95% CI = [-0.06, 0.41], p = .14. For political orientation, stereotypic traits: r = -0.004, t(62) = -0.03, 95% CI = [-0.25, 0.24], p = .97; non-stereotypic traits: r = -0.14, t(65) = -1.11, 95% CI = [-0.36, 0.11], p = .27. For Raven’s 2, stereotypic traits: r = -0.004, t(62) = -0.03, 95% CI = [-0.25, 0.24], p = .97; non-stereotypic traits: r = -0.14, t(65) = -1.11, 95% CI = [-0.36, 0.11], p = .27. These findings suggest that people’s motivation to control prejudiced reactions, political orientation, and cognitive ability did not impact people’s judgments in our task.