
Abstract
Variability in temperature and soil moisture influenced the spread and productive potential of maize. A new low-frequency reconstruction of US Southwest summer temperatures from 3000 BC to present shows generally warmer temperatures until the first century AD. From then until AD 1000, temperatures were generally cooler, though a warming trend continuing to present begins ca. AD 400, interrupted by cooling ca. AD 900 and 1400. Proposing a “ENSO Index” for the US Southwest, we argue that El Niño-like conditions dominated much of the second millennium BC and the first millennium AD, depressing summer temperatures relative to northern hemisphere norms but providing favorable winter moisture for maize. La Niña-like conditions (much less favorable to maize) dominated most of the period from 800 BC – AD 100 and AD 1200 to ca. 1900. We connect these low-frequency trends with tendencies in how and where people lived, emphasizing developments in the ancestral Pueblo area.
La variabilidad en la temperatura y la humedad del suelo incluyo la extensión y el potencial productivo del maíz. Una nueva reconstrucción de baja frecuencia de las temperaturas de verano del suroeste de EE.UU. del año 3000 a.C. hasta la presente muestra que las temperaturas eran generalmente más cálidas hasta el primer siglo d.C. Desde esa época hasta el año 1000 d.C. las temperaturas fueron generalmente más frías, aunque una tendencia de calentamiento que continúa hasta presente comenzó alrededor del año 400 d.C., y fue interrumpida por el enfriamiento alrededor del 900 d.C. y el 1400 d.C. Al proponer un “Índice ENOS” para el suroeste de los Estados Unidos, argumentamos que condiciones similares a El Niño dominaron una gran parte del segundo milenio a.C. y del primer milenio d.C. disminuyendo las temperaturas de verano en relación con las normas del hemisferio norte, pero proporcionando una humedad invernal favorable para el maíz. Las condiciones similares a La Niña (mucho menos favorables para el maíz) dominaron la mayor parte del período comprendido entre el 800 a.C. al 100 d.C. del 1200 d.C. hasta aproximadamente 1900. Conectamos estas tendencias de baja frecuencia con las tendencias de cómo y dónde vivía la gente, haciendo hincapié en los desarrollos dentro del área de Pueblo Ancestral.
For thousands of years before the arrival of the Spanish, maize ruled the lives of most southwestern peoples, demanding their labor and ritual attentions, and channeling their settlement and exchange practices. In return it provided a usually plentiful harvest, sufficient to power one of the world’s agricultural (or Neolithic) demographic transitions (Kohler and Reese Citation2014), eventually boosting the fortunes of one of the few societies in prehispanic North America to flirt with state-like scale and organization.
The ancestors of this most important crop grew in the tropical deciduous forests of the Central Balsas River Valley, Mexico at about 17.6°N, where they likely received some 1000–1400 mm of rainfall (Ranere et al. Citation2009) and accumulated some 5000 or more growing degrees days (GDD °C) annually. By comparison, the town of Cortez, Colorado at 37.3°N – near the heart of the central Mesa Verde region, one of the most densely populated regions of the prehispanic Southwest – today receives approximately 300 mm of rainfall-equivalent precipitation annually under 1400–1700 GDD. GDDs are a measure of heat accumulation for the growing season, important to plant development. Maize was first domesticated in an area with high GDD, but eventually adapted to places with fewer GDD (e.g., the upland Southwest), and different maize varieties today are more or less well-suited to grow under varying GDDs. Clearly farmers and maize must have completed substantial adaptation to be so mutually successful in the temperature and precipitation conditions of the prehispanic upland Southwest.
For many decades, southwestern archaeologists have benefited from precipitation, streamflow, and Palmer Drought Severity Index reconstructions based on analysis of tree-ring widths (Cook et al. Citation2004; Dean Citation1988a; Dean and Robinson Citation1978; Van West Citation1994). It is abundantly clear from this work (and from contemporary observation) that precipitation was (and is) an important limiting factor for maize production throughout the US Southwest. Temperature reconstructions have been more difficult though, making it hard to gauge the extent to which past temperature variability was also limiting. A few years ago, Larry Benson et al. (Citation2013) identified problems with all the then-available proxies for temperature in the US Southwest (including both tree rings and pollen), ranging from low correlation with instrumented temperature records (for high-altitude bristlecone pine) to the use of questionable pollen ratios or low temporal resolution (for pollen). Gary Huckleberry (Citation2015:90) has also noted that temperature reconstructions for the Southwest seem problematic and lacking in agreement.
Since then, at least two tree-ring-based temperature reconstructions relevant to the Southwest have appeared. Using tree-ring networks, Kevin Anchukaitis et al. (Citation2017) reconstructed northern hemisphere warm-season temperatures from AD 750–1988 extending south to 40°N, roughly the latitude of Provo, Utah, and Boulder, Colorado – unfortunately excluding most of the Southwest. Darrell Kaufman et al. (Citation2020) compiled temperature proxies from many different kinds of records from all over the world for the Holocene. These can be separated by latitudinal bands and marine vs. terrestrial sources. Though they are not specifically helpful for the US Southwest, we employ their terrestrial composite for 30–60°N for large-scale comparisons in Gillreath-Brown et al. (Citation2024).
The major impetus for this paper, though, is to consider the implications for the farmers of the prehispanic Southwest of a new temperature reconstruction for the US Southwest for the last five thousand years (Gillreath-Brown et al. Citation2024). If over the late Holocene, temperatures in the US Southwest simply reproduced those for North America or for the northern hemisphere after appropriate elevational and latitudinal adjustment, this new reconstruction would be inconsequential. As we will see, however, this is not the case.
A New Summer Temperature Reconstruction for the US Southwest
Partly because tree-ring temperature reconstructions may be somewhat insensitive to low-frequency (l-f) change (Cook et al. Citation1995) and also due to the short reconstructions they generally provide, we turned to the records of pollen deposition developed by palynologists over many decades to generate a reconstruction of summer warmth in the Southwest for the last 5 millennia. Types and frequencies of pollen deposited in a lake or bog change fairly slowly, and with some lag, as climate changes, guaranteeing a l-f signal. Any particular pollen assemblage though will be subject to a number of local factors (Chevalier et al. Citation2020) that may not be relevant to climate. The new reconstruction filters out such local noise by drawing on 29 southwestern United States fossil pollen sites (see Gillreath-Brown et al. Citation2024, Table 1 for site summary information) to reconstruct July temperatures using robust statistical techniques to extract their mutual temperature signal. The result is a record that is not very sensitive to the sorts of annual and decadal variation to which trees mainly respond, but is quite sensitive to climate variability at the scale of many decades and centuries.
This reconstruction employs the modern analog technique (MAT) (Overpeck et al. Citation1985) – well-established in the paleoclimate community (see Chevalier et al. Citation2020 for in-depth review of this and other pollen-based reconstruction techniques). Very briefly, MAT finds the closest possible matches between the pollen types and frequencies for each sample from each core (for which the age is known) and the pollen from some modern samples which developed under known temperature and precipitation conditions. Then, the temperature characteristics (in this case) of the matching modern samples are assigned to the location of the core, for the date of that sample. Repeating this process over numerous samples from a single region (here we draw on almost 2000 samples) provides a relatively precise record of changes in temperature through time for that region.
(inset) shows the area covered by this reconstruction and the temperature “anomalies” it calculates through time. (We will refer to the area in the inset as the southwestern United States or SWUS.) These anomalies are the differences between the July temperature estimates for the past, and the average July temperatures from 1961 to 1990 in this area. Construction of this figure begins with temperature estimates from individual samples (not shown, but see Gillreath-Brown et al. Citation2024: Figure 5, which also displays these data points binned by century in box-and-whisker plots). Further, to account for chronological uncertainty in the age-depth models and the climate network through time, we rebuilt the age-depth models 100 times for each fossil pollen core. The line is based on an unweighted loess smoothing (local polynomial regression fitting) of the individual data points (including data points from the 100 simulations). This reconstruction is somewhat more precise for both time and temperature in the last two millennia, where samples are more numerous, than in the first three millennia. The gray band depicts the standard error around the reconstruction.
Figure 1. Low-frequency July temperature anomaly reconstruction for the southwestern United States as defined in inset (based on Gillreath-Brown et al. Citation2024:Figure 5). The extent of the SWUS inset is approximately: xmin = −112.82, xmax = −105.52, ymin = 32.66, ymax = 38.90. Blue line fitted by loess (local polynomial regression fitting) smoothing (α = 0.15). Negative values on the y-axis indicate temperatures cooler than the 1961–1990 average; the horizontal line at 0 marks the average July temperature from 1961–1990. Negative values on x-axis indicate years BC.
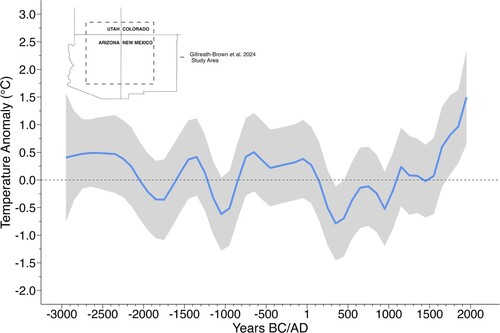
Perhaps the most obvious feature of this reconstruction is that summer temperatures were commonly warmer than or similar to the 1961–1990 period (which we refer to as “modern”) for much of the three millennia prior to AD 1. Important exceptions occur however around 1800 BC and 1000 BC. The first millennium AD was by contrast cooler than modern. The very warm conditions of the post-2000 AD Southwest are a poor guide to summer temperatures for most of the last 5000 years, and especially for the first millennium AD.
In slightly more detail, following a warm third millennium BC, a second millennium BC in which summer temperatures were a mix of cooler and warmer conditions, and warmer first millennium BC, we reconstruct a 500-year period in which summer temperatures in the SWUS generally declined, beginning around 100 BC until reaching the global minimum in this reconstruction around AD 400. After that summer temperatures generally increased until around AD 1500, punctuated by marked cooling in the AD 900s and again (less markedly) in the 1500s. The Little Ice Age (LIA) is expressed in this record as almost three centuries with relatively cooler summers (though similar to modern conditions) beginning by AD 1400, after which summer temperatures rapidly increased. The final rapid increase in our reconstruction beginning shortly after AD 1800 is in line with numerous other reconstructions based on various proxies as well as instrumented data but should still be treated with caution given vegetative disturbances by Euro-American industry by that date, possibly affecting the pollen rain on which the MAT depends (Crutzen and Stoermer Citation2000).
This new temperature model shares some features with previous reconstructions for North America (Viau et al. Citation2006, Citation2012) and the northern hemisphere (Ljungqvist Citation2010; Moberg et al. Citation2005). These similarities include an overall decline in the 3 millennia prior to AD 1 to cold summers AD ∼400–500; warm peaks ca. AD 700 and 1200; and a local minimum during the LIA ca. 1500. Other features though set this apart from many such reconstructions. For example, its local temperature minimum AD ∼900 is somewhat idiosyncratic. We argue that such differences, far from being weaknesses with the current reconstruction, contain important information about past climate processes in the SWUS.
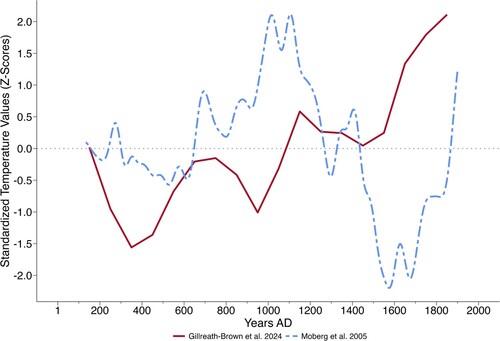
shows a highly patterned relationship between this new temperature model and one prominent earlier reconstruction for the northern hemisphere over the last 2 millennia (Moberg et al. Citation2005) (these series are standardized to the same mean and standard deviation in this figure). To over-generalize a bit, the new reconstruction portrays SWUS summers as relatively cooler than the general northern hemisphere reconstruction for nearly the entire period from AD 100–1250, but relatively warmer than general hemispheric conditions thereafter. One symptom of this is that the coldest period in the Moberg reconstruction is in the late AD 1500s whereas the MAT reconstruction places minima around AD 400 and in the AD 900s. Comparisons to longer reconstructions likewise show that SWUS summer temperatures were suppressed relative to those in the northern hemisphere for much of the third millennium BC and for three centuries centered on 1500 BC (Gillreath-Brown et al. Citation2024).
Figure 2. Low-frequency July temperature anomaly for the SWUS (Gillreath-Brown et al. Citation2024) and the Northern Hemisphere low-frequency component (Moberg et al. Citation2005) from AD 133 to 1900. Both series have been standardized to a mean of 0 and an s of 1 for the period in the graph.
This remarkable pattern of differences between Moberg’s and our reconstruction appears to be due to variability in the mean state of the El Niño/Southern Oscillation (ENSO) circulation pattern, the most important source of internal variability in the global climate system (Wanner et al. Citation2008). ENSO teleconnections with the SWUS are complex (Freund et al. Citation2019; Sandweiss et al. Citation2020) but ENSO seems to affect the Southwest more than the areas weighted in the Moberg et al. (Citation2005) reconstruction. Although the strongest ENSO effects are during the winter months, temperature effects can extend into the summer, with colder temperatures associated with El Niño-like conditions and warmer temperatures with La Niña-like conditions (Heyer et al. Citation2017; Jiménez-Moreno et al. Citation2021; Jong et al. Citation2020; Weiss et al. Citation2009). Adding to the significance of the ENSO cycle for southwestern farmers, the La Niña phase of ENSO is linked to low winter precipitation and drought in the SWUS, whereas El Niño tends to bring wetter-than-normal winter conditions and cool summers (Cook et al. Citation2014; Mann Citation2021; Weiss et al. Citation2009).
Currently ENSO mean state oscillates roughly every 2–7 years, though as of summer 2022 it looked possible that there will be three consecutive years of La Niña conditions (Jones Citation2022). It is likely though that ENSO mean state and variability have been different in the past. For example, a long, high-resolution sediment core off the coast of Peru spanning the last 20,000 years (Rein et al. Citation2005) suggests that El Niño activity generally increased from a 4000 BC low to a strong peak between about AD 200 and 1100, followed by low El Niño activity from about AD 1100 to 1500. Another remarkable proxy for El Niño activity comes from a high-elevation lake in Southern Ecuador (Moy et al. Citation2002). This record shows low El Niño activity in the early Holocene, a prominent spike shortly after 3000 BC, low activity for a millennium centered on 2000 BC, two large spikes around AD 250 and 500, a distinct lull in activity around AD 1000, and a final (somewhat lower) peak around 1250, followed by a sharp decline (Moy et al. Citation2002:Figure 1a). Such records suggest that the earth’s climate dynamics can get attracted to El-Niño-like or La Niña-dominated conditions for long periods. Over the last two decades increasingly sophisticated models of the non-linear dynamics of ENSO likewise reveal the potential for asymmetry and irregularity on long time scales (An et al. Citation2020). The proxies used by Moy et al. (Citation2002) and Rein et al. (Citation2005) are commonly used for discussions of ENSO activity (e.g., Jiménez-Moreno et al. Citation2021). No proposed proxy for ENSO activity is without problems however (Sandweiss et al. Citation2020). In this article, we hope to contribute to clarifying low-frequency ENSO activity in the SWUS.
For understanding the effects of ENSO on the SWUS, we focus on the last 2000 years for which we have hemispheric-scale low-frequency temperature reconstructions. Given the larger effect of ENSO on temperature in the SWUS than on the northern hemisphere as a whole, we argue that the difference between the standardized temperatures in the Moberg reconstruction and in the new MAT reconstruction indexes the mean state of ENSO. Periods when the new SWUS reconstruction is cooler than Moberg’s northern hemisphere estimates represent periods dominated, on average, by El Niño-like conditions (cool/wet, in the SWUS) (). Periods when the new MAT estimates are higher than those by Moberg (the late-AD 1200s – early-AD 1300s, and after AD 1400) represent periods dominated by La Niña-like conditions (warm/dry, in the SWUS). Finally, periods in which the temperature estimates are similar in both reconstructions (AD 200, the early AD 600s, the mid-AD 1200s, and the mid-AD 1300s) arise (we suggest) from a near-neutral ENSO state on average. The mechanism underlying the systematic nature of these differences (and thus the proposed ENSO Index in ) is that temperatures in the SWUS are more affected by ENSO activity and mean state than are the reconstructions of larger spatial scope to which we compare them.
Figure 3. The ENSO index is calculated as the difference between the temperature reconstruction by Gillreath-Brown et al. (Citation2024) and the low-frequency component of the Moberg et al. (Citation2005) temperature reconstruction for the Northern Hemisphere from AD 133 to 1900. This index is negative when the Gillreath-Brown et al. reconstruction is cooler than that of Moberg et al. (Citation2005), suggesting El Nino-like conditions prevailed in the SWUS. This index is positive when the Gillreath-Brown et al. (Citation2024) reconstruction is warmer than that of Moberg et al. (Citation2005), suggesting La Niña-like conditions. The ENSO Index is computed from the z-scores for the Gillreath-Brown et al. (Citation2024) and the Moberg et al. (Citation2005) reconstructions as displayed in .
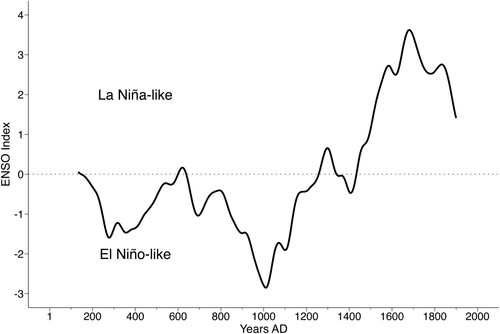
El Nino-like processes were present in the SWUS throughout the Holocene, changing in frequency and strength at decadal to millennial timescales (Jiménez-Moreno et al. Citation2021). To summarize, El Niño-like processes contributed to the low-frequency cool/wet conditions that dominated the SWUS through much of the second millennium BC (except around 1500 BC) and first millennium AD (Gillreath-Brown et al. Citation2024). After AD ∼500 summer temperatures generally increased until around AD 1400, punctuated by marked cooling in the AD 900s (). The LIA is barely recognizable in the SWUS as a cool period (but close to modern conditions) around AD 1500, though it was milder than in Europe.
We now turn to a discussion of the implications of this new record for the lives of farmers in the Southwest over this period. The proper connection for l-f climatic trends is with macro-trends in settlement, subsistence, and society.
Five Thousand Years of Farming Under Low-Frequency Variability
Conceptualizing Effects of Low-Frequency Variability
Jeff Dean (Citation1988b, Citation1996) is one of the few southwestern archaeologists to think about how l-f environmental and climatic variability affected past human societies. Dean considered variability on time-scales greater than 25 years to be low frequency. He argued that carrying capacity was strongly linked to l-f variability in hydrologic and aggradation/degradation curves, and in effective moisture. Demographic change, he suggested, is also primarily low-frequency in character. He argued that l-f processes impart “great inertia” to cultural systems, helping to account for stability of general patterns (Citation1996:30).
Inspired by Dean’s (Citation1996), we suggest that the relationship between low – and high-frequency processes be conceptualized using a marine analogy. Consider l-f processes as controlling the sea level, and h-f processes as affecting the height of waves and tides. High waves during high tide create more damage to infrastructure as sea levels rise. Carried over to climate, a decadal drought reconstructed from tree rings has more severe effects on farming if it takes place in an l-f hot/dry period than the same magnitude h-f drought in a cold/wet period. In other words, l-f processes set the level from which h-f processes depart.
For example, Sinensky et al. (Citation2022) suggest that volcanic eruptions in AD 536 and 541 entrained extreme cold that affected (though eventually helping to ignite) the Neolithic Demographic Transition in the Southwest. In light of the framework presented here, any further h-f cooling provided by these eruptions would have been especially severe given the l-f cool/wet conditions already prevailing in the SWUS in the AD 500s. Indeed, this mid-sixth-century period has been called the Late Antique Little Ice Age, and the cooling it marks has been linked to significant social change in several places in the world (Peregrine Citation2020).
High-frequency episodes can also mitigate against l-f tendencies. An example might be provided by the second-century AD warm drought of almost 50 years visible in bristlecone pine ring-widths in the Rio Grande headwaters (Routson et al. Citation2011; Vierra and Vint Citation2022). This falls within a period dominated by cool, wet, El Niño-influenced conditions, but does not appear to have been sufficiently long or broad in space to alter the l-f trend ().
Introduction and Spread of Maize in the Southwest
Selection on teosinte to produce the domesticate we refer to as maize was underway at sites like Guilá Naquitz, Oaxaca, Mexico before the end of the fifth millennium BC (Benz Citation2001; Piperno and Flannery Citation2001) and perhaps considerably earlier (Piperno et al. Citation2009). So far as we now know, maize reached the SWUS at the site of Las Capas, AZ AA:12:111 (ASM), a 50-hectare locale in the former floodplain of the Santa Cruz River (Mabry Citation2008), as early as the middle of the fourth millennium BC – if the earliest Las Capas maize age determinations, Beta-344171 and Beta-333931 (two-sigma calibrated date ranges of 5719–5594 BP and 5464–5310 BP, respectively) (Vint Citation2015) prove reliable. This maize was small in cob size and probably low in productivity (Diehl Citation2005). Its cultivators were likely seasonally mobile and mostly reliant on wild foods (Diehl and Davis Citation2016).
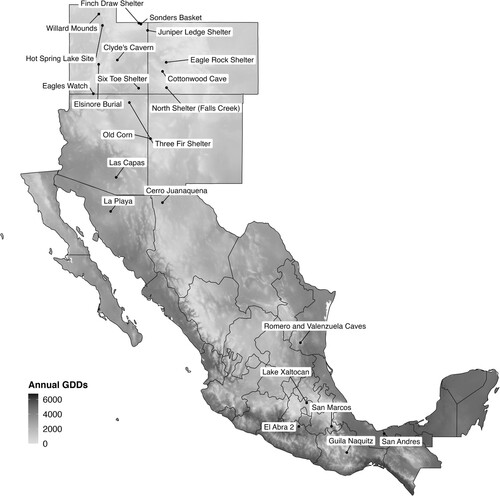
Maize apparently required only some 500 years to reach the SWUS from Oaxaca, though of course inadequate sampling of areas in between may be biasing this figure downwards. This extreme rapidity (if correct) probably attests to the high mobility of its largely forager carriers, regular communication between the archaic US Southwest and Mexico, and the relatively warm (∼3910 accumulated annual GDD), wet situation offered by Las Capas (). When speed is measured as degrees latitude/year, the transfer from Mexico was considerably more rapid than the spread farther north once maize arrived in the SWUS (). In Supplemental Figure S1, we show the modern annual accumulated growing degree days at each sample location. This provides some environmental context for how the growing conditions changed from Guilà Naquitz to Las Capas and then farther north (see also Supplemental Video S1 – S2 for the spread of maize over time).
Figure 4. Annual accumulated growing degree days across the southwestern United States and Mexico, with locations of sites mentioned in the text or the following figures. Growing degree days were extracted and calculated from the 30 s (∼1 km2) average temperature (°C) from WorldClim version 2.1 (https://www.worldclim.org/data/worldclim21.html). We use 10°C as the base and 30°C as the maximum for the GDD calculation.
For , we employ data from the Ancient Maize Map (downloaded on February 24, 2021) (Blake et al. Citation2017), the Canadian Archaeological Radiocarbon Database (CARD 2.1) (Martindale et al. Citation2016), the PAGES People3000 Archaeological Radiocarbon Database (p3k14c) (Bird et al. Citation2022; Bocinsky et al. Citation2022), and additional dated maize macrofossils as reported in Supplemental Table S1. For samples that appeared in multiple databases, we prioritized the more structured p3k14c database. Locational data were acquired from the Ancient Maize Map, UTM site coordinates, and by using sitemaps to find locations and elevations in Google Earth Pro (version 7.3.4.8642). To calibrate the maize dates, we use the latest calibration curve, IntCal20, for the Northern Hemisphere and the rcarbon package (Crema and Bevan Citation2021) to calibrate all dates used in this analysis (Reimer et al. Citation2020). Then, for analysis and plotting, we use the median calibrated age for a sample, which we convert to BC/AD. The computer code written in the R statistical language (R Core Team Citation2021) for all analyses reported here is available as a R package, cropDiffusionR, for exploring the diffusion and spread of agricultural crops (Gillreath-Brown Citation2023). All code for analysis, figures, and tables is in “Maize_Analysis.Rmd”, which can be accessed at https://github.com/Archaeo-Programmer/cropDiffusionR.
Figure 5. Earliest site with maize in each of the labeled political subdivisions, using data from the Ancient Maize Map (Blake et al. Citation2017) with additions listed in Supplemental Table S1. The linear model shows the regression of latitude on date for the labeled sites. The slope of the regression line implies an average spread rate of 0.001 degrees/year for this sample (r2 = 0.01; p > F = 0.72).
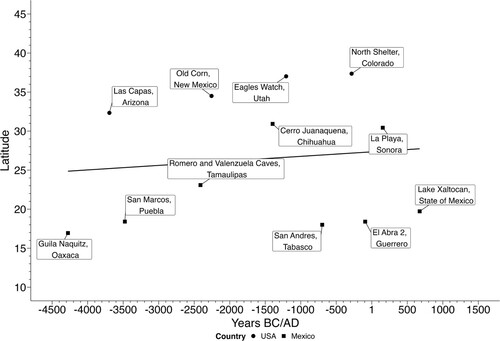
Figure 6. Location of maize’s northern frontier through time. Shown is the earliest site with maize in each century, with the constraint that only sites further north than earlier sites appear in the plot. Data from the Ancient Maize Map (Blake et al. Citation2017) with additions listed in Supplemental Table S1. The linear model shows the regression of latitude on date for the labeled sites. The slope of the regression line implies an average spread rate of 0.003 degrees/year for this sample (r2 = 0.76; p > F < 0.001). Between just Guilà Naquitz and Las Capas however the implied rate of spread is ∼8.7 times more rapid (0.026 degrees/year).
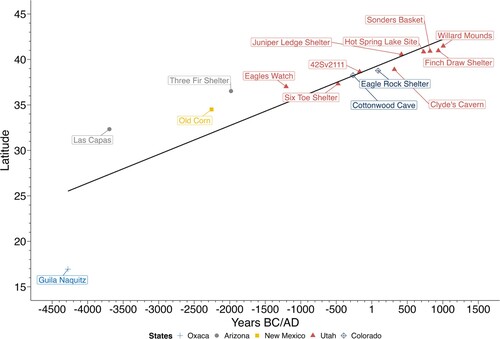
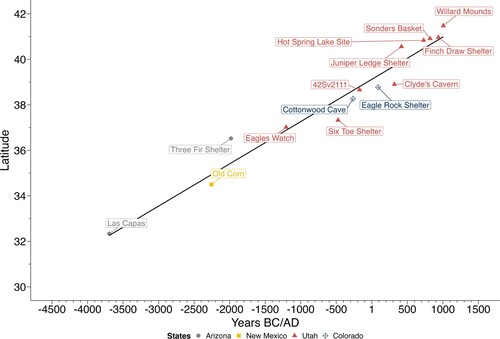
Figure 7. Location of maize’s northern frontier through time within or near the SWUS as defined here. The slope of the regression line implies an average spread rate of 0.002 degrees/year for this sample (r2 = 0.95; p > F < 0.001).
graphs the earliest known site with maize in each of the political subdivisions shown in the labels. This gives us the largest possible view of the relationship between early maize and latitude in Mexico and the US Southwest. and have a related but slightly different logic, designed to graph the location (in degrees latitude N) of the northern maize frontier as it moves through time. Starting from a temporal anchor (Guilà Naquitz in and Las Capas in ), we bin known sites with maize macrofossils by century, and plot the northernmost site in each successive century if it is also further north than any site previously plotted. Thus, not every century will have a site representing it, but the sites plotted are always the earliest with maize at a specific latitude.
All three graphs report the strength and significance of the linear relationship between northing and date of the earliest maize for some spatial population of sites. Such a relationship implies the operation of constraints on maize’s northern spread. These could be either time-distance in nature (how long it takes those carrying maize to spread) or adaptational (how long it takes maize under human selection to adapt to changing regimes of day length and growing degree days as it moves north, or how long it takes foragers to adopt maize). Almost certainly both types of constraints were present, but the speed of movement between Guilà Naquitz and Las Capas () shows that constraints of time/distance were not too binding. We therefore assume that adaptational constraints dominate those of time and distance in determining rates of spread. Of course, the SWUS is a very diverse landscape that offers a wide variety of resources that people could exploit in times of climatic distress. For example, during the forager-to-farmer transition, people used upland woodland habitats that were important refugia while the lowlands were in drought conditions (Vierra and McBrinn Citation2016; see also Vierra and Post Citation2023). The large temporal and spatial trends for the northward movement of maize cultivation we discuss here should set the context for more local-scale studies to understand how different peoples across the SWUS may have adapted to the changing climate conditions.
implies an average rate of spread of 0.001 degrees/year for this sample of space, though the relationship between latitude and date is not significant (r2 = 0.01; p > F = 0.72). We present it because the regression line strikes a compromise between the rate of northing for those sites in the SWUS together with Sonora and Chihuahua, which fall above the regression line, and those further south in Mexico, which lie below the regression line. It seems probable that this separation reflects the presence of different landraces and adaptational constraints in these two areas. Visual inspection suggests a stronger positive linear relationship among the northern sample of sites, perhaps because the rate of maize spread to these sites is more strongly controlled by rate of selection for its performance in more northerly regimes of day length and growing degree days.
We examine this possibility more closely in and . reduces the sample to just Guilà Naquitz and sites on the northern frontier of maize in or near the SWUS as defined here, resulting in a stronger (and now significant) relationship between age and northing (r2 = 0.76; p > F < 0.001). (The way in which this sample of sites was selected guarantees a positive relationship between these variables but does not dictate its strength or significance.) restricts the sample further to just sites in the SWUS, with the addition of more northern Utah/Fremont sites (Gilmore et al. Citation1999). Here the relationship is extremely strong (r2 = 0.95; p > F < 0.001), raising our confidence that a similar process (or small set of processes) dictates the rate of spread within this more delimited space.
Isotopic analyses from Utah and Arizona show heavy maize dependence by the times presented by Basketmaker II (BM II) sites like Turkey Pen, eventually reaching greater than 65% of the diet in the Puebloan Southwest (Coltrain and Janetski Citation2013; Cooper et al. Citation2016). The oldest AMS Turkey Pen maize sample (MAMS-23680) has a median calibrated date of 15 BC (Gillreath-Brown et al. Citation2019). Kelly Swarts et al. (Citation2017) have shown that selection for earlier flowering had already taken place in 1900-year-old maize from the BM II sediments of Turkey Pen Shelter in southeastern Utah, although the maize grown there then was still only marginally adapted to the locally available growing degree days, implying ongoing selection.
Archaeologists have long noted a slow drift northward of farmers (or at least farming) in the Southwest from the early agricultural populations in the Tucson Basin up to the Colorado Plateau’s BM II populations (Berry and Berry Citation1986; Matson Citation1991) (see Coltrain and Janetski Citation2019 for the current status of this model). Following the relatively slow rate of northern movement of the maize frontier from Las Capas → Old Corn (Huber and Van West Citation2006) (), the rate of northerly spread speeds up noticeably from Old Corn → Three Fir Shelter (Smiley Citation1994) under the influence of the generally warmer summers around 2300–2000 BC. Further movement north after ∼2000 BC slows once more (see the trajectory from Three Fir Shelter → Eagles Watch → Six Toe Shelter in ) perhaps influenced by long episodes of cooler-than-modern conditions from 2000–1600 BC and from 1200–800 BC ().
In Gillreath-Brown et al. (Citation2024), we extend the ENSO reconstruction implied by the difference in the two lines in further back in time. This allows us to speculate that part of the explanation for this slowing of northern movement lies in the apparent dominance of El Niño-like conditions from 1300–800 BC. Then, La Niña-like conditions from 800 BC – AD 100 led not just to warmer temperatures (which in and of themselves would have been favorable for maize expansion northward), but also to unfavorable lower soil moisture, which can lead to crop failure (Gillreath-Brown et al. Citation2019). Thus, there may be a trade-off: cooler summers were favorable for farming success in non-highland settings where it was already practiced, but impeded further northern spread of maize. The severe La Niña-like conditions in the first half of the first millennium BC may help explain the virtual absence of use of the Colorado Plateau between 1000 and 500 BC noted by Berry and Berry (Citation1986). Numerous Basketmaker II populations appear rather suddenly across broad swatches of the northern Southwest after 400 BC, following the decline in the temperature anomaly around 500 BC noted in . Cooling temperatures beginning towards the end of the first millennium BC may impede the northern expansion of maize farmers, as the spread north from Eagle Rock Shelter → Clyde’s Cavern (; Supplemental Table S1) is quite slow. That maize was able to take a big jump north by AD ∼400 despite relatively cold conditions is documented by Juniper Ledge Shelter (Truesdale Citation1993) near the Utah/Wyoming border (though at an elevation of only 1585 m). Rapid summer warming following AD ∼500 likely helped to open up the highly productive uplands of the central Mesa Verde shortly thereafter.
Population Growth and Large-Scale Movement
Numerous analyses have concluded that the rates of population growth of prehispanic Southwest populations peaked in the first millennium AD, especially in its last half, and that absolute population size likely peaked in the eleventh or twelfth century AD (Dean et al. Citation1994; Hill et al. Citation2004). These rates of growth are so impressive that most observers deem this a Neolithic (or Agricultural) Demographic Transition (NDT) (Kohler et al. Citation2008; Kohler and Reese Citation2014; Ortman et al. Citation2016; Wilshusen Citation2018). For the Southwest, Richard Lesure et al. (Citation2021) recently distinguished a low-growth phase of the NDT between 1200 BC and AD 400, followed by a high-growth phase from AD 500 to 1300.
How can we reconcile this demographic trajectory with the finding that the entire first millennium AD up to the early 1200s experienced cool summers (relative to hemispheric norms, ) under the influence of El Niño? Evidently the benefits for maize farming of the wetter conditions and higher soil moisture that on average would have accompanied these cooler summers much more than offset probable restrictions in growing season length, except perhaps in the northernmost and highest-elevation reaches of farming. To that must also be added the addition/development of more productive maize landraces ca. 100 BC, AD 500, and AD 1000 (Adams Citation1994) culminating in the highly productive floury landraces dominating harvests in the Pueblo II and III periods.
In sum, the most rapid growth of farming populations in the northern Southwest coincided with the general dominance of El Niño-like conditions during the entire period from AD 100–1000 (). This includes the “rapid expansion of early Pueblo … settlements across the Mesa Verde region” in the seventh century AD (Wilshusen Citation2018:69) and the formation of villages such as the Dillard site shortly thereafter (Diederichs Citation2016). In-place growth was likely coupled with immigration from the south. Lynda McNeil and David Shaul (Citation2020) attempt to connect some of these northward flows with ethnolinguistic groups, placing Kiowa-speaking Basketmaker groups to the east and Hopi groups to the west, both contributing (in their analysis) to the ancestry of the Fremont.
Eleventh-Century Florescence
The brief but intense l-f cooling in the AD 900s () likely contributed to the breakup of the Pueblo I villages, though these may also have been experiencing internal social dynamics limiting persistence (Janssen et al. Citation2003; Scheffer et al. Citation2021). The demographic momentum from the previous millennium however provided the context for the expansion of the hierarchical society already established in Chaco Canyon in the ninth century (Plog and Heitman Citation2010). According to the model developed by Crabtree et al. (Citation2017), the expansion of the Chacoan regional system depended on surpluses in many portions of the SWUS that favored population growth and development of leadership in numerous local societies. In turn this made possible the flow of maize surpluses/taxes (and flows of labor as well) forming a large network of ceremonial, political, and economic dependencies. The ENSO Index () reached its most extreme in the AD 1000s as the system was expanding most rapidly. High-frequency drought in the mid-1100s (Sebastian Citation1992) accompanying a diminution of the El Niño-like conditions () may have contributed to the decline of the Chaco Canyon center itself. Some of the linkages among its constituent societies were able to survive into the thirteenth century by moving their centers of interaction north to better-watered, irrigable locations along the San Juan and Aztec rivers (Benson and Berry Citation2009; Reed Citation2008).
Thirteenth-Century Crisis
Around AD 1200, ENSO dynamics entered a brief La Niña-like phase ( and ). This was the first such period in the SWUS in more than a millennium. Some years ago, Dean (Citation1996:38–44) called attention to an extraordinary breakdown, between AD 1250 and 1450, in a long-stable pattern of spatial relationships in precipitation proxied from a network of 27 tree-ring chronologies. That summer rainfall regime had been fairly stable for the previous 500 years but was disrupted for the northwest portion of the SWUS when the pattern changed from unimodal to bimodal, and the SWUS had three to four regimes rather than the two that had predominated. Although the climatic cause of that disruption is unclear, we hypothesize that this disruption is connected with the end of a long period of El Niño-dominated climates as first neutral and then La Niña-dominated climates prevailed. However, this hypothesis needs to be explored in future research.
We also connect the social chaos of the 1200s, including the very high levels of population movement, frequent conflict, and eventual depopulation of large portions of the Southwest that paved the way for fundamental culture change in the fourteenth century (Kohler et al. Citation2014; Lipe Citation1995, Citation2010; Schwindt et al. Citation2016) to the cessation of the El Niño pattern in the Southwest. Unfortunately, for the SWUS farmers, the new l-f pattern was also accompanied by unfavorable h-f conditions throughout much of the early-to-mid 1200s and in the late 1200s (Bocinsky et al. Citation2016). The depopulation of the SWUS was due to an interaction of demographic, environmental, and social factors; we propose adding the cessation of the El Niño-like pattern to the list of contributing causes. For over a thousand years, El Niño-like conditions had favored population growth and expansion into all corners of the Southwest (). Around AD 1000 these conditions started to become less predictable and by 1400 a completely different pattern was established that endures today. Throughout the Southwest, at AD ∼1300 life expectancy at birth (calculated from life tables) began plunging (Kohler and Reese Citation2014:Figure 4) and crude birth rates followed very shortly thereafter (Kohler and Reese Citation2014:Figure 3). Under the new precipitation and temperature regime prevailing after AD 1300 (with perhaps added pressure from northern foragers who had been drifting south by the mid-thirteenth century if not before [Ives Citation2020]) farming populations began to concentrate in a few favored areas in which local conditions favored continued agricultural production. Since La Niña-dominated conditions remained in place when the Spanish arrived, indigenous populations too were still in those places when encountered by Spanish conquistadors.
Conclusion
Our aim in this paper has been to underscore the connection of certain long-term, low-frequency patterns in climate and society in the prehispanic US Southwest. The low-frequency trends in temperature discussed here have only recently been reported, so this marks the first consideration of their implications for prehispanic history. When compared with reconstructions for larger areas, this temperature reconstruction also reveals traces of ENSO activity which were as important for this history as temperature variability. Our account necessarily differs in scale from the usual archaeological narrative. Connections between climate and society are not determinative in any local sequence but when viewed as an ensemble reveal a strong structure in the directions of change that have been laboriously pieced together by archaeologists for over a century.
Maize now appears to enter the Southwest significantly earlier than recognized even a few years ago. The paleoclimatic data presented here suggest that relatively warm-summer conditions in place at least by 3000 BC, when our temperature reconstruction begins, may have contributed to the early entrance of maize into the SWUS.
The mixed conditions of the second millennium BC allowed expansion of maize to the north as seen at sites such as Old Corn and Three Fir Shelter. Continuing selection on maize, and development of farming technique, likely assisted in this spread. Based on comparing this new temperature reconstruction with proxies not discussed here, we elsewhere (Gillreath-Brown et al. Citation2024) suggest that the centuries from ∼850–500 BC were dominated by La Niña-like conditions. Basketmaker II populations began to flourish around 400 BC, as these La Niña-like conditions receded.
By 100 BC summer temperatures in the Southwest began a long slide towards minima around AD 400–500. By AD 1, if not before, El Niño-like conditions became dominant (see also Conroy et al. Citation2008). These generally cool/wet conditions would adhere until around AD 1100. In the first millennium AD and up until the near-neutral AD 1100–1300 period dominance of El Niño-like conditions provided the climatic framework underwriting high maize production in large portions of the Southwest, the regional Neolithic Demographic Transition, and the emergence of the state-adjacent Chacoan polity. The populations of the Southwest, now coping with the megadroughts, water crises, and thermal stress brought on by the conjunction of La Niña-like conditions with global warming (Williams et al. Citation2022), would surely welcome a return to the El Niño-like climate of the first millennium AD.
Supplemental Material
Download GIF Image (2.4 MB)
Supplemental Material
Download GIF Image (9.7 MB)
Supplemental Material
Download MS Excel (176.4 KB)Supplemental Material
Download PDF (157 KB)Acknowledgments
We thank our colleagues in the Village Ecodynamics Project and at Crow Canyon Archaeological Center for discussions of settlement processes in the prehispanic US Southwest over many years; our colleagues in the SKOPE Project (https://www.openskope.org) to which this study may contribute; Daniel Muratore for insight on ENSO dynamics; Jim Vint for extended discussions on the earliest maize in the Southwest; and Michael Blake, Mona Charles, Lori Love, Katie Richards, and Heidi Roberts for additional radiocarbon data and contextual information on maize samples. This material is based upon work supported by the National Science Foundation under Grants SMA-1637171 and SMA-1620462, and by the Office of the Chancellor, Washington State University-Pullman. We thank the reviewers – Gary Huckleberry, Bradley Vierra, and one anonymous – for their valuable, thoughtful, and constructive comments that helped to strengthen this paper. We also thank Cody Routson, John (Jack) Williams, and Keith Kintigh for comments and feedback on the temperature reconstruction (Gillreath-Brown et al. Citation2024), which was invaluable in improving the climate reconstruction that was used in this paper.
Disclosure Statement
No potential conflict of interest was reported by the author(s).
Supplemental Material
Supplemental data for this article can be accessed online at https://doi.org/10.1080/00231940.2024.2348941.
Data Availability Statement
The data that support the findings of this study are openly available in GitHub at https://github.com/Archaeo-Programmer/cropDiffusionR.
Additional information
Funding
References Cited
- Adams, Karen R. 1994 A Regional Synthesis of Zea mays in the Prehistoric American Southwest. In Corn and Culture in the Prehistoric New World, edited by Sissel Johannessen, Christine A. Hastorf, pp. 273–302. Westview Press, Boulder.
- An, Soon-Il, Eli Tziperman, Yuko M. Okumura, and Tim Li 2020 ENSO Irregularity and Asymmetry. El Niño Southern Oscillation in a Changing Climate. Geophysical Monograph Series, Wiley, Hoboken, NJ.
- Anchukaitis, Kevin J., Rob Wilson, Keith R. Briffa, Ulf Büntgen, Edward R. Cook, Rosanne D’Arrigo, Nicole Davi, Jan Esper, David Frank, Björn E. Gunnarson, Gabi Hegerl, Samuli Helama, Stefan Klesse, Paul J. Krusic, Hans W. Linderholm, Vladimir Myglan, Timothy J. Osborn, Peng Zhang, Milos Rydval, Lea Schneider, Andrew Schurer, Greg Wiles, and Eduardo Zorita 2017 Last Millennium Northern Hemisphere Summer Temperatures From Tree Rings: Part II, Spatially Resolved Reconstructions. Quaternary Science Reviews 163:1–22.
- Benson, Larry V. and Michael S. Berry 2009 Climate Change and Cultural Response in the Prehistoric American Southwest. The Kiva 75(1):89–119.
- Benson, Larry V., Douglas K. Ramsey, David W. Stahle, and Kenneth L. Petersen 2013 Some Thoughts on the Factors That Controlled Prehistoric Maize Production in the American Southwest with Application to Southwestern Colorado. Journal of Archaeological Science 40(7):2869–2880.
- Benz, B.F. 2001 Archaeological Evidence of Teosinte Domestication from Guilá Naquitz, Oaxaca. Proceedings of the National Academy of Sciences 98(4):2104–2106.
- Berry, Claudia, and Michael Berry 1986 Chronological and Conceptual Models of the Southwestern Archaic. In Anthropology of the Desert West: Essays in Honor of Jesse D. Jennings, edited by C. J. Condie, D. D. Fowler, pp. 253–327. Anthropological Papers, University of Utah, Salt Lake City.
- Bird, Darcy, Lux Miranda, Marc Vander Linden, Erick Robinson, R. Kyle Bocinsky, Chris Nicholson, José M. Capriles, Judson Byrd Finley, Eugenia M. Gayo, Adolfo Gil, Jade D’Alpoim Guedes, Julie A. Hoggarth, Andrea Kay, Emma Loftus, Umberto Lombardo, Madeline Mackie, Alessio Palmisano, Steinar Solheim, Robert L. Kelly, and Jacob Freeman 2022 p3k14c, A Synthetic Global Database of Archaeological Radiocarbon Dates. Scientific Data 9(1):27.
- Blake, M., B. Benz, D. Moreiras, L. Masur, N. Jakobsen, and R. Wallace 2017 Ancient Maize Map: An Online Database and Mapping Program for Studying the Archaeology of Maize in the Americas. Laboratory of Archaeology, University of British Columbia, Vancouver. <http://en.ancientmaize.com/maps>.
- Bocinsky, R. Kyle, J. Rush, K. W. Kintigh, and T. A. Kohler 2016 Exploration and Exploitation in the Macrohistory of the Pre-hispanic Pueblo Southwest. Science Advances 2(4): e150153.
- Bocinsky, R. Kyle, D. Bird, L. Miranda, and J. Freeman 2022 Compendium of R Code and Data for p3k14c: A Synthetic Global Database of Archaeological Radiocarbon Dates, 1 December 2022. https://doi.org/10.5281/zenodo.6633635.
- Chevalier, Manuel, Basil A. S. Davis, Oliver Heiri, Heikki Seppä, Brian M. Chase, Konrad Gajewski, Terri Lacourse, Richard J. Telford, Walter Finsinger, Joël Guiot, Norbert Kühl, S. Yoshi Maezumi, John R. Tipton, Vachel A. Carter, Thomas Brussel, Leanne N. Phelps, Andria Dawson, Marco Zanon, Francesca Vallé, Connor Nolan, Achille Mauri, Anne de Vernal, Kenji Izumi, Lasse Holmström, Jeremiah Marsicek, Simon Goring, Philipp S. Sommer, Michelle Chaput, and Dmitry Kupriyanov 2020 Pollen-based Climate Reconstruction Techniques for Late Quaternary Studies. Earth-Science Reviews 210:103384.
- Coltrain, Joan Brenner, and Joel C. Janetski 2013 The Stable and Radio-isotope Chemistry of Southeastern Utah Basketmaker II Burials: Dietary Analysis Using the Linear Mixing Model SISUS, Age and Sex Patterning, Geolocation and Temporal Patterning. Journal of Archaeological Science 40(12):4711–4730.
- Coltrain, Joan Brenner, and Joel C. Janetski 2019 Reevaluation of Basketmaker II Origins. Journal of Anthropological Archaeology 56:101085.
- Conroy, Jessica L., Jonathan T. Overpeck, Julia E. Cole, Timothy M. Shanahan, and Miriam Steinitz-Kannan 2008 Holocene Changes in Eastern Tropical Pacific Climate Inferred from a Galápagos Lake Sediment Record. Quaternary Science Reviews 27(11):1166–1180.
- Cook, Edward R., Keith R. Briffa, David M. Meko, Donald A. Graybill, and Gary Funkhouser 1995 The ‘Segment Length Curse’ in Long Tree-ring Chronology Development for Palaeoclimatic Studies. The Holocene 5(2):229–237.
- Cook, Benjamin I., Jason E. Smerdon, Richard Seager, and Edward R. Cook 2014 Pan-continental Droughts in North America over the Last Millennium. Journal of Climate 27:383–397.
- Cook, Edward R., Connie A. Woodhouse, C. Mark Eakin, David M. Meko, and David W. Stahle 2004 Long-term Aridity Changes in the Western United States. Science 306(5698):1015–1018.
- Cooper, C., K. Lupo, R.G. Matson, W. Lipe, C.I. Smith, and M.P. Richards 2016 Short-term Variability of Human Diet at Basketmaker II Turkey Pen Ruins, Utah: Insights from Bulk and Single Amino Acid Isotope Analysis of Hair. Journal of Archaeological Science: Reports 5:10–18.
- Crabtree, Stefani A., R. Kyle Bocinsky, Paul L. Hooper, Susan C. Ryan, and Timothy A. Kohler 2017 How to Make a Polity (in the Central Mesa Verde Region). American Antiquity 82:71–95.
- Crema, Enrico R., and Andrew Bevan 2021 Inference from Large Sets of Radiocarbon Dates: Software and Methods. Radiocarbon 63(1):23–39. Accessed September 20, 2022.
- Crutzen, P.J., and E.F. Stoermer 2000 The “Anthropocene.” Global Change Newsletter 41:17–18.
- Dean, Jeffrey S. 1988a Dendrochronology and Paleoenvironmental Reconstruction on the Colorado Plateau. In The Anasazi in a Changing Environment, edited by George J. Gumerman, pp. 119–167. Cambridge University Press, Cambridge.
- Dean, Jeffrey S. 1988b A Model of Anasazi Behavioral Adaptation. In The Anasazi in a Changing Environment, edited by George J. Gumerman, pp. 25–44. Cambridge University Press, Cambridge.
- Dean, Jeffrey S. 1996 Demography, Environment, and Subsistence Stress. In Evolving Complexity and Environmental Risk in the Prehistoric Southwest, edited by Joseph A. Tainter, B. Bagley Tainter, pp. 25–56. Addison Wesley, Reading, MA.
- Dean, Jeffrey S., William H. Doelle, and Janet D. Orcutt 1994 Adaptive Stress, Environment, and Demography. In Themes in Southwestern Prehistory, edited by G. G. Gumerman, pp. 53–86. School of American Research Press, Santa Fe.
- Dean, Jeffrey S., and William J. Robinson 1978 Expanded Tree-ring Chronologies for the Southwestern United States. Chronology Series III. Laboratory of Tree-Ring Research. University of Arizona, Tucson, AZ.
- Diederichs, Shanna R. 2016 Basketmaker III Colonization and the San Juan Frontier. Unpublished MA thesis, Northern Arizona University, Flagstaff, Arizona.
- Diehl, Michael W. 2005 Morphological Observations on Recently Recovered Early Agricultural Period Maize Cob Fragments from Southern Arizona. American Antiquity 70(2):361–375.
- Diehl, Michael W., and Owen K. Davis 2016 The Short, Unhappy Use Lives of Early Agricultural Period “Food Storage” Pits at the Las Capas Site, Southern Arizona. American Antiquity 81(2):333–344.
- Freund, Mandy B., Benjamin J. Henley, David J. Karoly, Helen V. McGregor, Nerilie J. Abram, and Dietmar Dommenget 2019 Higher Frequency of Central Pacific El Niño Events in Recent Decades Relative to Past Centuries. Nature Geoscience 12(6):450–455.
- Gillreath-Brown, Andrew D. 2023 cropDiffusionR: Exploring the Diffusion of Agricultural Crops. R Package. doi:10.5281/zenodo.7113812.
- Gillreath-Brown, Andrew, R. Kyle Bocinsky, and Timothy A. Kohler 2024 A Low-Frequency Summer Temperature Reconstruction for the United States Southwest, 3000 BC – AD 2000. The Holocene 34(4):451–466. doi:10.1177/09596836231219482.
- Gillreath-Brown, Andrew, Aaron Deter-Wolf, Karen R. Adams, Valerie Lynch-Holm, Samantha Fulgham, Shannon Tushingham, William D. Lipe, and R. G. Matson 2019a Redefining the Age of Tattooing in Western North America: A 2,000-year-old Artifact from Utah. Journal of Archaeological Science: Reports 24:1064–1075.
- Gillreath-Brown, Andrew, Lisa Nagaoka, and Steve Wolverton 2019b A Geospatial Method for Estimating Soil Moisture Variability in Prehistoric Agricultural Landscapes. PLoS One 14(8):e0220457.
- Gilmore, Kevin P., Marcia J. Tate, Mark L. Chenault, Bonnie J. Clark, Terry McBride, and Margaret Wood (editors) 1999 Colorado Prehistory: A Context for the Platte River Basin. Colorado Council of Professional Archaeologists, Denver.
- Heyer, Joshua P., Simon C. Brewer, and Jacqueline J. Shinker 2017 Using High-Resolution Reanalysis Data to Explore Localized Western North America Hydroclimate Relationships with ENSO. Journal of Climate 30(14):5395–5417.
- Hill, J. Brett, Jeffery J. Clark, William H. Doelle, and Patrick D. Lyons 2004 Prehistoric Demography in the Southwest: Migration, Coalescence, and Hohokam Population Decline. American Antiquity 69(04):689–716.
- Huber, Edgar K., and Carla Rebecca Van West (editors) 2006 Fence Lake Project: Archaeological Data Recovery in the New Mexico Transportation Corridor and First Five-year Permit Area, Fence Lake Coal Mine Project, Catron County, New Mexico. University of Arizona Press, Tucson.
- Huckleberry, Gary 2015 Defining the Environmental Context of Indigenous Agriculture in the Southwest: What We Don’t Know About Mid-to-Late Holocene Climate Change and Floodplain Dynamics. In Traditional Arid Lands Agriculture: Understanding the Past for the Future, edited by Scott E. Ingram and Robert C. Hunt, pp. 89–130. University of Arizona Press, Tucson.
- Ives, John W. 2020 The View from Promontory Point. In Spirit Lands of the Eagle and Bear: Numic Archaeology and Ethnohistory in the Rocky Mountains and Borderlands, edited by Robert H. Brunswig, pp. 90–117. University Press of Colorado, Boulder, CO.
- Janssen, Marco A., Timothy A. Kohler, and Marten Scheffer 2003 Sunk-Cost Effects and Vulnerability to Collapse in Ancient Societies. Current Anthropology 44(5):722–728.
- Jiménez-Moreno, Gonzalo, R Scott Anderson, and Jacqueline J. Shinker 2021 ENSO, Sun and Megadroughts in SW USA During the Last 11,000 Years. Earth and Planetary Science Letters 576:117217.
- Jones, Nicola 2022 Rare ‘Triple’ La Niña Climate Event Looks Likely — What Does the Future Hold? Nature 607:21.
- Jong, Bor-Ting, Mingfang Ting, Richard Seager, and Weston B. Anderson 2020 ENSO Teleconnections and Impacts on U.S. Summertime Temperature During a Multiyear La Niña Life Cycle. Journal of Climate 33(14):6009–6024.
- Kaufman, D., N. McKay, C. Routson, M. Erb, B. Davis, O. Heiri, S. Jaccard, J. Tierney, C. Dätwyler, Yarrow Axford, Thomas Brussel, Olivier Cartapanis, Brian Chase, Andria Dawson, Anne de Vernal, Stefan Engels, Lukas Jonkers, Jeremiah Marsicek, Paola Moffa-Sánchez, Carrie Morrill, Anais Orsi, Kira Rehfeld, Krystyna Saunders, Philipp S. Sommer, Elizabeth Thomas, Marcela Tonello, Mónika Tóth, Richard Vachula, Andrei Andreev, Sebastien Bertrand, Boris Biskaborn, Manuel Bringué, Stephen Brooks, Magaly Caniupán, Manuel Chevalier, Les Cwynar, Julien Emile-Geay, John Fegyveresi, Angelica Feurdean, Walter Finsinger, Marie-Claude Fortin, Louise Foster, Mathew Fox, Konrad Gajewski, Martin Grosjean, Sonja Hausmann, Markus Heinrichs, Naomi Holmes, Boris Ilyashuk, Elena Ilyashuk, Steve Juggins, Deborah Khider, Karin Koinig, Peter Langdon, Isabelle Larocque-Tobler, Jianyong Li, André Lotter, Tomi Luoto, Anson Mackay, Eniko Magyari, Steven Malevich, Bryan Mark, Julieta Massaferro, Vincent Montade, Larisa Nazarova, Elena Novenko, Petr Pařil, Emma Pearson, Matthew Peros, Reinhard Pienitz, Mateusz Płóciennik, David Porinchu, Aaron Potito, Andrew Rees, Scott Reinemann, Stephen Roberts, Nicolas Rolland, Sakari Salonen, Angela Self, Heikki Seppä, Shyhrete Shala, Jeannine-Marie St-Jacques, Barbara Stenni, Liudmila Syrykh, Pol Tarrats, Karen Taylor, Valerie van den Bos, Gaute Velle, Eugene Wahl, Ian Walker, Janet Wilmshurst, Enlou Zhang, and Snezhana Zhilich 2020 A Global Database of Holocene Paleo-temperature Records. Scientific Data 7(1):115.
- Kohler, Timothy A., Matt Pier Glaude, Jean-Pierre Bocquet-Appel, and Brian M. Kemp 2008 The Neolithic Demographic Transition in the U.S. Southwest. American Antiquity 73(4):645–669.
- Kohler, Timothy A., Katie Grundtisch, Scott G. Ortman, Carly Fitzpatrick, and Sarah M. Cole 2014 The Better Angels of Their Nature: Declining Violence Through Time Among Prehispanic Farmers of the Pueblo Southwest. American Antiquity 79:444–464.
- Kohler, Timothy A., and Kelsey M. Reese 2014 Long and Spatially Variable Neolithic Demographic Transition in the North American Southwest. Proceedings of the National Academy of Sciences 111(28):10101–10106.
- Lesure, Richard G., R. J. Sinensky, Gregson Schachner, Thomas A. Wake, and Katelyn J. Bishop 2021 Large-Scale Patterns in the Agricultural Demographic Transition of Mesoamerica and Southwestern North America. American Antiquity 86(3):593–612.
- Lipe, William D. 1995 The Depopulation of the Northern San Juan: Conditions in the Turbulent 1200s. Journal of Anthropological Archaeology 14:143–169.
- Lipe, William D. 2010 Lost in Transit. In Leaving Mesa Verde: Peril and Change in the Thirteenth-century Southwest, edited by Timothy A. Kohler, Mark D. Varien, Aaron M. Wright, pp. 262–284. Amerind Studies in Anthropology. University of Arizona Press, Tucson, AZ.
- Ljungqvist, Fredrik Charpentier 2010 A New Reconstruction of Temperature Variability in the Extra-Tropical Northern Hemisphere During the Last Two Millennia. Geografiska Annaler: Series A, Physical Geography 92(3):339–351.
- Mabry, Jonathan B. 2008 Las Capas: Early Irrigation and Sedentism in a Southwestern Floodplain. Center for Desert Archaeology, Tucson, AZ.
- Mann, Michael E. 2021 Beyond the Hockey Stick: Climate Lessons From the Common Era. Proceedings of the National Academy of Sciences of the United States of America 118(39):e2112797118. doi:10.1073/pnas.2112797118.
- Martindale, Andrew, Richard Morlan, Matthew Betts, Michael Blake, Konrad Gajewski, Michelle Chaput, Andrew Mason, and Pierre Vermeersch 2016 Canadian Archaeological Radiocarbon Database (CARD 2.1). Accessed on November 14, 2022.
- Matson, Richard Ghia 1991 The Origins of Southwestern Agriculture. University of Arizona Press, Tucson, AZ.
- McNeil, Lynda D., and David L. Shaul 2020 Itamu umumi yooya’ ökiwni (“We Will Arrive as Rain to You”): Evidence of Historical Relationships Among Western Basketmaker, Fremont, and Hopi Peoples. The Kiva 86(3):245–273.
- Moberg, Anders, Dmitry M. Sonechkin, Karin Holmgren, Nina M Datsenko, and Wibjörn Karlén 2005 Highly Variable Northern Hemisphere Temperatures Reconstructed from Low-and High-resolution Proxy Data. Nature 433(7026):613–617.
- Moy, Christopher M., Geoffrey O. Seltzer, Donald T. Rodbell, and David M. Anderson 2002 Variability of El Niño/Southern Oscillation Activity at Millennial Timescales During the Holocene Epoch. Nature 420(6912):162–165.
- Ortman, Scott G., Shanna Diederichs, Kari Schleher, Jerry Fetterman, Marcus Espinosa, and Caitlin Sommer 2016 Demographic and Social Dimensions of the Neolithic Revolution in Southwest Colorado. The Kiva 82(3):232–258.
- Overpeck, Jonathan T., Thompson Webb, and I.C. Prentice 1985 Quantitative Interpretation of Fossil Pollen Spectra: Dissimilarity Coefficients and the Method of Modern Analogs. Quaternary Research 23(1):87–108.
- Peregrine, Peter N. 2020 Climate and Social Change at the Start of the Late Antique Little Ice Age. The Holocene 30(11):1643–1648.
- Piperno, D.R., and K.V. Flannery 2001 The Earliest Archaeological Maize (Zea mays L.) From Highland Mexico: New Accelerator Mass Spectrometry Dates and Their Implications. Proceedings of the National Academy of Sciences of the United States of America 98(4):2101–2103.
- Piperno, Dolores R., Anthony J. Ranere, Irene Holst, Jose Iriarte, and Ruth Dickau 2009 Starch Grain and Phytolith Evidence for Early Ninth Millennium B.P. Maize from the Central Balsas River Valley, Mexico. Proceedings of the National Academy of Sciences 106(13):5019–5024.
- Plog, Stephen, and Carrie Heitman 2010 Hierarchy and Social Inequality in the American Southwest, A.D. 800–1200. Proceedings of the National Academy of Sciences 107(46):19619–19626.
- Ranere, Anthony J., Dolores R. Piperno, Irene Holst, Ruth Dickau, and José Iriarte 2009 The Cultural and Chronological Context of Early Holocene Maize and Squash Domestication in the Central Balsas River Valley, Mexico. Proceedings of the National Academy of Sciences 106(13):5014–5018.
- R Core Team 2021 R: A Language and Environment for Statistical Computing. Version 10.15.7. R Foundation for Statistical Computing, Vienna, Austria.
- Reed, Paul F. 2008 Setting the Stage: A Reconsideration of Salmon, Aztec, and the Middle San Juan Region in Chacoan and Post-Chacoan Puebloan History. In Chaco’s Northern Prodigies: Salmon, Aztec, and the Ascendancy of the Middle San Juan Region After AD 1100, edited by Paul F. Reed, pp. 3–25. The University of Utah Press, Salt Lake City.
- Reimer, Paula J., William E. N. Austin, Edouard Bard, Alex Bayliss, Paul G. Blackwell, Christopher Bronk Ramsey, Martin Butzin, Hai Cheng, R. Lawrence Edwards, Michael Friedrich, Pieter M. Grootes, Thomas P. Guilderson, Irka Hajdas, Timothy J. Heaton, Alan G. Hogg, Konrad A. Hughen, Bernd Kromer, Sturt W. Manning, Raimund Muscheler, Jonathan G. Palmer, Charlotte Pearson, Johannes van der Plicht, Ron W. Reimer, David A. Richards, E. Marian Scott, John R. Southon, Christian S. M. Turney, Lukas Wacker, Florian Adolphi, Ulf Büntgen, Manuela Capano, Simon M. Fahrni, Alexandra Fogtmann-Schulz, Ronny Friedrich, Peter Köhler, Sabrina Kudsk, Fusa Miyake, Jesper Olsen, Frederick Reinig, Minoru Sakamoto, Adam Sookdeo, and Sahra Talamo 2020 The IntCal20 Northern Hemisphere Radiocarbon Age Calibration Curve (0–55 cal kBP). Radiocarbon 62(4):725–757.
- Rein, B, A Lückge, L Reinhardt, and F Sirocko 2005 El Niño Variability off Peru During the Last 20,000 Years. Paleoceanography 20:PA4003. doi:10.1029/2004PA001099.
- Routson, Cody C., Connie A. Woodhouse, and Jonathan T. Overpeck 2011 Second Century Megadrought in the Rio Grande Headwaters, Colorado: How Unusual Was Medieval Drought? Geophysical Research Letters 38(22):L22703.
- Sandweiss, Daniel H., C. Fred T. Andrus, Alice R. Kelley, Kirk A. Maasch, Elizabeth J. Reitz, and Paul B. Roscoe 2020 Archaeological Climate Proxies and the Complexities of Reconstructing Holocene El Niño in Coastal Peru. Proceedings of the National Academy of Sciences of the United States of America 117(15):8271–8279.
- Scheffer, Marten, Egbert H. van Nes, Darcy Bird, R. Kyle Bocinsky, and Timothy A. Kohler 2021 Loss of Resilience Preceded Transformations of pre-Hispanic Pueblo Societies. Proceedings of the National Academy of Sciences 118(18):e2024397118.
- Schwindt, Dylan M., R. Kyle Bocinsky, Scott Ortman, Donna M. Glowacki, Mark D. Varien, and Timothy A. Kohler 2016 The Social Consequences of Climate Change in the Central Mesa Verde Region. American Antiquity 81(1):74–96.
- Sebastian, Lynne 1992 The Chaco Anasazi: Sociopolitical Evolution in the Prehistoric Southwest. Cambridge University Press, Cambridge.
- Sinensky, R.J., Gregson Schachner, Richard H. Wilshusen, and Brian N. Damiata 2022 Volcanic Climate Forcing, Extreme Cold and the Neolithic Transition in the Northern US Southwest. Antiquity 96(385):123–141.
- Smiley, Francis E. 1994 The Agricultural Transition in the Northern Southwest: Patterns in the Current Chronometric Data. The Kiva 60(2):165–189.
- Swarts, Kelly, Rafal M. Gutaker, Bruce Benz, Michael Blake, Robert Bukowski, James Holland, Melissa Kruse-Peeples, Nicholas Lepak, Lynda Prim, M. Cinta Romay, Jeffrey Ross-Ibarra, Jose de Jesus Sanchez-Gonzalez, Chris Schmidt, Verena J. Schuenemann, Johannes Krause, RG Matson, Detlef Weigel, Edward S. Buckler, and Hernán A. Burbano 2017 Genomic Estimation of Complex Traits Reveals Ancient Maize Adaptation to Temperate North America. Science 357(6350):512–515.
- Truesdale, James A. 1993 Archeological Investigations at Two Sites in Dinosaur National Monument: 42UN1724 and 5MF2645. Selections from the Division of Cultural Resources No. 4. Rocky Mountain Region, National Park Service, Denver.
- Van West, CR 1994 Modeling Prehistoric Agricultural Productivity in Southwestern Colorado: A GIS Approach. Reports of Investigations no. 67. Department of Anthropology, WSU & Crow Canyon Archaeological Center, Pullman, WA & Cortez, CO.
- Viau, André E., Konrad Gajewski, Michael C. Sawada, and P Fines 2006 Millennial-scale Temperature Variations in North America During the Holocene. Journal of Geophysical Research, D: Atmospheres 111:D09102.
- Viau, A. E., M Ladd, and K Gajewski 2012 The Climate of North America During the Past 2000 Years Reconstructed from Pollen Data. Global and Planetary Change 84-85:75–83.
- Vierra, B. J., and M. E. McBrinn 2016 Resistant Foragers: Foraging and Maize Cultivation in the Northern Rio Grande Valley. In Late Holocene Research on Foragers and Farmers in the Desert West, edited by Barbara J. Roth, Maxine E. McBrinn, pp. 58–77. The University of Utah Press, Salt Lake City.
- Vierra, Bradley J., and Stephen S. Post 2023 Foragers in Transition: The Middle Archaic in the Northern Rio Grande Valley. The Kiva 89(2):139–166.
- Vierra, Bradley J., and James M. Vint 2022 Climate Change and the Neolithic in the American Southwest. Journal of Anthropological Research 78(1):59–83.
- Vint, James M. 2015 Las Capas, AZ AA:12:111 (ASM), Introduced: Background, Chronology, and Research Orientation. In Implements of Change: Tools, Subsistence, and the Built Environment of Las Capas, an Early Agricultural Irrigation Community in Southern Arizona, edited by James M. Vint, pp. 1–32. Anthropological Papers No. 51. Archaeology Southwest, Tucson, AZ.
- Wanner, Heinz, Jürg Beer, Jonathan Bütikofer, Thomas J. Crowley, Ulrich Cubasch, Jacqueline Flückiger, Hugues Goosse, Martin Grosjean, Fortunat Joos, Jed O. Kaplan, Marcel Küttel, Simon A. Müller, I. Colin Prentice, Olga Solomina, Thomas F. Stocker, Pavel Tarasov, Mayke Wagner, and Martin Widmann 2008 Mid- to Late Holocene Climate Change: An Overview. Quaternary Science Reviews 27(19):1791–1828.
- Weiss, Jeremy L., Christopher L. Castro, and Jonathan T. Overpeck 2009 Distinguishing Pronounced Droughts in the Southwestern United States: Seasonality and Effects of Warmer Temperatures. Journal of Climate 22(22):5918–5932.
- Williams, A. Park, Benjamin I. Cook, and Jason E. Smerdon 2022 Rapid Intensification of the Emerging Southwestern North American Megadrought in 2020–2021. Nature Climate Change 12(3):232–234.
- Wilshusen, RH 2018 How Agriculture Took Hold in the Mesa Verde Region: A Review of Recent Research on the Late Basketmaker–Early Pueblo Periods (AD 500–920). Reviews in Colorado Archaeology 1(Article 4):69–95.