Abstract
Electron-nuclear double resonance (ENDOR) is a fundamental technique in electron paramagnetic resonance (EPR) spectroscopy that directly detects hyperfine transitions of nuclei coupled to a paramagnetic centre. Despite its wide use, spin-sensitivity and restricted spectral resolution in powder samples pose limitations of this technique in modern application fields of EPR. In this contribution, we examine the performance of an ENDOR pulse sequence that utilises a preparation scheme different from conventional Davies ENDOR. The scheme is based on electron-nuclear cross-polarisation (eNCP), which requires concomitant microwave (MW) and radio-frequency (RF) irradiation satisfying specific matching conditions between the MW and RF offsets and the hyperfine coupling. Changes in nuclear polarisation generated during eNCP can be detected via a conventional ENDOR read-out sequence consisting of an RF π-pulse followed by EPR-spin echo detection. Using 1H-BDPA as a standard sample, we first examine the CP matching conditions by monitoring the depolarisation of the electron spin magnetisation. Subsequently, so-called CP-edited ENDOR spectra for different matching conditions are reported and analysed based on the provided theoretical description of the time evolution of the spin density matrix during the experiment. The results demonstrate that CP-edited ENDOR provides additional information with respect to the sign of the hyperfine couplings. Furthermore, the sequence is less sensitive to nuclear saturation effects encountered in conventional ENDOR.
Introduction
Electron-nuclear double resonance (ENDOR) encompasses a family of polarisation transfer techniques, which detects the hyperfine couplings of nuclei in the ligand sphere of a paramagnetic centre [Citation1–4]. This technique at high magnetic fields provides strongly improved spectral resolution [Citation5,6]. Here, not only orientational selectivity but also increased resolution in the nuclear Larmor frequencies and suppression of second-order effects substantially simplify analysis and interpretation of hyperfine spectra. Representative examples for the application of ENDOR have been the elucidation of the ligand sphere of metal centres or the detection of hydrogen bond interactions in proteins [Citation7–10]. Nevertheless, one substantial drawback of the currently used ENDOR techniques is the small ENDOR effect as compared to the available EPR signal. Although the combination of microwave (MW) and radio-frequency (RF) pulses in standard Davies or Mims ENDOR could in principle enable 100% transfer of spin polarisation between electron and nuclear spin manifolds, in practice the situation is far from perfect and it is common to observe a pulse ENDOR response of the level of a few percent of the electron spin echo. This is largely due to the effect of spin relaxation in samples under study and off-resonance effects, which occur when the experiments are performed on orientationally disordered, powder or frozen solution samples. This low sensitivity leads to the requirement of sample concentrations in ENDOR of one or two orders of magnitude larger than in an EPR experiment and dramatically aggravates the application potential of this technique in studies of biological systems (available only in concentrations on the order of 100 μM). The pulsed ENDOR efficiency and the related issues have been analysed in the past in experimental and theoretical work [Citation3,4,Citation11–14]. A sequence, called Tidy ENDOR, has been recently proposed to circumvent relaxation bottlenecks [Citation13]. The sequence adds an additional selective RF inversion pulse after the echo detection that basically undoes the nuclear spin polarisation created during the traditional Davies sequence. However, the degree of enhancement offered by this sequence over standard Davies ENDOR is very sensitive to pulse nutation errors caused by RF field inhomogeneity and to off-resonance effects [Citation13,14].
Other approaches to think about are polarisation transfer pathways between electron and nuclear spins emerged from studies of dynamic nuclear polarisation (DNP). Here, polarisation transfer between electron and nuclear spins is employed to enhance macroscopically the polarisation of the nuclei in the sample [Citation15–20]. In contrast to the ENDOR technique, where only nuclei with strong hyperfine couplings (r < 1 nm) are detected, in the general (liquids and solids) DNP process the polarisation is potentially transferred to all nuclei of the sample and the DNP experiment detects the nuclear magnetic resonance (NMR) signal of the entire sample. Currently, DNP experiments are performed almost exclusively under continuous wave (CW) MW irradiation and polarisation build up is slow, on the order of seconds in liquids and up to hours in solids. Therefore, efforts have been undertaken to find more efficient, pulsed polarisation transfer schemes. One possibility exploited in the past is coherent polarisation transfer between electron and nuclei as inspired by the well-known Hartmann–Hahn (HH) cross-polarisation technique [Citation21] which is widely used in NMR. Nevertheless, for electron and nuclear spins the experiment differs in significant respects from its NMR counterpart because of the large experimental mismatch between the obtainable MW and RF fields due to the much larger gyromagnetic ratio of the electron () and also due to the large hyperfine coupling that can far exceed the available RF and sometimes also MW fields. The first approach proposed already in the 80s was called nuclear orientation via electron spin locking (NOVEL). Here the HH condition is achieved at low external magnetic fields, where the MW field of the electron spin in the rotating frame matches the Larmor frequency of nuclear spin in the laboratory frame [Citation22,23]. A variant of the NOVEL technique was the integrated solid effect (ISE), which uses CW MW irradiation and a fast field sweep through the EPR line, thereby rotating all spins through the HH condition [Citation24]. However, these methods are limited to MW frequencies around 9 GHz (X-band) and are not applicable at higher fields and frequencies, i.e. 94 GHz (W-band). Recently, a dressed-state solid effect (DSSE) or electron-nuclear cross-polarisation (eNCP) has been proposed that mostly resembles the HH experiment [Citation25,26]. Here, the electron spins are irradiated by a MW field of constant amplitude and simultaneously the target nuclear spins are irradiated with constant RF amplitude at well-defined resonance frequency offsets. Efficient transfer of transverse electron magnetisation to longitudinal nuclear magnetisation in a two-spin system was predicted when generalised HH matching conditions are satisfied between electron and nuclear frequency offsets as well as the MW field and hyperfine coupling strength [Citation26,27]. This work also suggested that electron-nuclear polarisation transfer can be detected via an ENDOR experiment by observing the behaviour of an electron spin echo after cross-polarisation (CP) as a function of the RF frequency.
In this contribution we follow up these initial ideas and examine the possibility to utilise cross-polarisation as a preparation sequence to detect an ENDOR spectrum. In contrast to previous reports, we combine here the CP irradiation with immediate RF and MW read-out detection, similarly to a Davies ENDOR experiment where the preparation π-pulse is substituted with CP. In a first step we experimentally test the CP matching conditions for the specific sample (1H-BDPA) within our experimental settings (94 GHz, W-band) and compare them with theoretical predictions. Subsequently, we record so-called CP-edited ENDOR (CP-ENDOR) spectra and discuss them in comparison to Davies ENDOR. We find that CP-edited ENDOR provides signals on the order and even much larger than the Davies sequence. The intrinsic asymmetric intensity of the two hyperfine transitions permits extraction of relative signs of the two hyperfine couplings present in a three-spin {e − n − n} systems. Before presenting these experimental results we discuss the theory necessary to explain the shapes of the CP-edited ENDOR spectra and to simulate spectra that resemble the experimental results by considering simple orientationally disordered three-spin systems.
Theoretical description of CP-edited ENDOR
The spin Hamiltonian
In the following we present a theoretical framework for the description of the main features of the CP-ENDOR experiments by following the spin evolution of two-spin and three-spin systems. These simple systems are composed of one electron (S) coupled to one or two nuclei (I1 and I2), experiencing the same MW and RF irradiation schemes as in the real experiments.
The CP-ENDOR experiment (Figure (a)) can be divided into three distinct time periods. At the first stage, starting after a π/2 MW pulse a MW spin-lock field is applied to the electrons concurrent with an RF field applied to the nuclei. The duration of these irradiations is tCP and the values of the MW and RF field intensities and off resonance can be adjusted to induce a CP process between the electron and the nuclei. This stage is followed by an irradiationless delay of duration τd, where all spin coherences are expected to decay to zero. During the final stage an ENDOR pulse sequence is applied, composed of an RF πRF-pulse followed by a MW echo-detection sequence. The signal is acquired by monitoring the intensity of the EPR echo as function of the RF frequency of the πRF-pulse (see Figure (a)). Echoes can also be detected immediately following the end of the first stage by applying a MW πMW-pulse after a τd delay that in this case is set to be short, and is termed an eNCP experiment (see Figure (b)).
Figure 1. Pulse sequences of pulsed ENDOR experiments employed in this work. (a) CP-ENDOR, (b) eNCP, (c) Davies ENDOR, (d) TRIPLE-ENDOR. In (a,c,d), the first part of the sequence (preparation) creates a polarisation pattern in the nuclear spin manifolds that is read out by the ENDOR RF pulse and detected by the subsequent MW spin echo. The second selective RF pulse in both CP-ENDOR (a) and TRIPLE (d) at a fixed frequency creates an asymmetry in the nuclear sublevel populations, which results in an asymmetric ENDOR spectrum. (e) Simulated eNCP spectrum for a single spin packet for the case A> ω1eω1n; the CP conditions are marked according to Equation (10). (f) CP-ENDOR spectra with Δωn fulfilling the [1-4] CP condition. (g) CP-ENDOR spectra with Δωn not fulfilling any of the CP conditions. (h) Davies ENDOR. In (f), (g), (h) the solid line represents the spectrum after single repeat of a pulse sequence, dashed line signal after second repeat of the pulse sequence. The intensities of the peaks are marked according to Table . Simulation parameters A > ω1e ω1n; T1e Tr T1n.
![Figure 1. Pulse sequences of pulsed ENDOR experiments employed in this work. (a) CP-ENDOR, (b) eNCP, (c) Davies ENDOR, (d) TRIPLE-ENDOR. In (a,c,d), the first part of the sequence (preparation) creates a polarisation pattern in the nuclear spin manifolds that is read out by the ENDOR RF pulse and detected by the subsequent MW spin echo. The second selective RF pulse in both CP-ENDOR (a) and TRIPLE (d) at a fixed frequency creates an asymmetry in the nuclear sublevel populations, which results in an asymmetric ENDOR spectrum. (e) Simulated eNCP spectrum for a single spin packet for the case A> ω1eω1n; the CP conditions are marked according to Equation (10). (f) CP-ENDOR spectra with Δωn fulfilling the [1-4] CP condition. (g) CP-ENDOR spectra with Δωn not fulfilling any of the CP conditions. (h) Davies ENDOR. In (f), (g), (h) the solid line represents the spectrum after single repeat of a pulse sequence, dashed line signal after second repeat of the pulse sequence. The intensities of the peaks are marked according to Table 1. Simulation parameters A > ω1e ω1n; T1e Tr T1n.](/cms/asset/0117a05a-5caa-475c-8eca-a8d84a53fabb/tmph_a_816795_f0001_oc.jpg)
In the following paragraph, we present the form of the spin Hamiltonian during the first stage of the experiment and derive CP matching conditions (CP conditions). The spin Hamiltonian during the first stage for a three-spin {e − n1 − n2} system in the doubly (MW and RF) rotating frame is given by [Citation26]:
(1) Here the electron and nuclear off-resonance values are Δωe and Δωn and the MW and RF amplitudes are ω1e and ω1n, respectively. The isotropic and anisotropic secular hyperfine coupling constants are combined in the coefficients A1 and A2 and the pseudo-secular hyperfine terms are neglected, for simplicity.
The CP conditions
First we derive the HH CP conditions for a two-spin {e − n} system (A2 = 0), during the first stage of the experiment. The CP conditions are derived in the limit of a weak RF irradiation namely: ω1n ≪ A. This is also the case in most ENDOR experiments, where in general we are dealing with nuclei with hyperfine couplings in the MHz range, with experimentally obtainable RF field strengths being in the kHz range.
First we rewrite the two-spin Hamiltonian using the fictitious spin-half operators defined in the spin state manifold [Citation28]:
(2) With these definitions the Hamiltonian gets the form:
(3)
In order to derive the CP conditions, we transfer the Hamiltonian to a tilted frame in which the terms corresponding to the αn (2-4) and βn (1-3) electron transitions are diagonalised. This transformation U− 1HU is defined by two unitary transformations, according to U = U1 − 3yUy2 − 4:
(4) with tilt angles defined by:
(5)
After the transformation the tilted frame Hamiltonian becomes:
(6) with positive effective field components
(7)
In the tilted frame, the basis set of spin states and their corresponding diagonal elements in HT become:
(8)
Clearly, the basis set of spin states in the tilted frame is different with respect to the laboratory frame but we keep the notation |1> etc. to simplify the notation of the fictitious spin-half operators. The off diagonal elements of the tilted frame Hamiltonian are all proportional to the RF field intensity ω1n and can be represented in operational form:
(9)
These off diagonal elements can be ignored until their magnitudes become on the order of the difference between their corresponding diagonal elements. When that is the case they become the source of a possible CP process. Four CP conditions can be distinguished that correspond to energy degeneracies of the form Ei = Ej with i < j = 1, .., 4. These [i − j] CP conditions together with their off-diagonal matrix elements are:
(10)
The efficiency of the polarisation transfer between the electron and the nucleus at each CP condition is determined by the magnitudes of these off diagonal elements. These conditions are similar to the ones derived by Weis et al. [Citation26], based on another formalism. The above CP conditions for the nuclei with relatively small hyperfine couplings, with A ≪ ω1e as in the case of matrix nuclei, become for small MW off-resonance values, Δωe ⩽ A:
(11) where ϵ is small and of the order of A/ω1e. The first two conditions show large off diagonal elements that are, however, not effective in influencing the CP-ENDOR powder spectra, as will be discussed below. The latter conditions have weak off diagonal elements that can become effective for sufficiently long CP times.
In those parts of the experiments, where no MW irradiation is applied, there is no need for a frame transformation and the spin evolution is determined by the Hamiltonian:
(12)
Using the spin density operator formalism, the spin evolution during the CP-ENDOR experiment can now be derived for each CP condition as a function of the frequency of the RF inversion pulse, assuming a MW frequency selective ENDOR signal detection.
Density matrix evolution during CP-edited ENDOR experiments
To simulate CP-ENDOR and eNCP spectra as function of Δωn we follow the evolution of the spin density matrix during the different time periods of the experiments. These simulations are performed by solving the density matrix rate equation in Liouville space [Citation29]:
(13) where
is the vector composed of all elements of the density matrix at time t.
is the superoperator form of the Hamiltonian H in Liouville space. The relaxation superoperator
contains all relaxation times of the system, including electron and nuclear spin-lattice relaxation times T1e, 1n and spin–spin relaxation times T2e, 2n, as well as an electron rotating frame relaxation time T1ρe during the CP MW irradiation. The general form of
, making Equation (13) a homogeneous rate equation, is defined in Appendix 2. The appropriate values of all relaxation times must be chosen for each stage of the experiment according to their experimental values.
In this paragraph, we however explicitly discuss the main time-dependent features of the density matrix in Hilbert space during the first CP stage of an experiment on a two-spin {e − n} system. In particular, we derive expressions for the diagonal elements of the density matrix and from them expected signals. As an example, we will mainly present results for CP-ENDOR experiments where the [1-4] CP condition is matched.
During the CP stage the initial density matrix ρ(0) becomes, just after the π/2MW pulse, equal to ρ(0+), which in the tilted frame gets the general form:
(14) where we ignored the initial nuclear magnetisation. The actual values of the operator coefficients R depend on the frequency and the intensity of the initial pulse and on the MW off-resonance value Δωe and hyperfine interaction A. For example, when the initial (π/2)MW pulse and the subsequent lock field are applied at the frequency of the (1-3) or (2-4) transitions and in the limit of ω1e ≪ |A| the coefficients become R = Rαz = Rzβ and R = Rαz = −Rzβ, respectively.
When none of the CP conditions are fulfilled, the coefficients Rα, βz, ignoring for the moment T1ρe relaxation, remain different from zero and at the end of the spin-lock stage we obtain:
(15) where we used the linear dependence between the Ii − jz operators. When a [i − j] CP condition is fulfilled the density matrix coefficients become time dependent due to the oscillation of the coefficients of Ii − jz and Ii − j(x, y) caused by the corresponding off diagonal matrix element. After a sufficiently long time tCP these oscillating coefficients decay to zero because of T2e relaxation and the diagonal elements corresponding to the spin states |i > and |j > become equal, causing the coefficient of Ii − jz to become zero. For example, for the [i − j] = [1 − 4] CP condition the density matrix in Equation (15) at the end of sufficiently long τd period reaches the form:
(16)
This result represents the spin system at the end of the first stage of the experiment. Similar expressions can be derived for the other three CP conditions.
Before continuing the evaluation of the spin system, we must transform ρT(t) back to the doubly rotating frame by the unitary transformation:ρ(tCP) = UρT(tCP)U− 1. We obtain:
(17)
which then contains both populations and coherences. The latter can be echo detected in an eNCP experiment, resulting in signals proportional to the coefficients of I1 − 3x or I2 − 4x, depending on the detecting MW frequency. The time evolution of the density matrix elements by fulfilling the matching condition [1-4] is illustrated in Figure .
Figure 3. Simulated eNCP (a) and CP-ENDOR (b) spectra for the {e–n1–n2} spin system with |A1| = 5 MHz; |A2| = 2 MHz; ω1e/2π = 2 MHz; solid and dashed traces in (b) correspond to A1 and A2 having opposite and same signs respectively. The arrow in (a) marks the Δωn value that was chosen for calculation of the spectra in (b).
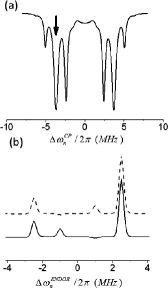
Figure 2. Evolution of the diagonal elements of the density matrix during the CP-ENDOR experiment by fulfilling CP condition [1-4] as described in the text. Density matrix elements at the end of the CP pulse are given by Equations (16) and (17) respectively.
![Figure 2. Evolution of the diagonal elements of the density matrix during the CP-ENDOR experiment by fulfilling CP condition [1-4] as described in the text. Density matrix elements at the end of the CP pulse are given by Equations (16) and (17) respectively.](/cms/asset/41d945c1-6a12-4ce2-a945-d7cdd04e7779/tmph_a_816795_f0002_oc.jpg)
eNCP spectra
A typical result of an eNCP spectrum as a function of Δωn is shown in Figure (e) for a two-spin system with parameters given in the figure caption. In this case ω1e ≪ A and only the (1-3) transition is initially spin-locked. As a result ρT(0+) = R(I1 − 3z + Iz2 − 4) and only two CP conditions [1-4] and [2-3] can actively result in a depletion of the electron polarisation. If the initial spin lock is applied to the (2–4) EPR transition, the polarisation depletion will be observed for the other two CP conditions [1–2] and [3–4] (not shown).
The eNCP spectra of three-spin {e − n1 − n2} systems are much more complicated because of 16 potential CP conditions (see Appendix 1). An example of such a spectrum is shown in Figure (a). Note that similar to the two-spin case, not all 16 CP conditions result in pronounced echo reductions in the eNCP spectrum. An important observation is that similar to ENDOR and EPR spectra, eNCP spectroscopy is not sensitive to the absolute sign of the hyperfine couplings.
CP-ENDOR spectra
In the course of the CP-ENDOR experiment, the coherences in ρ(tCP) decay to zero during the second stage of the experiment, as long as the length of this stage τd is longer than T2e. The rotating frame density matrix in Equation (17) takes the form of:
(18)
Ignoring any spin-lattice relaxation ρ(tCP + τd) defines the initial state of the system at the start of the last stage, just before the ENDOR detection pulse sequence:
Similar equations for the density matrix can also be derived for experiments at the [2-3], [1-2] and [3-4] CP conditions.
The ENDOR echo intensity depends on the coefficients of ρ(tCP + τd) and the frequency offset as well as the frequency of the pulses in the ENDOR sequence. When the πRF pulse inverts either one of the nuclear transitions (1 − 2) or (3 − 4), this read-out sequence results in a change of the EPR echo signal, which is customarily detected in a selective fashion on one of the EPR transitions (1 − 3) or (2 − 4). The echo intensities can be calculated by realising that their magnitude is proportional to the coefficient of I1 − 3z or I2 − 4z in the density matrix just after the πRF-pulse. For example, for a selective detection of the (1-3) EPR transition and a πRF pulse on the nuclear (1-2) transition, the echo signal can be obtained by evaluating:
(19)
where represents the πRF pulse and (U1 − 2π)− 1Iz1 − 3(U1 − 2π) = Iz2 − 3. Similarly a πRF pulse on the (3-4) transition results in:
(20) when we use that (U3 − 4π)− 1Iz1 − 3(U3 − 4π) = Iz1 − 4. Thus, when ρ(tCP + τd) is known we can calculate the (1-2) and (3-4) CP-ENDOR signals by determining the coefficients of the I1 − 4z and I2 − 3z operators. Again assuming that ω1e ≪ A the intensities of the two ENDOR lines corresponding to the (1-2) and (3-4) ENDOR transitions for four different CP-ENDOR experiments with MW irradiation on resonance with (1-3) or (2-4) EPR transitions and matching of the [1-4] or [2-3] CP conditions are given in Table . The specific example for the evolution of the diagonal density matrix elements during the CP ENDOR experiment for the spin lock applied to the (1–3) EPR transitions and matching of the [1–4] CP condition followed by selective ENDOR detection of the (1–2) and (3–4) nuclear transitions is illustrated in Figure 2.
Table 1. Signal intensities in CP-ENDOR spectra for the {e–n} spin system. Similar intensities are found for [1-2] and [3-4] CP conditions.
In addition, the CP-ENDOR line intensities when none of the CP conditions are fulfilled are also given in the two last rows of Table . Table 1 thus summarises all possible outcomes of the CP ENDOR pulse sequence on the spin system. It does not exhaust all possible combinations of excited EPR with matched CP conditions, but no new kinds of outcomes are predicted for other combinations. From this list of intensities it follows that parts of the CP-ENDOR spectra are asymmetric and parts are symmetric with line intensities equal to half of the intensities obtained in the Davies ENDOR experiments.
An example of an asymmetric CP-ENDOR spectrum corresponding to a MW irradiation on resonance with the (1-3) EPR transition and matching of the [1-4] CP condition is shown in Figure (f). The analogous CP-ENDOR spectrum when none of the CP conditions is matched is shown in Figure (g) and regular Davies ENDOR spectrum is presented in Figure (h) for comparison. All three spectra were calculated for the identical conditions.
An important observation is that for two-spin systems, similar to the eNCP spectra discussed above, the CP-ENDOR spectra are insensitive to a change of the sign of the hyperfine coupling. Thus, the asymmetry reflects only the choice of the value of the parameters Δωe, Δωn and ω1e.
CP-ENDOR on a three-spin system
Similar calculations for three-spin systems can also be made, but the expressions for the density matrix become rather cumbersome. Thus, because of this complexity we restrict ourselves to numerical calculation and use the above-discussed two-spin derivations as a guideline for the interpretation of the CP-ENDOR data. Typical simulated eNCP and CP- ENDOR spectra for a three-spin system {e − n1 − n2} with A1 = |5|MHz, A2 = |2|MHz and ω1e/2π = 2MHz are shown in Figure (a) and (b), respectively. The eNCP spectrum shows clear polarisation depletions at six of the 16 possible CP conditions. The ENDOR spectrum, which is calculated by setting Δωn equal to the position of one of the strong eNCP lines, is asymmetric, similar to the spectra of two-spin systems. Simultaneous change of both signs of the hyperfine couplings did not modify the CP-ENDOR spectrum, while a change in the relative signs did affect it. This is illustrated in Figure (b) where the top CP-ENDOR spectrum was simulated with both hyperfine couplings having a positive sign, while the bottom spectrum was simulated with the two hyperfine couplings having opposite signs. As can be clearly seen, the asymmetry of the inner lines is inverted, while the outer lines stay unchanged. The source of this sign dependence could have been derived by taking into account which of the CP transitions, summarised in Appendix 1, for each of the two cases, are chosen during the first CP stage of the experiment. This was not pursued. This example, however, illustrates that the CP-ENDOR spectra are sensitive to relative signs of simultaneously present hyperfine interactions.
In the next section, we will present experimental eNCP and CP-ENDOR experiments and compare those with spectra that are simulated considering three-spin {e − n1 − n2} systems. We should of course not expect that these calculated spectra will have exactly the same shape as the experimental spectra, they are rather used to illustrate the main features observed in the experiment.
Simulations
Simulations of the spin dynamics during the CP-ENDOR experiments on the two-spin and three-spin systems were performed with the help of a home written MATLAB© (Mathworks) based computer programme. During these simulations, the time dependences of the elements of the spin density matrix ρ(t) are evaluated taking into account all experimental parameters of the MW and RF pulses and the relaxation rates, excluding the ENDOR echo formation. Electron eNCP spectra and CP-ENDOR spectra as a function of the RF frequency were both simulated by calculating the relevant expectation values. When the pulse sequences are applied consecutively, a recovery delay time tr was introduced between the sequences to allow for electron and nuclear T1 relaxation.
In the following section, experimental data will be compared with numerical results obtained from simulations performed for three-spin powder samples. These powder simulations are the accumulated results of spin systems with varying off-resonance values Δωe to account for the g-tensor strain of the almost isotropic g-tensor of BDPA, and averaging over all possible orientations of two anisotropic hyperfine tensors A1 and A2. All other parameters, namely the relaxation times T1e, 1n, T2e, 2n, T1ρe, the MW and RF field parameters Δωe, ω1e,Δωn, ω1n were kept constant during the powder simulations.
Experimental
Experiments were performed on a commercial 94 GHz (W-band) spectrometer (Bruker Elexsys E 680) with 400 mW MW output power (Bruker Power Upgrade 2) that generates MW fields up to about 7–10 MHz into a TE011 cavity. MW phase switching for electron spin locking was accomplished by a MW channel with variable phase and MW amplitudes (Bruker MPFU unit).
For RF irradiation, we used two independent channels and an ENDOR probe head (Bruker TeraFlex), which allows for 1H π pulses on the order of 25–30 μs at a maximum RF power of about 250 W (Amplifier Research). The length of the CP-RF pulse was restricted by the duty cycle (≤1%) and heating effects. The employed maximal values were optimised for a maximal ENDOR effect before heating would lead to instability of the baseline and echo. Thus, they were adjusted correspondingly at each temperature. As a standard sample, we employed 1% protonated bis-diphenylene-phenyl-allyl (BDPA) in polystyrene in powder form. Samples were loaded under air in 0.7 mm OD capillary tubes.
Results and discussion
EPR and Davies ENDOR of 1H-BDPA
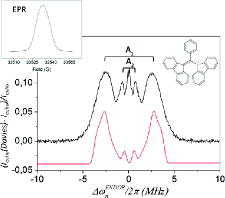
In order to examine the performance of the new ENDOR sequence, a characterisation of the sample at our experimental conditions was required. BDPA is a stable organic radical with a small g-anisotropy (Δgx-z ≈ 0.0005) [Citation30]. The spin density distribution is alternating, leading to two distinct, almost isotropic hyperfine couplings. The conventional EPR and Davies ENDOR spectra of the 1H-BDPA at W-band are reported in Figure . The EPR spectrum at 3 Tesla consists of an inhomogeneously broadened line of about 13 Gauss width (Figure inset). The ENDOR spectrum reveals two distinct hyperfine couplings A1 and A2 with transitions centered at offsets from the nuclear Larmor frequency of ± 0.6 MHz and ± 2.5 MHz, respectively. At room temperature, T1e is around 100 μs whereas at 10K amounts to 100 ms. T2e was found to be about 1 μs at both temperatures.
Figure 4. Davies-ENDOR and EPR (inset) spectra of 1H-BDPA in polystyrene at W-band. The schematic structure of the radical is also shown. Pulse lengths in EPR detection were 14 ns for π/2 and 28 ns for π pulses in both experiments. The preparation pulse in Davies was 200 ns, the RF pulse was 28 μs, 1 shot/point, 32 scans, random RF acquisition, Tr = 10 ms, T = 298 K. Simulation performed with the developed programme and hyperfine tensors: (absolute values in MHz) A1x = 7.7, A1y = 5.3 and A1z = 2.0; A2(x,y) = 1, A2z = 1.2. The matrix line observed in the experimental spectrum is not simulated for consistency with the following simulations of CP-ENDOR spectra.
eNCP spectra
Detection of the electron spin signal just after the simultaneous MW and RF irradiation during the tCP interval as a function of the RF offset frequency can be employed to experimentally map out the matching conditions [Citation25]. At our experimental conditions in W-band, the MW excitation is always selective, i.e. the MW irradiation bandwidth is much smaller than the width of the EPR line. Experimental eNCP spectra of our 1H-BDPA sample are shown in Figure (a).
Figure 5. (a) Experimental eNCP spectra of 1H-BDPA for different ω1e values as indicated on the figure. Intensities reflect the percentage decrease in echo intensity for a normalised echo (y-scales are comparable). MW power was kept constant during the π/2 and spin-lock pulses. RF field strength: 18 kHz; tCP is 50 μs (solid black lines) and 5 μs (red dotted lines); τd = 1 μs; RT. EPR excitation was set to the centre of the EPR line. (b) Simulated eNCP spectra for tCP 50 μs (solid black lines) and 5 μs (red dotted lines). The former are split into individual contributions for powder of {e–n1–n2} spin system with hyperfine tensors having opposite signs: |A1| = [7.7 5.3 2.0] MHz and |A2| = [1.0 1.0 1.2] MHz (magenta traces) and {e–n} spin system with |A| = [50 50 100] kHz (blue traces). Relaxation parameters used in simulations: T1e = 0.1 ms; T2e = 1 μs; T2n, T1n and T1ρ were set to infinity. The relative scaling of the {e–n1–n2} and {e–n} spectra was done independently until resembled the experimental spectrum and was kept the same for all three calculated data-sets. A peak at Δωn = 0 that appeared with varying intensities in the simulations of the {e–n} system was removed.
![Figure 5. (a) Experimental eNCP spectra of 1H-BDPA for different ω1e values as indicated on the figure. Intensities reflect the percentage decrease in echo intensity for a normalised echo (y-scales are comparable). MW power was kept constant during the π/2 and spin-lock pulses. RF field strength: 18 kHz; tCP is 50 μs (solid black lines) and 5 μs (red dotted lines); τd = 1 μs; RT. EPR excitation was set to the centre of the EPR line. (b) Simulated eNCP spectra for tCP 50 μs (solid black lines) and 5 μs (red dotted lines). The former are split into individual contributions for powder of {e–n1–n2} spin system with hyperfine tensors having opposite signs: |A1| = [7.7 5.3 2.0] MHz and |A2| = [1.0 1.0 1.2] MHz (magenta traces) and {e–n} spin system with |A| = [50 50 100] kHz (blue traces). Relaxation parameters used in simulations: T1e = 0.1 ms; T2e = 1 μs; T2n, T1n and T1ρ were set to infinity. The relative scaling of the {e–n1–n2} and {e–n} spectra was done independently until resembled the experimental spectrum and was kept the same for all three calculated data-sets. A peak at Δωn = 0 that appeared with varying intensities in the simulations of the {e–n} system was removed.](/cms/asset/497926d9-b570-44cf-ab6d-0aa2b4e48271/tmph_a_816795_f0005_oc.jpg)
eNCP spectra as a function of Δωn/2π, as defined with respect to the proton Larmor frequency of 142.6 MHz, were recorded for three different MW field strengths. Their line intensities become substantially more pronounced with increasing length of the tCP time interval from 5 μs to 50 μs (Figure (a), red vs. black lines, respectively). The overall appearance of these spectra for short tCP time is consistent with previously reported spectra at an external field of 5 Tesla [Citation26]. The two most prominent peaks of the spectra acquired with MW intensities ω1e/2π equal to 1.25 MHz and 2.5 MHz appear at Δωn = ±ω1e. They correspond to the [1-4] and [2-3] CP conditions given in Equation (11) and, therefore, originate from the nuclei with very small hyperfine couplings. These strong peaks were also observed in perdeuterated BDPA (where all 1H of the radical were replaced by 2H) [Citation26], which confirms their assignment to the signal originating from matrix protons. In addition to these peaks, we observe broader peaks that span a wide range of frequencies. It is important to note that the maxima of these peaks do not correlate with the line positions in a standard ENDOR spectrum of BPDA. They must, however, correspond to CP conditions of the unpaired electron coupled to the two types of 1H nuclei with stronger hyperfine couplings that originate from the protons residing on the BDPA radical.
To compare these results with simulated eNCP spectra, we performed two types of calculations. To account for the contribution of the matrix protons to the eNCP spectra, we calculated spectra considering a two-spin {e − n} system with an anisotropic hyperfine interaction tensor with principal values A = [50 50 100] kHz that fulfils the condition A ω1e for all three MW amplitudes employed in the experiments. To account for the effects of the g-strain of the almost isotropic g-tensor, Δωe was varied from –6 to 6 MHz in steps of 0.5 MHz. The results are shown in blue in Figure (b). During these simulations, the spectral lines around Δωn ≈ 0 were removed. These lines are a result of the [1-2] and [3-4] CP conditions in Equation (11). For the signal appearing at Δωn ≈ 0 large off diagonal matrix elements cause fast polarisation exchange processes that in powder samples seem to result in destructive interference, which is not the case for the single tensor simulated here.
Broad features in the experimental eNCP spectra were simulated by considering a three-spin {e − n1 − n2} system with hyperfine tensor components A1 = [7.7, 5.3, 2.0] MHz and A2 = [1, 1, 1.2] MHz (Figure (b), magenta traces). With the same hyperfine tensors A1 and A2 we were able to reproduce the features of the strongly coupled protons in the Davies ENDOR spectrum (Figure red trace).
The same Δωe distribution to account for the g-strain was considered as above. In this system, many CP conditions are expected and it is hard to predict a priori the shape of the simulated eNCP spectra. The results of these simulations for the three MW amplitudes are shown in Figure (b). The sum of the two simulated contributions is shown in Figure (b) in black and, when compared with the experimental spectra in Figure (a), shows a reasonable resemblance with the experiment. We observed that the relative intensity of the two pronounced, narrow peaks at Δωn = ±ω1e in these eNCP spectra gets reduced with increasing ω1e as compared to the intensity of the broader features. This correlates to the predicted reduction of the off-resonance matrix elements inducing the CP process in Equation (11) with increasing ω1e.
All lines in the eNCP spectra appear much stronger when acquired with tCP = 50 μs as compared to tCP = 5 μs. This trend is also well reproduced in the simulated spectra. The result is a combination of the cross-polarisation exchange rates, determined by matching of the CP conditions, off diagonal elements given by Equation (10) and the T2 relaxation rates.
CP-ENDOR spectra
In Figure , we show representative CP-ENDOR spectra recorded by setting the CP-RF frequency at different positions of the eNCP spectrum corresponding to the sharp and broad minima. Initially, the MW field strength was set at ω1e/2π = 1.25 MHz. These CP-ENDOR spectra were recorded by sweeping the frequency of the RF read-out pulse. All four CP-ENDOR spectra show an overall line shape that is reminiscent of the standard Davies ENDOR spectrum but differs by an asymmetric intensity of the two hyperfine transitions. Comparison of spectra in (a) and (b) indicates that the extent of the asymmetry depends on the position of the RF frequency during the CP stage of the experiment and that it is more pronounced in the spectra acquired with |Δωn| = 3.4 MHz (Figure (a)) as compared to spectra acquired with |Δωn| = 1.25 MHz (Figure (b)). In the spectra shown in Figure (a), the asymmetry (defined here as the ratio of the intensities of the two transitions belonging to the same coupling) amounts to a factor 2-3 for protons with A ∼ 5 MHz coupling. The appearance of asymmetric CP-ENDOR spectra is well consistent with the general theoretical predictions discussed in the ‘Theory’ section. As expected, when no CP occurs during the tCP the resulting CP-ENDOR spectrum is symmetric (Figure (c), black line).
Figure 6. Experimental CP-ENDOR spectra of solid 1H-BDPA at RT (left) and corresponding simulations (right). Top: eNCP spectrum for ω1e/2π = 1.25 MHz showing the selected CP-RF offsets. Bottom: CP-ENDOR spectra recorded at the corresponding CP-RF offsets: Black and red curves are for pumping at negative and positive Δωn (CP), respectively. Spectrum in (c) is the reference (black) without CP-RF irradiation as compared to (a) in red. Exp. parameters: π/2MW: 200 ns; tCP = 50 μs; τd = 1 μs; τ = 500 ns; 1 shot/point; repetition time Tr = 10 ms; random acquisition mode; RT. CP-ENDOR spectra were simulated using the experimental delays and irradiation strength values for e–n–n spin system with hyperfine tensors having opposite signs: |A1| = [7.7 5.3 2] MHz and |A2| = [1 1 1.2] MHz in (a) dashed and solid lines correspond to the two tensors having same and opposite signs of the hyperfine coefficients, respectively. Relaxation parameters used in simulations are given in the main text.
![Figure 6. Experimental CP-ENDOR spectra of solid 1H-BDPA at RT (left) and corresponding simulations (right). Top: eNCP spectrum for ω1e/2π = 1.25 MHz showing the selected CP-RF offsets. Bottom: CP-ENDOR spectra recorded at the corresponding CP-RF offsets: Black and red curves are for pumping at negative and positive Δωn (CP), respectively. Spectrum in (c) is the reference (black) without CP-RF irradiation as compared to (a) in red. Exp. parameters: π/2MW: 200 ns; tCP = 50 μs; τd = 1 μs; τ = 500 ns; 1 shot/point; repetition time Tr = 10 ms; random acquisition mode; RT. CP-ENDOR spectra were simulated using the experimental delays and irradiation strength values for e–n–n spin system with hyperfine tensors having opposite signs: |A1| = [7.7 5.3 2] MHz and |A2| = [1 1 1.2] MHz in (a) dashed and solid lines correspond to the two tensors having same and opposite signs of the hyperfine coefficients, respectively. Relaxation parameters used in simulations are given in the main text.](/cms/asset/94cf5834-1246-409e-ad38-c4d1e773b2a9/tmph_a_816795_f0006_oc.jpg)
The different asymmetries observed in the spectra in Figure suggest that different CP conditions can result in different CP-ENDOR spectra. A point we have to emphasise is that when the |Δωn| is set to coincide with strong matrix peaks at ±1.25 MHz in the eNCP spectrum, the features of the CP-ENDOR spectra do not originate from the matrix protons, which contribute only to the small peak around Δωn = 0, but from the nuclei with large hyperfine tensor elements. The amount of asymmetry is a direct consequence of the matching of the CP conditions that manifest themselves as broad features in the eNCP spectrum. These indeed have a non-zero intensity at |Δωn| = ±1.25 MHz as can be seen from the simulations shown in Figure (b) (top, magenta traces).
In the next set of experiments, we examined the influence of the MW field strength ω1e on the CP-ENDOR spectra. In Figure , we display experimental CP-ENDOR spectra recorded at two additional MW field strength values (ω1e/2π = 2.5 MHz, 5 MHz). Here again the Δωn values were chosen according to the positions of the minima in the eNCP spectra at the top of the figure. The CP-ENDOR spectra show overall asymmetric line shapes, similar to the results in Figure but with decreasing CP-ENDOR effect. For ω1e/2π = 2.5 MHz, the presence of the asymmetry in the CP-ENDOR spectra did not depend on the choice of the CP condition. In addition, we observe that the intensity of the lines close to the centre of the CP-ENDOR spectra is significantly reduced. This is a well-known effect in Davies ENDOR [4] and is a direct consequence of the requirement for selective EPR excitation and detection, which is similar in CP-ENDOR and Davies ENDOR experiments. Comparison of the CP-ENDOR spectra with CP-RF on and off (Figure (d) and (e), respectively) reveals the underlying ENDOR effect not caused by the CP effect.
Figure 7. CP-ENDOR spectra of solid 1H-BDPA as a function of MW field strength ω1e and the CP-RF offset Δωn. Top: eNCP spectrum at ω1e /2π = 2.5 MHz showing the selected RF-CP offset used in the CP-ENDOR spectra (a) and (b). Bottom: eNCP spectrum at ω1e/2π = 5 MHz showing the selected RF-CP offset used in the CP-ENDOR spectra (c) and (d). Black and red curves are for pumping at positive and negative Δωn, respectively. (e) CP-ENDOR spectrum at ω1e/2π = 5 MHz with CP-RF off, for comparison. EPR pulse lengths were adjusted for the employed ω1e, i.e. π/2: 100 ns (ω1e /2π = 2.5 MHz) and π/2: 50 ns (ω1e/2π = 5 MHz); tCP = 50 μs; τd = 1 μs; τ = 500 ns; 1 shot/point; Tr = 5 ms; 16 scans; random acquisition; RT. CP-ENDOR spectra were simulated using the experimental delays and irradiation strength values for e–n–n spin system with hyperfine tensors having opposite signs: |A1| = [7.7 5.3 2] MHz and |A2| = [1 1 1.2] MHz. Relaxation parameters used in simulations are given in the main text.
![Figure 7. CP-ENDOR spectra of solid 1H-BDPA as a function of MW field strength ω1e and the CP-RF offset Δωn. Top: eNCP spectrum at ω1e /2π = 2.5 MHz showing the selected RF-CP offset used in the CP-ENDOR spectra (a) and (b). Bottom: eNCP spectrum at ω1e/2π = 5 MHz showing the selected RF-CP offset used in the CP-ENDOR spectra (c) and (d). Black and red curves are for pumping at positive and negative Δωn, respectively. (e) CP-ENDOR spectrum at ω1e/2π = 5 MHz with CP-RF off, for comparison. EPR pulse lengths were adjusted for the employed ω1e, i.e. π/2: 100 ns (ω1e /2π = 2.5 MHz) and π/2: 50 ns (ω1e/2π = 5 MHz); tCP = 50 μs; τd = 1 μs; τ = 500 ns; 1 shot/point; Tr = 5 ms; 16 scans; random acquisition; RT. CP-ENDOR spectra were simulated using the experimental delays and irradiation strength values for e–n–n spin system with hyperfine tensors having opposite signs: |A1| = [7.7 5.3 2] MHz and |A2| = [1 1 1.2] MHz. Relaxation parameters used in simulations are given in the main text.](/cms/asset/118820d1-ad11-42e3-aa4b-4254821e4a74/tmph_a_816795_f0007_oc.jpg)
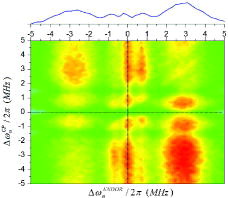
For practical purposes, we have recorded the CP-ENDOR spectrum at ω1e/2π = 2.5 MHz, in a 2D fashion, i.e. by varying the CP-RF offset over the all hyperfine range as a second dimension. The result is illustrated in Appendix 3, Figure . The spectrum shows that the intensities of the ENDOR peaks vary consistently as predicted by Figure that this type of experiment can be employed to search for optimal matching conditions.
Figure 8. CP, Davies and TRIPLE-ENDOR spectra (black, red and blue, respectively) of solid 1H-BDPA at T = 10 K as a function of the number of shots per point (SPP) and number of scans. MW power was kept constant to ω1e/2π = 2.5 MHz in all sequences, pulse lengths were adjusted accordingly. All spectra were recorded with random acquisition modus. (a) Single scan, one shot/ point; (b) single scan, 25 shots/point; (c) 25 scans, 1 shot/point; (d) comparison with TRIPLE-ENDOR under same experimental conditions but replacing the MW π/2 with a π pulse and switching off the MW spin-lock pulse. Other parameters were: CP-RF offset Δωn/2π = −2.2 MHz, tCP = 200 μs; Tr = 100 ms. The asterisk represents a blind spot created by the CP-RF pulse.
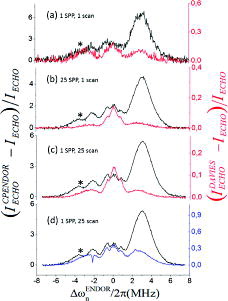
Figure 9. 2D-CPENDOR spectrum (sweep of RF for CP and π−ENDOR pulse) of solid 1H-BDPA at T = 70 K. MW power was ω1e/2π = 2.5 MHz, tCP = 200 μs. The ENDOR-RF (x-axis) was swept using random acquisition modus, 1 shot/point, recording 64 points with a repetition time Tr = 100 ms. The CP-RF (y-axis) was swept sequentially pumping RF at 64 different values in a range of 10 MHz. Sixteen scans of the whole 2D spectrum have been accumulated. On the top, the profile plot is obtained by projecting the intensities of the spectra, onto the x–z plane. The sum of the CP-ENDOR spectra at different CP offsets generates an overall line shape that is reminiscent of the standard Davies ENDOR spectrum reported in Figure .
The most peculiar feature of the asymmetric CP-ENDOR spectrum is that the CP-ENDOR frequency profile reveals an asymmetry that is opposite for protons with large and small hyperfine couplings. This is most pronounced in the spectra acquired with ω1e/2π = 1.25 MHz and is also visible in the spectra acquired with ω1e/2π = 2.5 MHz. In the ‘Theory’ section, we discussed that the relative asymmetries in such three-spin system are only sensitive to changes in the relative signs of the A1 and A2 hyperfine couplings. The two observed 1H-BDPA couplings have different signs, as is well-known from TRIPLE-ENDOR experiments (see also below and Figure (d)).
In an effort to understand the outcome of the experiments presented in Figures and , we have simulated CP-ENDOR spectra considering three-spin {e − n1 − n2} systems with the same hyperfine and g-tensor parameters used for the eNCP simulations (Figures and right columns). In all cases the experimental parameters, Δωn, tCP,τd, ω1e and ω1n, were chosen the same as in the corresponding experiments while Δωe was varied in a similar manner as in the simulations of the eNCP spectra. In addition, we set the relaxation parameters T1e, T1ρ, T2e, T2n and T1n equal to 10 ms, 20 μs, 1 μs, 3 μs and infinity, respectively. The effect of the matrix protons was not taken into account, therefore, a line around Δωn = 0 is not reproduced in the simulations. The asymmetric response, for both types of hyperfine couplings, observed in all experimental CP-ENDOR spectra is qualitatively reproduced in the simulations. The assignment of the relative signs of the two sets of hyperfine couplings is, by comparison to simulations, straightforward. When the two hyperfine couplings have the same sign, the stronger lines appear on the same side of the spectrum as shown in simulations in Figure (a) dashed traces and when the two hyperfine couplings have opposite signs the stronger lines appear on the opposite sides in the CP-ENDOR spectra, Figure (a) solid traces. Therefore, we conclude that CP-ENDOR experiment permits determination of the relative sign of two hyperfine couplings, when an asymmetry is observed simultaneously for two types of hyperfine coupled nuclei in the same CP-ENDOR experiment.
Despite the fact that we are comparing real data with simulations of three-spin systems only, we can conclude that theoretical and experimental spectra show very similar features. This indicates that the theoretical approach introduced in the former section succeeded, at least qualitatively, to explain the results of CP-ENDOR spectroscopy.
CP-ENDOR at low temperatures
To test whether CP-ENDOR could provide additional advantages with respect to standard Davies ENDOR, we examined the performance of the sequence at low temperature. Cavity cooling combined with longer electron-spin relaxation time allowed for a longer CP irradiation up to 200 μs, a time which was limited by the maximum RF power tolerated by the ENDOR resonator.
Figure illustrates CP and Davies ENDOR spectra recorded under identical conditions. Spectra were scaled to the same noise level. In a single-shot and single-scan experiment, we find a superior performance of the CP-ENDOR sequence (Figure (a)) with an increase in S/N with respect to Davies by a factor up to 5 as evaluated on the enhanced transition. Contrary at room temperature, but using a shorter CP pulse of 50 μs, the S/N of Davies ENDOR exceeded the CP-ENDOR by a factor of 2-3. We attribute the increased CP-ENDOR performance at low temperature to the effect of the longer CP irradiation time, which is consistent with the dependence on the length of the tCP period observed for the eNCP spectra.
A further significant effect was observed when comparing CP with Davies ENDOR spectra after accumulation of several shots and scans using a repetition time on the order of T1e (Figure (b)). A representative example is given by sampling with 25 shots per point. The Davies ENDOR spectrum improves in S/N with respect to (a) only by a factor of 2 due to saturation of the nuclear sublevels (tr ≈ T1e ≪ T1n), whereas CP-ENDOR improves by a factor of ∼4. Therefore, CP-ENDOR is much less affected by nuclear saturation. By comparing the S/N ratios at the enhanced transition, we find an overall gain in performance of CP vs. Davies ENDOR (ICP/IDavies) of a factor ∼9 (Figure (b)) at this temperature.
One possible experimental approach to circumvent saturation in Davies ENDOR is the use of random RF acquisition combined with detection of one single shot per point. In this way, each spin packet is excited just once during the acquisition of one ENDOR scan and, depending on T1n versus the total acquisition time of one scan, saturation might be alleviated. To allow for a better comparison, we have recorded spectra after accumulation of 25 scans using random RF acquisition and 1 shot/point (Figure (c)). In this acquisition modus, the S/N ratio with respect to the spectra in (a) improves by a factor of 5 in CP-ENDOR, according to the expected , but only by a factor 2.8 for Davies. Therefore, random acquisition does not improve much the performance of the Davies ENDOR when T1n is on the order of the acquisition time for one scan (≈ 40 s) or longer.
Finally, we have compared the performance of CP-ENDOR with TRIPLE resonance (Figure (d)) [4], which is the most common experiment to determine the sign of the hyperfine couplings in EPR. The comparison was conceived to exclude the possibility that the asymmetry in CP-ENDOR actually arises from a TRIPLE effect caused by the subsequent irradiation of two RF frequencies, the first at a constant RF value during tCP and the second in the ENDOR read-out. To carry out the comparison, the CP-ENDOR sequence was modified by switching off the MW spin-lock pulse and substituting the first MW π/2 by a π pulse. The obtained TRIPLE-ENDOR spectrum is illustrated in Figure (d) as compared to CP-ENDOR. The intensity and asymmetry in the CP-ENDOR spectrum are considerably larger than in TRIPLE, which demonstrates that the CP-ENDOR effect is not a result of the residual TRIPLE effect and that the MW spin-lock pulse has a substantial effect in driving eNCP.
The above results show that one important feature of the CP-ENDOR experiment, in contrast to Davies ENDOR, is its insensitivity to nuclear saturation, namely when data are accumulated repetitively with a repetition time tr shorter than T1n. When tr ≪ T1n the echo signal of conventional Davies ENDOR at the second repeat of the pulse sequence can become almost equal to the signal obtained without a πRF pulse and the ENDOR difference signal becomes about zero [Citation12]. An example of this effect is shown in Figure (h) for the two-spin system. The same is observed for the CP-ENDOR pulse sequence when none of the CP conditions is matched (Figure (g)). This is markedly different for the CP-ENDOR spectrum obtained with Δωn matching one of the CP conditions. The spectrum approximately maintains its intensities upon subsequent repeats of the experiment even when T1e ≪ tr ≪ T1n. A straightforward calculation of the signal intensities of the first and second repeats of the CP-ENDOR sequence reveals that the intensities of the two lines having the values − 1/4 and 3/4 upon first repeat become − 5/16 and 11/16 upon the second (Figure (f)). These small differences do not converge during repetitive experiments. A more detailed investigation of the relaxation and its implication for CP-ENDOR will be presented in a forthcoming paper.
Summary and conclusions
We have proposed and examined a new pulse sequence to acquire ENDOR spectra that presents considerable new features with respect to standard Davies ENDOR. The most important ones are: (i) the sequence is sensitive to the relative sign of the hyperfine couplings, which can be extracted from the asymmetric line shape and (ii) the sequence is much less affected by saturation effects arising from the long relaxation times of the nuclei. The presented theoretical approach accounted for those effects. Basically, the effect of the CP sequence on the coupled electron-nuclear spin system is to saturate pairs of energy levels in the tilted frame (as defined by the spin-lock pulse), which satisfy matching conditions. This results in an asymmetric polarisation of the ENDOR lines that depends on the relative signs of the hyperfine couplings. The sequence appears more robust and less affected by nutation errors than standard ENDOR sequences, as indicated by the large absolute ENDOR effects exceeding standard Davies ENDOR at low temperatures.
Two parameters were found to considerably influence the matching conditions and thus the intensity and shape of the spectra: the MW field strength and the RF offset of the CP pulse. Increasing MW fields attenuate the CP effect and suppress small hyperfine couplings in a similar fashion as the Davies ENDOR sequence. The RF-CP offset depends on the hyperfine couplings but the matching turned out quite broad. This is an important point indicating that it is not necessary to polarise each set of nuclei independently. The pronounced enhanced sensitivity of the sequence at low temperature makes it potentially very attractive for real applications in biology and material science, where very low temperatures are required to increase polarisation due to the restricted amounts of spins. Furthermore, several paramagnetic centres in proteins are coupled to fast relaxing spins such as metal ions or cluster and can be investigate only at very low T (<10 K). Thus, the concept presented here might be expanded and optimised in future for specific applications.
Acknowledgements
R.R. and M.B. would like to thank Igor Tkach for assistance as well as Volker Weis for discussions. The work was funded by the DFG Priority Program 1601, the COST Action TD1103-European Network for Hyperpolarisation Physics and Methodology in NMR and MRI, the Max Planck Society.
References
- W.B. Mims, Proc. R. Soc. Lond. A 283 (1395), 452 (1965).
- E.R. Davies, Phys. Lett. A 47 (1), 1 (1974).
- C. Gemperle and A. Schweiger, Chem. Rev. 91, 1481 (1991).
- A. Grupp and M. Mehring, in Modern Pulsed and Continuous Wave Electron Spin Resonance, edited by L. Kevan and M. Bowmann (John Wiley & Sons, New York, 1990).
- D. Goldfarb and D. Arieli, Annu. Rev. Biophys. Biomol. Struct. 33, 441 (2004).
- M. Bennati and T. Prisner, Rep. Progr. Phys. 68, 411 (2005).
- T. Argirevic, C. Riplinger, J. Stubbe, F. Neese, and M. Bennati, J. Am. Chem. Soc. 134, 17661 (2012).
- A.J. Fielding, F. Brodhun, C. Koch, R. Pievo, V. Denysenkov, I. Feussner, and M. Bennati, J. Am. Chem. Soc. 133, 9052 (2011).
- I. Kaminker, A. Sushenko, A. Potapov, S. Daube, B. Akabayov, I. Sagi, and D. Goldfarb, J. Am. Chem. Soc. 133 (39), 15514 (2011).
- A. Silakov, E.J. Reijerse, S.P.J. Albracht, E.C. Hatchikian, and W. Lubitz, J. Am. Chem. Soc. 129, 11447 (2007).
- M.T. Bennebroek and J. Schmidt, J. Magn. Reson. 128, 199 (1997).
- B. Epel, A. Pöppl, P. Manikandan, S. Vega, and D. Goldfarb, J. Magn. Reson. 148, 388 (2001).
- A.M. Tyryshkin, J.J.L. Morton, A. Ardavan, and S.A. Lyon, J. Chem. Phys. 124, 234508 (2006).
- J.J.L. Morton, N.S. Lees, B.M. Hoffman, and S. Stoll, J. Magn. Reson. 191, 315 (2008).
- A.W. Overhauser, Phys. Rev. 92 (2), 411 (1953).
- A. Abragam, Phys. Rev. 98 (6), 1729 (1955).
- T. Maly, G.T. Debelouchina, V.S. Bajaj, K.N. Hu, C.G. Joo, M.L. Mak-Jurkauskas, J.R. Sirigiri, P.C.A. van der Wel, J. Herzfeld, R.J. Temkin, and R.G. Griffin, J. Chem. Phys. 128 (5), 052211 (2008).
- M. Bennati, I. Tkach, and M.-T. Türke, Electron Paramagnetic Reson. 22, 155 (2011).
- D. Shimon, Y. Hovav, A. Feintuch, D. Goldfarb, and S. Vega, Phys. Chem. Chem. Phys. 14, 5729 (2012).
- C. Griesinger, M. Bennati, H.M. Vieth, C. Luchinat, G. Parigi, P. Höfer, F. Engelke, S.J. Glaser, V. Denysenkov, and T. Prisner, Prog. Nucl. Magn. Reson. Spectrosc. 64, 4 (2012).
- S.R. Hartmann and E.L. Hahn, Phys. Rev. 128 (5), 2042 (1962).
- H. Brunner, R.H. Fritsch, and K.H. Hausser, Z. Naturforsch. 42a, 1456 (1987).
- A. Henstra and W.Th. Wenckenbach, Mol. Phys. 106 (7), 859 (2008).
- A. Henstra, T.-S. Lin, J. Schmidt, and W.Th. Wenckenbach, Chem. Phys. Lett. 165, 6 (1990).
- V. Weis, M. Bennati, M. Rosay, and R.G. Griffin, J. Chem. Phys. 113 (16), 6795 (2000).
- V. Weis and R.G. Griffin, Solid State Nucl. Magn. Reson. 29, 105 (2006).
- N. Pomplun, B. Heitmann, N. Khaneja, and S.J. Glaser, Appl. Magn. Reson. 34, 331 (2008).
- S. Vega, J. Chem. Phys. 68, 5518 (1978).
- A. Schweiger and G. Jeschke, Principles of Pulse Electron Paramagnetic Resonance (Oxford University Press, Oxford, 2001).
- M. Bennati, C. Farrar, J. Bryant, S. Inati, V. Weis, G. Gerfen, P. Riggs-Gelasco, J. Stubbe, and R.G. Griffin, J. Magn. Reson. 132, 232 (1999).
- Y. Hovav, A. Feintuch, and S. Vega, J. Magn. Reson. 207, 176 (2010).
Appendix 1. CP conditions for a three-spin system
CP conditions can similarly be derived for the three-spin {e − n1 − n2} system. Then, the dimension of the matrix representation of the Hamiltonian is 8 × 8 and it can be expressed in terms of Ii − j(x, y, z) operators with i < j = 1, 8. Defining the spin basis set in this case by:
a straightforward calculation, based on diagonalisation of the Hamiltonian and energy matching in the tilted frame, reveals that there are 16 possible CP conditions that can be summarised as:
with
The CP polarisation transfer efficiencies of these condition are again dependent on off diagonal matrix elements that are proportional to ω1n. The energy matching assignments and the expressions for the off diagonal elements are not explicitly derived here and further discussions of the three-spin system solely rely on simulation results.
Appendix 2. The relaxation superoperator
During the simulations, the elements of the relaxation superoperator are defined following the procedure used in reference [Citation31]. In the eigenstate basis set {|λk > } of the diagonal spin Hamiltonian in Equation (1) (without MW and RF irradiation) with eigenvalues λk, the populations are defined as pk(t) = < λk|ρ(t)|λk > and the coherences by < λk|ρ(t)|λk′ >. The matrix elements
of the part of the Liouvillian superoperator representing relaxation are defined, according to the individual transitions |λk > ↔|λk′ >, as
with the Boltzmann factors
and T1, kk′ the longitudinal relaxation time of this transition, and
with T2, kk′ the transverse relaxation time.
The values of T1, kk′ and T2, kk′ are chosen according to the characteristics of the |λk > ↔|λk′ > transition. For all nuclear transitions (Δmn = ±1, Δme = 0) a single nuclear T1n is chosen and for all electron transitions (Δmn = 0 and Δme = ±1) a single T1e. Accordingly, values for T2n and T2e are chosen.
During the CP stage of the experiment, a rotating frame T1ρ relaxation time was introduced. During the MW and RF irradiation the tilted Hamiltonian, defined in Equation (6) and with eigenstates |λ[i − j]k >, is again diagonal and the relaxation elements of are defined as:
here [i-j] equal [1-3] and [2-4] for the {e–n} spin system and [1-5], [2-6],[3-7] and [4-8] for the {e–n1–n2} spin system. Angle ϕ[i − j] corresponds to the projection of the effective field in the [i-j] electron manifold on the x–y plane.