Abstract
The electron paramagnetic resonance technique of double electron-electron resonance (DEER) was used to measure nanometre-scale distances between nitroxide spin labels attached to the complement regulatory protein CD55 (also known as decay accelerating factor) and the von Willebrand factor A (vWF-A) domain of factor B. Following a thorough assessment of the quality of the data, distances obtained from good-quality measurements are compared to predicted distances from a previously hypothesised model for the complex and are found to be incompatible. The success of using these distances as restraints in multi-body docking routines is presented critically.
1. Introduction
Measuring nanometre distances by electron paramagnetic resonance (EPR) spectroscopy is an attractive approach to study structural aspects of biomacromolecules. Through detection of the dipolar coupling frequency, ν, between site-specifically placed pairs of nitroxide spin labels, accurate distances, r, and distance distributions can be obtained for biomacromolecules in (frozen) solution since ν ∝ r−3. Thus, the structure or conformational changes of proteins or nucleic acids in solution can be compared to results from other biophysical techniques such as X-ray crystallography, electron microscopy or nuclear magnetic resonance spectroscopy [Citation1–3]. The most popular method for measuring dipolar coupling frequencies corresponding to nanometre-length distances is double electron–electron resonance, DEER (a.k.a. pulsed electron double resonance) – a pulsed EPR technique [Citation4–8].
The structure determination of protein-protein complexes often evades more established biophysical tools, particularly if the proteins interact only weakly. A very appealing use of DEER lies in its potential ability to solve the structure of protein-protein complexes which would bring great insight into the functional mechanisms of biology [Citation3,Citation9–15]. One such system of interest is the series of protein–protein interactions required in the various pathways of the complement system which confers innate immunity and is made up from approximately 30 separate proteins [Citation16]. We set out to investigate whether DEER could elucidate the structure of the complex between complement decay-accelerating factor CD55 and the von Willebrand factor A (vWF-A) domain of factor B, an essential interaction in the regulation of the innate immune system against destruction of the host cell and associated autoimmune responses. The Mg2+-dependent interaction has previously been shown to have a micromolar affinity and whilst crystal structures exist for CD55, factor B and Bb, the activated form of B that CD55 interacts with, it has been proved impossible to gain further insight into the structure of the CD55:Bb or CD55:vWF-A complexes using other biophysical techniques [Citation17–21].
2. Materials and methods
2.1. Preparing the proteins
The vWF-A domain of factor B was expressed as a recombinant fusion protein with glutathione S-transferase fusion protein as described previously [Citation20]. The vWF-A was sub-cloned from the pGEX-2T vector into pTrcHisA (invitrogen) between the EcoRI and BamHI restriction sites providing an N-terminal HisTag. The protein was expressed in Escherichia coli strain BL21(DE3) using Luria–Bertani broth. Cultures were incubated at 37 °C before expression was induced during mid-log phase by the addition of 0.3 mM isopropyl β-D-1-thiogalactopyranoside (IPTG) and the temperature reduced to 20 °C overnight. Protein was purified using a HisTrap fast flow column (GE Life Sciences) following the manufacturer's guidelines followed by size exclusion chromatography using an S75 26/60 gel filtration column equilibrated in 150 mM NaCl, 50 mM Tris-HCl, pH 7.5.
Mutagenesis reactions to introduce the DESQ C-terminal motif, to make the point mutation C267S and to introduce the cysteine residues at positions given in Table S1 were carried out with the Quikchange Site-Directed Mutagenesis Kit (Stratagene) as per the manufacturers’ instructions. Primers are shown in Table S2.
Proteins were spin labelled by adding S-(2,2,5,5-tetramethyl-2,5-dihydro-1H-pyrrol-3-yl)methyl methanesulphonate spin label (MTSSL, Toronto Research Chemicals) and leaving the sample in the refrigerator overnight to give an R1 side chain ((A)). The excess spin label was removed using size exclusion chromato-graphy.
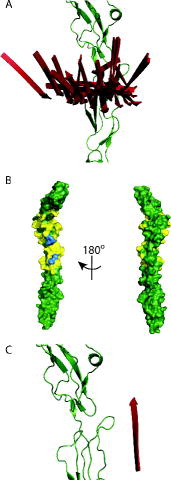
Figure 1. Relevant structures. (A) The MTS nitroxide spin label attached to a cysteine to make an R1 side chain. (B) CD55 from 1OJV.pdb [Citation21] with the positions of mutations shown as blue spheres (CCP, complement control protein module). (C) vWF-A from a chimera of 1RRK.pdb [Citation30] and 1Q0P.pdb [Citation31] to provide a complete structure from residues 243 to 444. The successful mutations are blue spheres, unsuccessful mutations are yellow spheres and the Mg2+ ion is a green sphere.
![Figure 1. Relevant structures. (A) The MTS nitroxide spin label attached to a cysteine to make an R1 side chain. (B) CD55 from 1OJV.pdb [Citation21] with the positions of mutations shown as blue spheres (CCP, complement control protein module). (C) vWF-A from a chimera of 1RRK.pdb [Citation30] and 1Q0P.pdb [Citation31] to provide a complete structure from residues 243 to 444. The successful mutations are blue spheres, unsuccessful mutations are yellow spheres and the Mg2+ ion is a green sphere.](/cms/asset/9749e87f-7882-41be-a4d3-211d0e2bfbfa/tmph_a_827754_f0001_oc.jpg)
Generation of recombinant human CD55 with complement control protein (CCP) modules 1–4, an N-terminal methionine glutamine (MQ) sequence and C-terminal cysteine, CD55C254, has been described previously [Citation19,Citation21]. A CD55 construct consisting of CCP modules 1–3 with a C-terminal cysteine for CD55I191C were sub-cloned into pET-28b (Merck Biosciences) via the pDrive cloning vector (Qiagen) between the NdeI and EcoRI restriction sites, adding an N-terminal HisTag. CCP domains 2–4 with an N-terminal cysteine, CD55N63C, were sub-cloned from the CD55C254 expression plasmid into the pET-14b vector (Merck Biosciences) using a similar protocol to above and again conferring an N-terminal HisTag sequence to the protein sequence. CD55Q2C and CD55S108C were produced by cloning CD55C254 into the pET-14b vector between the NcoI and XhoI restriction sites. This resulted in a Q2G mutation from the original CD55 sequence. Mutagenesis, to correct this sequence difference and perform Q2C, C254K and S108C mutations, was performed using the Quikchange Site-Directed Mutagenesis Kit (Stratagene).
The CD55 constructs were expressed in E. coli strain BL21(DE3), purified from inclusion bodies and refolded using previously published methods [Citation19]. All six mutants behaved as their wild-type equivalents in polyacrylamide gel electrophoresis with sodium dodecyl sulfate denaturation protein electrophoresis and fast protein liquid chromatography experiments. The purified monomeric protein was treated overnight at 4 °C with tris-carboxyethyl phosphine, TCEP (Pierce) to cleave the exo-disulphide bond between the introduced cysteine and the cysteine derived from the refold buffer. The protein was again cleaned using S75 26/60 gel filtration and MTSSL was added. Excess spin label was removed either by gel filtration or successive dilution into buffered deuterated water ready for DEER using microcentrifuge spin concentrators.
All vWF-A and CD55 gene sequences were verified by DNA sequencing using appropriate primers. Electrospray mass spectrometry was carried out on the vWF-A and CD55 proteins before and after spin labelling to confirm the identity of the samples. The masses corresponded to the expected proteins for all measured samples except in the case of CD55N63C, which had a mass consistent with the mass of the protein with an N-terminal GSM motif (preceding the inserted cysteine) but without the rest of the HisTag.
Throughout this work, the vWF-A residues are numbered according to their positions in full-length factor B. Meanwhile the CD55 residues are numbered according to the construct used here. This has additional N-terminal MQ amino acids and therefore all residue numbers are by two greater than their position in the expressed human protein.
2.2. DEER spectroscopy
Samples were prepared for EPR experiments by sequential dilution and concentration of the proteins into 50 mM Tris, 150 mM NaCl, 5 mM MgCl2, pH 7.5 in D2O and then 30% v/v d8-glycerol. The procedure was designed to result in samples which were 100 μM in each protein component. The samples were inserted into 3-mm quartz EPR tubes and frozen in liquid nitrogen prior to measurement.
The four-pulse DEER experiments at X-band frequencies (∼9.5 GHz) used the sequence π/2(υobs)–τ1–π(υobs)–t–π(υpump)–(τ1 + τ2 − t)–π(υobs)–τ2–echo with τ1 = 400 ns, τ2 between 1 and 10 μs, Δt = 8 ns and υobs−υpump = 65 MHz [Citation22]. The observer pulses were 32 ns in length with a +/− phase cycle on the first pulse and the pump pulse was 12 ns. Deuterium modulations were minimised by adding eight data-sets with variable delay Δτ1 = 56 ns. Experiments were performed using a Bruker Elexsys system with a Bruker EN 4118X-MS3 resonator. The data were analysed using DeerAnalysis2011 with an exponential background correction and Tikhonov regularisation (see Table S5 for choice of regularisation value) [Citation23].
2.3. Computer programs
2.3.1. R2 and χ2 per degree of freedom background analyses
Details of these calculations are provided in the supporting information. Calculations were carried out in MATLAB R2012a.
2.3.2. Spin-labelling using the multiscale modeling of macromolecular systems (MMM) software
The coordinates of the protein or complex of interest were uploaded into MMM (version 2010) running in MATLAB R2012a [Citation24]. The sites of interest were labelled with the R1 rotamer library calculated at 175 K, which is the recommended approximation for spin-labelled proteins in frozen water/glycerol mixtures. The program models the expected distance distribution to be given by DEER between pairs of labels and calculates the mean and standard deviation of this distance.
2.3.3. Docking using the crystallography and NMR system (CNS) software
Idealised MTSSL coordinates were downloaded from the HIC-Up server (compound MTN) and loaded into Xplo2d to create a dictionary for use by CNS [Citation3,Citation25–28]. Scripts to enable torsion angle dynamics and simulated annealing for rigid-body docking were written to use CNS 1.3 and were originally designed to be used with förster resonance energy transfer (FRET)-derived distances [Citation29]. The protein structures used for the rigid-body docking were based on 1OJV.pdb for the CD55 and a chimera of 1RRK and 1Q0P for the vWF-A which gives a complete structure for vWF-A from residues 243 to 444 [Citation30,31]. In the case of CD55 alternative conformations were used so that the truncated forms of the protein used in the CD55N63R1 and CD55I191R1 experiments could be correctly incorporated. The proteins were mutated in silico to include the cysteine positions and these had MTSSLs added to give the R1 side chain. The labels and all side chains were allowed to change torsion angles around their bonds freely in the spatially separated proteins to generate 20 different initial structures. Each of these was then subjected to rounds of simulated annealing using very high temperatures with 10 different CNS SCALE values between 20 and 200 and the DEER-derived distance restraints were treated as CNS nuclear overhauser effect (NOE) restraints. This created 200 possible docked structures. Finally the side chains and spin labels were allowed to rotate about all bonds once again to minimise the distance violation energy (how well the DEER distances were obeyed). All steps were performed with only van der Waals interactions. The 200 structures were filtered and only those with CNS NOE energies of zero, i.e. no violations between the DEER-derived distance restraints and the result, were kept. More information about the scripts, procedures and parameters are available upon request.
3. Results
3.1. Producing the spin-labelled proteins
To investigate the CD55:vWF-A structure with DEER spectroscopy, nitroxide spin labels need to be attached in various positions throughout the two proteins. We attached the MTSSL to cysteines which had been introduced using site-specific mutagenesis to give the R1 side chain ((A)). The CD55 contains 16 cysteines in its wild-type sequence but all of these are in disulphide bonds and are therefore not free to label. On the other hand, vWF-A contains just one cysteine and this has been labelled for a previous study [Citation32]. Five separate cysteine mutations were made for CD55 and 11 for vWF-A but whilst all CD55 mutants were successfully purified and isolated this was true for only three of the vWF-A mutants ((B) and (C)). This led to a total of 20 DEER time traces for the various combinations of complexes.
3.2. The DEER time traces
All combinations of CD55 and vWF-A were measured as well as the individual proteins. Most of the DEER time traces, including those from the individual proteins, were not purely exponential decays and therefore indicated the presence of dipolar coupling. To assess our confidence in whether the DEER time traces truly deviate from the exponential baseline we determined the R2 and χ2 per degree of freedom for the difference between the experimental signal and the extrapolated fitted background from DeerAnalysis2011 (see the supporting information) [Citation23]. The results indicate that the isolated proteins vWF-AD438R1, CD55Q2R1, CD55N63R1, CD55I191R1, CD55C254R1, and the protein complexes CD55Q2R1:vWF-AK294R1, CD55C254R1:vWF-AC267R1, CD55C254R1:vWF-AR381R1, CD55C254R1:vWF-AD438R1 do not significantly differ from the expected background. In the case of the complexes, this could be because the CD55 and vWF-A proteins do not interact. However, since the signals for the individual proteins are not observed for complexes with vWF-AC267R1, vWF-AK294R1 and vWF-AR381R1, it is possible that the CD55 and vWF-A proteins are interacting but that the distance between the spin labels on each of the proteins is too far to be detected by DEER. We have previously shown that vWF-AC267R1 has an intermolecular interaction consistent with the formation of a trimer, as seen in the crystal structure (protein data bank, PDB access code 1Q0P) [Citation30,Citation32]. The DEER time traces from the vWF-AK294R1 and vWF-AR381R1 mutants correspond to broad distance ranges and thus could not be so clearly attributed to the presence of a vWF-A trimer. The DEER results from CD55S108R1 also led to a wide range of distances and were interpreted as being from a degree of disordered aggregation.
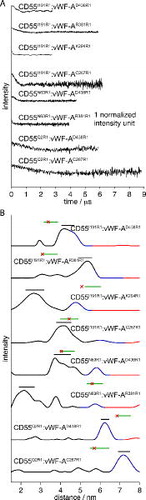
The DEER time traces have shallow modulation depths of approximately 5–10%, well below the expected value of around 50% for DEER experiments with nitroxide spin labels at X-band (Table S3 presents the number of interacting spins in each sample derived from the modulation depth). This reduction could be due to incomplete complex formation since the equilibrium values for binding are in the μM range and we are using 100 μM concentrations. In addition, very few of the traces show long-lived dipolar modulations which would be indicative of a single and tight distance distribution. A number of complicating factors (low modulation depths, broad range of distances and possible contributions from homomultimeric complexes) therefore affect a number of the DEER traces. Extensive testing with the validation procedures available in DeerAnalysis2011, comparisons to the time traces and distance distributions obtained from the isolated proteins (see Figures S2 and S4) and results from the R2/χ2 background tests described above led us to have a reasonable degree of confidence in only 8 of the 20 measured CD55:vWF-A mixtures (see ) [Citation23]. The average distance for the major distance peak for these eight results range from 2.3 to 7.2 nm and are displayed in and Table S4.
Table 1. Complexes marked by a tick are where their DEER time traces pass: (1) the R2 and χ2 background tests; (2) the DeerAnalysis2011 validation tool and (3) where distances are different to distances/distributions extracted from the DEER time traces for the isolated vWF-A or CD55 proteins (see the supporting information). Individual proteins marked by a tick show cases where the DEER time traces deviated from an exponential fitted background as determined by the R2 and χ2 tests.
Figure 2. Experimental results from DEER: (A) Background-corrected DEER for the CD55:vWF-A complexes chosen as justified in the text and the supporting information. (B) Distance distributions from the time traces shown in (A). Each distance distribution is shown in black (good), blue (medium) and red (poor) corresponding to certainty intervals based on the length of the time trace data, as implemented in DeerAnalysis2011. The black horizontal line shows the standard deviation about the mean for the major distance peak, the green line shows the standard deviation about the mean for the MMM results from the hypothesised model (see Section 3.3) and the red star represents the Cα–Cα distance in the model.
3.3. Comparison of the DEER distance results to a previously proposed model for the CD55:vWF-A interaction
Published crystal structures of the first four domains of factor H, another regulator of complement, bound to C3b (2WII.pdb) and a complex of C3b:Bb stabilised by staphylococcal complement inhibitor peptide (2WIN.pdb) have been used to predict a general route for decay accelerating complement regulators [Citation33,34]. In this model, the regulator competes for the binding site of C3b with Bb and has been proposed to drive decay acceleration by electrostatic repulsion and/or allosteric effects on the vWF-A metal ion-dependent adhesion site, in addition to sterically occluding new factor B binding. From the crystallographic structures (2WII, 2WIN, 1OJV), it is possible to construct a hypothetical model for the CD55:vWF-A structure whereby the Bb would simply dissociate from the C3b and attach to the neighbouring CD55 ((A), (B) and (C)) [Citation24,Citation33,Citation34]. This was tested by comparing the eight DEER-derived distance results with the distances predicted by the hypothetical model. The residues of the model corresponding to the modified residues in our study were mutated to an R1 side chain and a rotamer library from MMM was applied [Citation24,Citation33,Citation34]. The predicted distances are compared to the experimentally derived distances in (B) along with the Cα–Cα distances from the model. From this, six of the DEER-derived distance distributions do not correspond with the model and four of these fit particularly poorly. The model has some chain clashes between the vWF-A and CD55 proteins but even allowing a lengthening of the Cα–Cα and rotamer library distances would still leave at least three of the DEER distances unexplained. Therefore, assuming that the measured CD55:vWF-A complex is the same as the complex formed during complement regulation, we conclude that it cannot simply be modelled using the fH:C3b and C3b:Bb crystal structures.
Figure 3. Models for the CD55:vWF-A complex: (A) Relevant chains of 2WII.pdb [Citation33] (fH1-4 and C3b), 2WIN.pdb [Citation34] (C3 and fB) and 1OJV.pdb [Citation21] (CD55). C3b in grey, fH in light green, CD55 in dark green, the vWF-A and serine protease domains of Bb in red and cyan, respectively. (B) The hypothesised model structure for the CD55:vWF-A interaction taken from (A) with the vWF-A coloured from blue to red, N- to C-terminal and CD55 in green.
![Figure 3. Models for the CD55:vWF-A complex: (A) Relevant chains of 2WII.pdb [Citation33] (fH1-4 and C3b), 2WIN.pdb [Citation34] (C3 and fB) and 1OJV.pdb [Citation21] (CD55). C3b in grey, fH in light green, CD55 in dark green, the vWF-A and serine protease domains of Bb in red and cyan, respectively. (B) The hypothesised model structure for the CD55:vWF-A interaction taken from (A) with the vWF-A coloured from blue to red, N- to C-terminal and CD55 in green.](/cms/asset/ca3e2f93-a27b-485a-8273-ee9ea3f978c9/tmph_a_827754_f0003_oc.jpg)
3.4. DEER-derived distances as restraints in rigid-body docking
Having obtained the significant insight that a simple model based on the known crystal structures is not sufficient to describe the DEER-derived distances, we wanted to know if our eight distances could lead to a structure for the CD55:vWF-A complex. In principle, the three-dimensional rigid-body docking problem should be solvable with six distances. The DEER-derived distances/distributions (Table S4) were used in multi-body docking protocols written around CNS by treating the CD55 and vWF-A proteins as rigid bodies but allowing torsion of the R1 side chains [Citation25,Citation28,Citation29]. This resulted in numerous possible structures for the complex (see ) as the sizeable distributions prevented even eight distances from providing enough information to fully constrain the three-dimensional rigid-body docking problem. This problem is further compounded by the geometry of the CD55 (ovoid) and vWF-A (spherical) proteins and their moderate size, both less than 30 kDa.
Figure 4. Result from the CNS docking protocol using DEER-derived distances for the CD55:vWF-A complex: (A) Simplified representation of the 52 results from the CNS docking showing only the N-terminal strand of the vWF-A (to show its direction with respect to the CD55 chain) in red and the CD55 in green. (B) CD55 showing residues coloured yellow within 0.5 nm of any of vWF-A from all of the CNS docking results using the DEER-derived distance restraints. The blue residues are R71, L72, N73 (all upper), F171, L173 (both lower). (C) The complex modelled from the crystal structures as shown in using the simplified representation outlined in (A), for comparison.
Interestingly, the CNS results using the experimental restraints led to structures where the interaction face of the CD55 is principally between CCPs 2 and 3 ((B)), which is consistent with previous mutagenesis studies [Citation17,Citation20,Citation35–38]. For example, R71, L72, N73, F171 and L173 of CCP2 all lie centrally in the region implicated in the CD55:vWF-A interaction. However, it was notable that none of the structures produced by the docking method had the vWF-A orientated in same way as in our model based on the crystal structures ((A) and (C)), suggesting that the formation of a CD55:Bb complex during decay acceleration involves more than a simple lateral transfer.
Finally, looking again at the mutation sites shows that the complexes which had DEER time traces indistinguishable from the fitted background correspond to predicted distances beyond the DEER technique's typical measurement limit (usually much greater than ca. 7.5 nm) for protonated proteins measured in deuterated aqueous solution [Citation1,Citation7].
4. Discussion
The aim of this study was to investigate the structure of the CD55:vWF-A complex using DEER spectroscopy. Whilst progress has been made in understanding the structure, a number of factors affected the DEER data so that it was not possible to obtain a definite structure. This was because of: (1) the suspected presence of homomultimeric complexes causing ambiguity in the distance distributions; (2) shallow modulation depths, possibly due to a low yield of protein–protein complex which led to poor signal-to-noise; (3) broad distance distributions which may result from point 1 but also from conformational freedom or non-specific binding and (4) the shape and size of the CD55 and vWF-A proteins which means that many distance restraints will be required to produce a single structure for the complex. Many protein complexes of interest will not suffer from all, or possibly any, of the issues raised above and new progress in the DEER technique/spectrometer hardware will help circumvent some problems such as by improving signal-to-noise [Citation6,7,Citation39]: thus we have not shown that DEER cannot be used effectively for finding the structure of protein–protein complexes but that it cannot be applied universally.
We have developed a new and versatile approach for incorporating nanometre distances into multi-body docking protocols and have demonstrated that even if the constraints are insufficient to fully define a model, they provide a critical test for existing models. In particular, the experimentally derived results for CD55:vWF-A in solution suggest complement decay acceleration may involve more complex structural rearrangements than previously hypothesised.
Supplemental data
Supplemental data for this article can be accessed online.
Supplementary material
Download Zip (5.6 MB)Acknowledgements
We would like to thank Christian Bauer at MPI Mainz and Dr Jeff Harmer in Oxford (now at the University of Queensland) for EPR technical support. We thank Dr Jo Nettleship at the Oxford Protein Production Facility for mass spectrometry and Oxford Biochemistry DNA Sequencing Service for DNA sequencing. We gratefully acknowledge Prof. Axel Brunger at Stanford University for providing us with the CNS docking scripts and offering further support and advice. JEL thanks the Royal Society for a University Research Fellowship and University College Oxford for a Junior Research Fellowship.
Additional information
Funding
References
- G. Jeschke, Annu. Rev. Phys. Chem. 63, 419 (2012).
- O. Schiemann and T.F. Prisner, Q. Rev. Biophys. 40 (1), 1–53 (2007).
- J. Bhatnagar, J.H. Freed, and B.R. Crane, Method Enzymol. 423, 117 (2007).
- A.D. Milov, K.M. Salikohov, and M.D. Shirov, Fiz. Tverd. Tela 23 (4), 975–982 (1981).
- R.E. Martin, M. Pannier, F. Diederich, V. Gramlich, M. Hubrich, and H.W. Spiess, Angew. Chem. Int. Ed. 37 (20), 2834–2837 (1998).
- J.E. Lovett, B.W. Lovett, and J. Harmer, J. Magn. Reson. 223, 98 (2012).
- R. Ward, A. Bowman, E. Sozudogru, H. El-Mkami, T. Owen-Hughes, and D.G. Norman, J. Magn. Reson. 207 (1), 164–167 (2010).
- J.E. Banham, C.M. Baker, S. Ceola, I.J. Day, G.H. Grant, E.J.J. Groenen, C.T. Rodgers, G. Jeschke, and C.R. Timmel, J. Magn. Reson. 191 (2), 202–218 (2008).
- D. Hilger, Y. Polyhach, H. Jung, and G. Jeschke, Biophys. J. 96 (1), 217–225 (2009).
- R. Ward, M. Zoltner, L. Beer, H. El Mkami, I.R. Henderson, T. Palmer, and D.G. Norman, Structure 17 (9), 1187–1194 (2009).
- N. Alexander, M. Bortolus, A. Al-Mestarihi, H. McHaourab, and J. Meiler, Structure 16 (2), 181–195 (2008).
- C. Abe, F. Dietrich, P. Gajula, M. Benz, K.P. Vogel, M. van Gastel, S. Illenberger, W.H. Ziegler, and H.J. Steinhoff, Biophys. J. 101 (7), 1772–1780 (2011).
- M. Bennati, J.H. Robblee, V. Mugnaini, J. Stubbe, J.H. Freed, and P. Borbat, J. Am. Chem. Soc. 127 (43), 15014–15015 (2005).
- S.Y. Park, P.P. Borbat, G. Gonzalez-Bonet, J. Bhatnagar, A.M. Pollard, J.H. Freed, A.M. Bilwes, and B.R. Crane, Nat. Struct. Mol. Biol. 13 (5), 400–407 (2006).
- P.L. Ramachandran, J.E. Lovett, P.J. Carl, M. Cammarata, J.H. Lee, Y.O. Jung, H. Ihee, C.R. Timmel, and J.J. van Thor, J. Am. Chem. Soc. 133 (24), 9395–9404 (2011).
- B.P. Morgan and C.L. Harris, Mol. Immunol. 40 (2–4), 159–170 (2003).
- D.E. Hourcade, L. Mitchell, L.A. Kuttner-Kondo, J.P. Atkinson, and M.E. Medof, J. Biol. Chem. 277 (2), 1107–1112 (2002).
- C.L. Harris, R.J.M. Abbott, R.A. Smith, B.P. Morgan, and S.M. Lea, J. Biol. Chem. 280 (4), 2569–2578 (2005).
- J. White, P. Lukacik, D. Esser, M. Steward, N. Giddings, J.R. Bright, S.J. Fritchley, B.P. Morgan, S.M. Lea, G.P. Smith, and R.A.G. Smith, Protein Sci. 13 (9), 2406–2415 (2004).
- S.C. Williams, J. Hinshelwood, S.J. Perkins, and R.B. Sim, Biochem. J. 342, 625 (1999).
- P. Lukacik, P. Roversi, J. White, D. Esser, G.P. Smith, J. Billington, P.A. Williams, P.M. Rudd, M.R. Wormald, D.J. Harvey, M.D.M. Crispin, C.M. Radcliffe, R.A. Dwek, D.J. Evans, B.P. Morgan, R.A.G. Smith, and S.M. Lea, Proc. Natl. Acad. Sci. U.S.A. 101 (5), 1279–1284 (2004).
- G. Jeschke and Y. Polyhach, Phys. Chem. Chem. Phys. 9 (16), 1895–1910 (2007).
- G. Jeschke, V. Chechik, P. Ionita, A. Godt, H. Zimmermann, J. Banham, C.R. Timmel, D. Hilger, and H. Jung, Appl. Magn. Reson. 30 (3–4), 473–498 (2006).
- Y. Polyhach, E. Bordignon, and G. Jeschke, Phys. Chem. Chem. Phys. 13 (6), 2356–2366 (2011).
- A.T. Brunger, Nat. Protoc. 2 (11), 2728–2733 (2007).
- G.J. Kleywegt, Acta Crystallogr. Sect. D-Biol. Crystallogr. 63, 94 (2007).
- G.J. Kleywegt, K. Henrick, E.J. Dodson, and D.M.F. van Aalten, Structure 11 (9), 1051–1059 (2003).
- A.T. Brunger, P.D. Adams, G.M. Clore, W.L. DeLano, P. Gros, R.W. Grosse-Kunstleve, J.S. Jiang, J. Kuszewski, M. Nilges, N.S. Pannu, R.J. Read, L.M. Rice, T. Simonson, and G.L. Warren, Acta Crystallogr. Sect. D-Biol. Crystallogr. 54, 905 (1998).
- U.B. Choi, P. Strop, M. Vrljic, S. Chu, A.T. Brunger, and K.R. Weninger, Nat. Struct. Mol. Biol. 17 (3), 318–324 (2010).
- K. Ponnuraj, Y.Y. Xu, K. Macon, D. Moore, J.E. Volanakis, and S.V.L. Narayana, Mol. Cell 14 (1), 17–28 (2004).
- A.A. Bhattacharya, M.L. Lupher, D.E. Staunton, and R.C. Liddington, Structure 12 (3), 371–378 (2004).
- J.E. Banham, R.J.M. Abbott, S.M. Lea, C.R. Timmel, and G. Jeschke, Angew. Chem. Int. Ed. 45 (7), 1058–1061 (2006).
- J. Wu, Y.Q. Wu, D. Ricklin, B.J.C. Janssen, J.D. Lambris, and P. Gros, Nat. Immunol. 10 (7), 728–733 (2009).
- S.H.M. Rooijakkers, J. Wu, M. Ruyken, R. van Domselaar, K.L. Planken, A. Tzekou, D. Ricklin, J.D. Lambris, B.J.C. Janssen, J.A.G. van Strijp, and P. Gros, Nat. Immunol. 10 (7), 721–727 (2009).
- C.L. Harris, D.M. Pettigrew, S.M. Lea, and B.P. Morgan, J. Immunol. 178 (1), 352–359 (2007).
- W.G. Brodbeck, D.C. Liu, J. Sperry, C. Mold, and M.E. Medof, J. Immunol. 156 (7), 2528–2533 (1996).
- L.A. Kuttner-Kondo, L. Mitchell, D.E. Hourcade, and M.E. Medof, J. Immunol. 167 (4), 2164–2171 (2001).
- P. Williams, Y. Chaudhry, I.G. Goodfellow, J. Billington, R. Powell, O.B. Spiller, D.J. Evans, and S. Lea, J. Biol. Chem. 278 (12), 10691–10696 (2003).
- G.W. Reginsson, R.I. Hunter, P.A.S. Cruickshank, D.R. Bolton, S.T. Sigurdsson, G.M. Smith, and O. Schiemann, J. Magn. Reson. 216, 175 (2012).