
Abstract
Double-resonance spectroscopy has been employed to characterise the autoionising and predissociating Rydberg states of NO converging to the υ+ = 0 and υ+ = 1 levels of the X1Σ+ ground state of NO+. Below the lowest ionisation limit, we monitor the formation of the N(2D) predissociation product and observe a spectrum dominated by the p(N+ = 0) series, with smaller contributions from the p(2) and f(2) series. Many of the lineshapes can be fit to a simple Fano line profile. Upon vibrational excitation, a competing autoionisation channel is opened and we monitor the products of both the dissociation and ionisation channels. The υ+ = 1 predissociation spectrum appears much more complex than the predissociation spectrum, with significant contributions from the p(0), f(2), p(2), s(1) and d(1) series. In contrast, the υ+ = 1 ionisation spectrum is dominated by the p(0) and f(2) Rydberg series, with much weaker contributions from s(1), d(1) and p(2) series. The lineshapes in the υ+ = 1 predissociation and autoionisation spectra are perturbed and cannot be fit to simple Fano line profiles. In some extreme cases, these perturbations result in the complete disappearance of peaks from either the autoionisation or predissociation spectrum.
1. Introduction
The dynamics of competing ionisation and dissociation decay paths in Rydberg states of diatomic molecules attract considerable interest, not only as model systems for the investigation of competing non-radiative processes in larger molecules, but also as prototypes for coherent control [Citation1–4]. Despite possessing only a single molecular bond, diatomic Rydberg molecules possess many of the characteristics of complex molecular systems, such as strong non-adiabatic couplings between electronic and nuclear motion, energy flow between different degrees of freedom (electronic, vibrational and rotational), delicately balanced interference effects between competing non-radiative decay pathways, complex resonances and internal time-scales spanning orders of magnitude. In this paper, we present a detailed investigation of ionisation and dissociation processes in Rydberg states of NO with principal quantum numbers in the range n = 18–50. The measurements are made both above and below the lowest ionisation limit, which allows us to investigate the effects of vibrational excitation on the predissociation dynamics. Improving our understanding of interferences in non-radiative decay processes has particular significance for controlling excited state molecular dynamics.
A number of experimental and theoretical studies have been directed towards the optical control of competing decay pathways. Among the first were frequency domain experiments in which control was accomplished through the manipulation of interferences between different excitation pathways [Citation5,6]. This approach took advantage of the energy-dependent phase difference between two excitation pathways; this is most prominent near quasi-bound states embedded in two or more continua where the wave function contains components from the discrete state and the continua. The phase difference provides information regarding the discrete and continuum components of the wave function as well as insight into potential optical control mechanisms [Citation7]. Another approach to optical control involves the use of iterative algorithms to optimise the phase and amplitude of the frequency components of broad bandwidth laser pulses; this has met with some success even in large molecules [Citation8–10], but the complex form of the laser pulses that are generated often obscures the underlying physics and it is not always possible to obtain a proper understanding of the control mechanism.
Due to the experimental and theoretical challenges concerned with designing optical control schemes from first principles, there is a need for detailed investigations of the quantum mechanical interferences between the non-radiative decay channels, which form the basis of these control methods [Citation11–20]. The influence of core excitation on the decay dynamics of Rydberg states has been reported for a number of simple diatomic molecules, including H2 [Citation21], BH [Citation11–14,Citation22] and NO [Citation2,Citation23–28]. Recently, Glass-Maujean et al. measured the absolute cross-sections for competing fluorescence, dissociation and ionisation decay channels in H2 which, together with a multichannel quantum-defect theory analysis, enabled a full comparison between the three decay processes for several quantum states [Citation21]. In a series of detailed spectroscopic investigations of the Rydberg states of BH, Grant and co-workers investigated the influence of vibrational excitation on the autoionisation lifetime. They observed a reduced autoionisation lifetime for some states upon vibrational excitation, which they explained in terms of a change in the coupling between the discrete states and the ionisation continuum as a function of internuclear separation, R [Citation14]; the discrete-continuum coupling is controlled by the quantum defect, μ(R). Perhaps of more direct relevance to our work is that of Fujii and Morita, who have published a number of detailed spectroscopic studies of the autoionising and predissociating Rydberg states of NO, including an investigation of the competition between ionisation and dissociation [Citation23–28]. They established that the decay dynamics of superexcited np Rydberg states of NO are governed by predissociation and not autoionisation [Citation25–27]. Furthermore, they determined that autoionisation plays the dominant role in determining the decay route for ns Rydberg states lying above the first ionisation limit [Citation26,27]. Fujii and Morita also investigated the influence of vibrational excitation on low Rydberg states with principal quantum numbers in the range n = 8–12.
The Rydberg states of NO have also been the subject of a number of more recent experimental investigations. For example, Softley and co-workers studied the effect of external electric fields on low Rydberg states of NO with principal quantum number n < 20 [Citation29,30], and Vrakking and Lee investigated the Stark effect in much higher Rydberg states, where n = 40–120 [Citation31]. In our own group, we have studied the intermediate Rydberg states of NO, with principal quantum number n = 25–35 in static and ramped external fields [Citation32–34]. We have also investigated the dynamics of Rydberg electron wave packets in NO [Citation35–37] and demonstrated that it is possible to control the composition of the wave packet by employing phase-locked pairs of optical pulses [Citation1,2].
The remainder of the paper is organised as follows: In Section 2, we provide an overview of the selection rules that control the excitation of Rydberg states within NO and describe the experimental set-up for the experiments. In Sections 3 and 4, we provide an overview of the spectra and discuss the effect of vibrational excitation and competing ionisation processes on predissociation. In Section 5, we provide a brief summary of the results of this investigation.
2. Experimental details
Our experimental set-up has been described in detail elsewhere [Citation34]. Briefly, and with reference to , Rydberg states of NO converging to the υ+ = 0 and υ+ = 1 ionisation limit are accessed by double-resonance excitation through specific rovibrational levels of the A2Σ+ state. A Nd:YAG (neodynium-doped yttrium–aluminium–garnet) laser operating at 20 Hz pumps two nanosecond dye lasers; the frequency-tripled output (226 or 215 nm) of the first dye laser is tuned to be in resonance with the P12(3/2) transition, exciting the intermediate state A2Σ+(υ′ = 0 or 1, N′ = 0, J′ = 1/2), from the ground state X2Π3/2(υ″ = 0, J″ = 3/2). The frequency-doubled output of the second dye laser (∼330 nm) is scanned through the Rydberg series. The output of this second dye laser is kept below 2 mJ/pulse to avoid power broadening.
Figure 1. A schematic diagram illustrating the excitation scheme employed in this work. A single photon (ω1) pumps the A2Σ+ ← X2Π3/2 transition and a second photon (ω2) scans through the Rydberg levels which may autoionise or predissociate. The dominant decay channel in the predissociation process is via the B2Π state to form N(2D) and O(3P) neutral products. This is probed by (2 + 1)REMPI of the nitrogen fragment via the N(2S) state. The products of the REMPI process and the autoionisation process are separated in a time of flight mass spectrometer and detected at a microchannel plate detector.
The A-state is not truly symmetric and the symmetry breakdown leads to an admixture of higher angular momentum character, calculated to be approximately 94% s, 5% d and 1% p [Citation38]. To satisfy parity criteria and propensity rules [Citation30,Citation33,Citation34], we expect strong transitions from the s component to np Rydberg series with N+ = N′, from the d component to np and nf series with N+ = N′, N′ ± 2, and weaker transitions from the p component to ns and nd series with N+ = N′ ± 1. Vibrational transitions are controlled by the fact that the overriding Franck–Condon factor is for Δυ = 0 transitions.
To record the autoionisation spectrum, we collect the integrated NO+ ion yield, i.e. we do not distinguish ionisation channels with different rotational quantum numbers, N+. There are three dissociation decay channels: N(4S) + O(3P); N(4S) + O(1D) and N(2D) + O(3P). The np Rydberg states associated with the 2Π configuration are perturbed strongly by the B2Π and L2Π valence states, although for Rydberg states between the υ+ = 0 and υ+ = 1 ionisation limits, the main dissociative pathway is along the B2Π state to N(2D) + O(3P) products (see ). There is a weak interaction between the ns states and the I2Σ+ valence state; however, most of the s states predissociate to N(4S) + O(3P) [Citation23]. To record the predissociation spectrum, we monitor decay into the N(2D) + O(3P) fragmentation channel by (2 + 1) resonance-enhanced multiphoton ionisation (REMPI) via the N(2S1/2) state using three photons of 269 nm (∼4 mJ/pulse) generated by mixing the 544-nm output of a third nanosecond dye laser, pumped by a second Nd:YAG laser, with residual 532-nm photons in a beta barium borate crystal. The optimum signals are recorded when the third laser pulse is delayed by ≤10 ns with respect to the first two.
The three laser beams are combined using dichroic mirrors and focused (f = 250 mm) into a pulsed, skimmed beam of NO molecules between a pair of electric field plates. A pulsed electric field extracts the N+ and NO+ ions and accelerates them along a 200-mm flight tube to a multichannel plate detector. The signal is passed through a fast preamplifier and collected on a digital oscilloscope. The ion time-of-flight signal is transferred by general purpose interface bus (GPIB) to data collection software on a personal computer where the N+ signal is gated and averaged over 20 laser shots. A small fraction of the output of the second dye laser is coupled by an optical fibre to a wavemeter that records the laser wavelength and is synchronised with the data acquisition software. The autoionisation and predissociation spectra are recorded in separate experiments, each with their own wavelength calibration. The laser bandwidth is less than the wavelength step size, which gives an upper limit of 0.1 cm−1 for the resolution of the autoionisation and predissociation spectra. The intensities of the autoionisation and predissociation spectra cannot be compared directly. The detection efficiencies for two processes could be calibrated to obtain absolute intensities as in [Citation20], but is beyond the scope of this work and, therefore, only relative intensities are discussed here.
3. Results
In , we present predissociation spectra of Rydberg states converging to the υ+ = 0 and υ+ = 1 ionisation limits and the autoionisation spectrum of Rydberg states converging to the υ+ = 1 ionisation limit. Frequency combs mark the unperturbed positions of the p(0), f(2) and p(2) series, calculated using the Rydberg formula, , where
is the ionisation potential, υ+ and N+ are the vibrational and rotational quantum numbers of the molecular ion core, RNO = 109,735.3 cm−1 is the Rydberg constant for NO, n is the principal quantum number and
is the quantum defect. The Hund's case (d) quantum defects μp(0) = 0.703 and μf(2) = 0.0180 were calculated using the Hund's case (b) quantum defects of Goodgame et al. [Citation30]. The Rydberg states are accessed via the υ′ = 0 or 1 levels of the A2E+(3sσ) state, and the similarity between the A-state and Rydberg state potentials facilitates a strong Δυ = 0 propensity in vibrational transitions and, therefore, the Rydberg states accessed from υ′ = 0 or 1 correspond to those converging to the υ+ = 0 or 1 ionisation limits, respectively. The spectra are plotted as a function of binding energy, relative to the rotationless υ+ = 0 and υ+ = 1 ionisation limits of the dominant p(0) series. The adiabatic ionisation potential of NO is 74,720.78 cm−1 with the vibrational frequency and rotational constant of the molecular ion being 2376.42 and 1.997 cm−1, respectively. In , we plot on an expanded scale the parts of the spectrum that are discussed in the remainder of the paper.
Figure 2. Autoionising (lower trace) and predissociating (upper traces) spectra of Rydberg states populated via the states. The spectra are plotted as a function of binding energy relative to the ionisation potential of the dominant np(0) series in the spectrum. The dominant np(0), np(2) and nf(2) series are labelled by frequency combs that mark the unperturbed line positions, calculated using the Rydberg formula, as described in the text. Representative lineshapes obtained from the least squares fit of Equation (1) are plotted in red.
Figure 3. Enlarged regions of the Rydberg spectra plotted over the range (a) −400 to −300 cm−1, (b) −300 to −200 cm−1 and (c) −200 to −100 cm−1. The dominant np(0), np(2) and nf(2) series are labelled by frequency combs that mark the unperturbed line positions, calculated using the Rydberg formula, as described in the text.
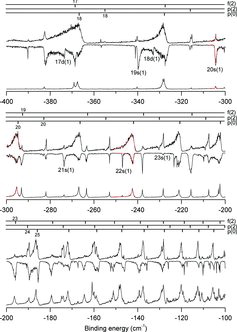
The autoionisation spectrum (bottom trace in and ) is dominated by the p(0) and f(2) series, which manifest themselves as well-defined peaks of similar intensity and linewidths scaling approximately as 1/n3, with weaker contributions from the s(1), d(1) and p(2) series. This pattern persists up to around −200 cm−1 where there is a general broadening of the peaks and a rise in the baseline towards −65 cm−1. The υ+ = 1 predissociation spectrum (inverted middle trace) is quite different: at low excitation energy from around −400 to −300 cm−1, there are intense, broad features attributable to the s(1), d(1) and p(2) series as well as the p(0) and f(2) series. Though hardly present at all in the ionisation spectra, the ns(1) lines are as intense as the np(0) and nf(2) lines in the υ+ = 1 dissociation spectrum. It is also worth pointing out that in the ionisation spectrum, the intensity in the range from −200 to −65 cm−1 is generally greater than that in the lower energy range between −400 cm−1 and −200 cm−1, while the opposite is observed in the υ+ = 1 dissociation spectrum and generally we observe more intense peaks below −200 cm−1. Also note that while the p(0) and f(2) series are dominant throughout the υ+ = 1 ionisation spectrum, unambiguous assignment of the s(1), d(1) and p(2) Rydberg series becomes difficult after around −225 cm−1 where the series approximately coincides. This is perhaps unsurprising in the case of the s and d series, since they are known to be strongly mixed [Citation39]. This mixing has not been taken into account in the Rydberg formula used for the combs.
The predissociation spectrum of Rydberg states converging to the υ+ = 0 ionisation limit is shown as the upper trace in and . There are three main Rydberg series, but the np(0) Rydberg states dominate the spectrum – they are the most intense and give rise to the broadest peaks. Members of this p(0) series exhibit distinctive asymmetric Fano lineshapes [Citation40] and the peaks appear relatively unperturbed by the other series. The p(2) series is reasonably strong, particularly at low n, but the linewidths of the np(2) states are considerably narrower than those of the np(0) states. The f(2) series is also clearly visible, but significantly weaker. The dominance of np states in the υ+ = 0 spectrum is unsurprising – the strong interaction of the p states with the B2Π and L2Π valence states that lead to predissociation has been well documented [Citation25,Citation29,Citation34,Citation41].
In both the υ+ = 0 and υ+ = 1 predissociation spectra, the p(2) series is most intense in the range n = 20–26, where the np(2) states sit on the low-energy side of members of the p(0) series. The np(2) states are found to be weak, or disappear entirely, over the range n = 27–45 where they sit on the high-energy side of members of the p(0) series. One possible explanation for this is that the decay pathways via the p(0) and p(2) states interfere with one another and this interference (constructive or destructive) is dependent on the relative energy separation and position. However, it is worth noting that we monitor dissociation only into the N(2D) channel, and it is possible that the p(2) series is more strongly coupled to a different dissociation channels in this energy range.
An interesting situation arises in the region of the spectrum from −170 to −130 cm−1. Here, the np(0) states still dominate the υ+ = 0 spectrum, as before, but make only a minor contribution to the υ+ = 1 spectrum, which is dominated by the p(2) and f(2) series. In fact, this effect is so pronounced that, in contrast to the rest of the υ+ = 1 spectrum, the 28p(0) and 29p(0) peaks have almost disappeared, i.e. decay by predissociation is negligible for these states. This could be a consequence of a valence interaction or an interference effect between the overlapping p(0) and p(2) Rydberg series.
From and , it is clear that resonances belonging to both the p(0) and f(2) series in all three spectra have distinct asymmetric lineshapes throughout this energy region. The asymmetric lineshapes observed in the experimental spectra arise from interferences between the resonance-mediated decay paths and the direct excitation paths to the ionisation and dissociation continua. For isolated peaks, these lineshapes are readily characterised in terms of Γ and q, where Γ is the linewidth and q is the corresponding Fano parameter or shape index [Citation40]. Briefly, if we assume that a single discrete state |nlN+⟩ interacts with a single continuum |ψω⟩, the line profile is given by
(1) where ϵ = 2(ω − ωn)/Γ is the reduced energy, ω is the photon energy and ωn is the resonance energy. Equation (1) does not hold for many of the strongly overlapping peaks for which a full multichannel quantum-defect theory (MQDT) analysis would be required to fit the observed lineshapes.
lists optimised parameters for autoionisation and predissociation derived from a least squares fit of Equation (1) to some of the experimental data. Resonances with lifetimes determined by the sum of decay probabilities through two competing decay channels are expected to have the same resonance energy and linewidth; therefore, the υ+ = 1 peaks for autoionisation and predissociation are fit with the same resonance energy and linewidth but different q, and the υ+ = 0 peaks are fit independently. The maximum and minimum q value in the fit was set to ±50. At this max/min value, the sign is unimportant and the peak is essentially Lorentzian and, therefore, symmetric. To give an idea of the quality of fit obtained, some of the retrieved lineshapes are plotted as red lines in .
Table 1. Parameters derived for selected resonances from the np(0), np(2), ns(1) and nf(2) series from least squares fitting of Equation (1) to the experimental data.
The fits provide a few notable observations: the shape index for a given autoionisation, predissociation pair in the υ+ = 1 spectrum are broadly similar, all pairs have the same skew direction with the ionising peaks being in general slightly more asymmetric, with both p series skewing to the red (q < 0), while the f and s series skew to the blue (q > 0). Comparing the υ+ = 0 and υ+ = 1 dissociation peaks, the υ+ = 0 peaks are much more asymmetric than their υ+ = 1 counterpart for all series. The υ+ = 0 p(0) peaks are much broader than their υ+ = 1 counterpart by a factor of around three, while all other series are broadly the same. There are two notable exceptions to these general observations; the 23f(2) state is much broader in υ+ = 1 than in the υ+ = 0, and the υ+ = 1 20s(1) dissociative state is much more asymmetric than the ionising state.
Although it is anticipated that resonances in the autoionisation and predissociation spectra can be fit to a single Fano profile with the width determined by the sum of the different decay rates, there appear to be regions in the spectrum where this is not the case. The most prominent examples are in the low-energy region of the spectrum between −400 and −300 cm−1 (). Here, we observe an apparent broadening of the peaks in the predissociation spectrum compared to those in the corresponding autoionisation spectrum. A possible explanation for this is that in this region the laser is scanning over multiple scattering states that lead to the N(2D) product with each one borrowing intensity from Rydberg states. In this case, the situation is no longer that of a discrete Rydberg state coupled to single ionisation and dissociation continua but becomes a multistate–multicontinuum scattering process.
4. Discussion
The asymmetric Fano lineshapes observed across the autoionisation and predissociation spectra are due to the interferences between different pathways to the ionisation or dissociation continua, respectively. Changes in the relative amplitudes and phases of the different pathways can lead to significant changes in the measured lineshape. In some regions of the spectra, highlighted in and described below, we observe peaks that cannot be described by Equation (1) but show enhanced yield in one channel at the expense of the other. In one region of the spectrum, this manifests itself as an effective ‘hole burning’ in a peak observed in the ionisation spectrum accompanied by a corresponding enhanced yield in the dissociation spectrum. In other regions, peaks that we expect to see prominently in both decay channels are observed only in one. This can be explained in terms of the phases of the individual states and continua that contribute to the complex resonance. Changes in the relative phases of the coherent superposition of states across the complex resonance will lead to a redistribution of population in either the ionisation or dissociation channels. This ‘molecular control’ might result in destructive interference in one decay channel and constructive interference in another, and opens up the intriguing possibility of being able to exploit shaped light fields to control the decay pathway.
shows specific portions of the experimental spectra where these effects are most dramatic and manifest themselves as a clear enhancement in intensity in one decay channel and a loss in the other. In , the υ+ = 1 autoionisation spectrum is plotted as a positive going trace above the υ+ = 1 predissociation spectrum. The predissociation spectrum mirrors the ionisation spectrum and is plotted as a negative going trace. (a) represents the energy range from −390 to −320 cm−1 in which the np(0) and nf(2) series are overlapped. Around −370 cm−1, the near resonance of the 18p(0) and 17f(2) states results in a maximum in the ionisation/dissociation channel appearing at a minimum in the dissociation/ionisation channel. Higher in energy near −330 cm−1, the relative proximity of the 19p(0) and 18f(2) states results in a peak in the ionisation channel occurring at a broad plateau in the dissociation spectra. In this region there are also broad, intense features attributable to the nd(1) and ns(1) states.
Figure 4 Enlarged regions of the Rydberg spectra plotted over the range (a) −390 to −320 cm−1, (b) −205 to −200 cm−1 and (c) −180 to −130 cm−1. The υ+ = 1 autoionisation spectrum is plotted as a positive going trace above the υ+ = 1 predissociation spectrum. The dissociation spectrum mirrors the ionisation spectrum and is plotted as a negative going trace. The regions highlight specific resonances that cannot be fit to Equation (1) and show particularly unusual lineshapes and/or intensities. For more detail see text.
(b) represents the energy range around the 24p(0) peak. Here, the nf(2) and np(0) lines are approximately interleaved, and as such there is little interaction between the two series. However, the weaker nd(1) states are nearly co-incident with the np(0) states, which is particularly noticeable at the 24p(0) resonance near −200 cm−1; the peak in the ionisation spectrum has a small dip in it which corresponds to an enhanced intensity in the dissociation spectrum. It is tempting to consider this in terms of constructive interference in the dissociation channel and destructive interference in the ionisation channel although the exact mechanism is not clear.
(c) covers the energy range where the 28p(0) and 29p(0) peaks are approximately resonant with the weaker nd(1), ns(1) and np(2) states. The effect of the extra states is dramatic – the intensity of the 28p(0) and 29p(0) states in the usually dominant dissociation channel is almost entirely removed and almost all of the population appears to decay through the ionisation channel. The usually weak np(2) states now dominate the dissociation spectrum together with the nf(2) series.
5. Summary
This paper presents a comparison of the spectroscopy of Rydberg states of NO, with principal quantum number n = 18–50, converging to the υ+ = 0 and 1 ionisation limits. The spectra have been assigned, where possible, and found to consist of contributions from the p(0), f(2), p(2), s(1) and d(1) series. The Fano profiles have been fitted to some members of the p(0), f(2), p(2) and s(1) series; the Fano shape parameter q and linewidths Γ have been obtained. Although only a minor contribution to the ionisation spectrum, the p(2), s(1) and d(1) series exhibit relatively intense features in the υ+ = 1 dissociation spectrum which is, in fact, in contrast to what might be expected from the propensity rules. The υ+ = 0 dissociation spectrum is dominated by the p(0) series and displays regular, broad Fano lineshapes throughout, along with contributions from the p(2) and f(2) series. In contrast, the υ+ = 1 dissociation spectrum has major contributions from a number of series: p(0), f(2), p(2), s(1) and d(1) with different series dominating different regions of the spectrum. The lineshapes of the p(0) series in the υ+ = 1 dissociation spectrum appear to be distorted by the high density of additional states in the spectrum and the intensity distribution is less regular.
Our general experimental observations are consistent with the detailed theoretical investigation of the competition between autoionisation and predissociation in NO by Giusti-Suzor and Jungen [Citation42]. Their calculations and analysis of earlier autoionisation and fluorescence spectra showed that autoionisation in NO is not primarily vibrational but is induced by the electronic Rydberg-valence interaction that is also responsible for predissociation. In this context, we interpret our observation that the υ+ = 0 spectrum is dominated by the p(0) series and that the υ+ = 1 spectrum has major contributions from p(0), f(2), p(2), s(1) and d(1) series in the following way: Vibrational excitation opens up the autoionisation channel which, because it competes with predissociation, suggests that the p(0) series autoionises more effectively than the other series. The contribution of the p(0) series to predissociation spectrum is reduced upon vibrational excitation, which allows the other series to become more visible. The distortion observed in some of the measured peaks is a much more complex problem. It is hoped that the experimental spectra presented in this paper will stimulate a detailed MQDT analysis of the effect of vibrational excitation on the predissociation dynamics of the entire Rydberg series, from the low-n regime investigated by Fujii and Morita to the higher n regime presented here.
Acknowledgements
R.S. Minns is grateful to UCL and the Ramsay Memorial Trust for a Research Fellowship.
Additional information
Funding
Related Research Data
References
- R.S. Minns, R. Patel, J.R.R. Verlet, and H.H. Fielding. Phys. Rev. Lett. 91, 243601 (2003).
- R.S. Minns, J.R.R. Verlet, L.J. Watkins, and H.H. Fielding, J. Chem. Phys. 119, 5842 (2003).
- J.R.R. Verlet and H.H. Fielding, Int. Rev. Phys. Chem. 20, 283 (2001).
- H.H. Fielding, Annu. Rev. Phys. Chem. 56, 91 (2005).
- P. Brumer and M. Shapiro, Chem. Phys. Lett. 126, 541 (1986).
- M. Shapiro and P. Brumer, J. Chem. Phys. 84, 4103 (1986).
- R.J. Gordon, L.C. Zhu, and T. Seideman, J. Phys. Chem. A 105, 4387 (2001).
- J.L. Herek, W. Wohlleben, R.J. Cogdell, D. Zeidler, and M. Motzkus, Nature 417, 533 (2002).
- V.I. Prokhorenko, A.M. Nagy, S.A. Waschuk, L.S. Brown, R.R. Birge, and R.J.D. Miller, Science 313, 1257 (2006).
- R.E. Carley, E. Heesel, and H.H. Fielding, Chem. Soc. Rev. 34, 949 (2005).
- A.T. Gilkison, C.R. Viteri, and E.R. Grant, Phys. Rev. Lett. 92, 173005 (2004).
- C.R. Viteri, A.T. Gilkison, and E.R. Grant, J. Chem. Phy. 126, 084301 (2007).
- C.R. Viteri, A.T. Gilkison, S.J. Rixon, and E.R. Grant, Phys. Rev. A 75, 013410 (2007).
- C.R. Viteri, A.T. Gilkison, F.S. Schroder, and E.R. Grant, Mol. Phys. 105, 1589 (2007).
- A. Kirrander and H.H. Fielding, J. Phys. B 40, 897 (2007).
- A. Kirrander, H.H. Fielding, and C. Jungen, J. Chem. Phys. 127, 164301 (2007).
- A. Kirrander, H.H. Fielding, and C. Jungen, J. Chem. Phys. 132, 024313 (2010).
- A. Kirrander, C. Jungen, and H.H. Fielding, J. Phys. B 41, 074022 (2008).
- A. Kirrander, C. Jungen, and H.H. Fielding, Phys. Chem. Chem. Phys. 12, 8949 (2010).
- M. Glass-Maujean, C. Jungen, H. Schmoranzer, A. Knie, I. Haar, R. Hentges, W. Kielich, K. Jankala, and A. Ehresmann, Phys. Rev. Lett. 104, 183002 (2010).
- M. Glass-Maujean, C. Jungen, G. Reichardt, A. Balzer, H. Schmoranzer, A. Ehresmann, I. Haar, and P. Reiss, Phys. Rev. A 82, 062511 (2010).
- C.R. Viteri, A.T. Gilkison, S.J. Rixon, and E.R. Grant, J. Chem. Phys. 124, 144312 (2006).
- A. Fujii and N. Morita, Chem. Phys. Lett. 182, 304 (1991).
- A. Fujii and N. Morita, J. Chem. Phys. 97, 327 (1992).
- A. Fujii and N. Morita, in Laser Techniques for State-Selected and State-to-State Chemistry, edited by C.Y. Ng (SPIE - Int. Soc. Optical Engineering, Bellingham, 1993), p. 184.
- A. Fujii and N. Morita, J. Chem. Phys. 98, 4581 (1993).
- A. Fujii and N. Morita, Laser Chem. 13, 259 (1994).
- A. Fujii and N. Morita, J. Chem. Phys. 103, 6029 (1995).
- B.B. Clarson, S.R. Procter, A.L. Goodgame, and T.P. Softley, Mol. Phys. 106, 1317 (2008).
- A.L. Goodgame, H. Dickinson, S.R. Mackenzie, and T.P. Softley, J. Chem. Phys. 116, 4922 (2002).
- M.J.J. Vrakking and Y.T. Lee, J. Chem. Phys. 102, 8818 (1995).
- R. Patel, N.J.A. Jones, and H.H. Fielding, Phys. Rev. A 76, 043413 (2007).
- R. Patel, N.J.A. Jones, and H.H. Fielding, J. Phys. B 40, 1369 (2007).
- N.J.A. Jones, R.S. Minns, R. Patel, and H.H. Fielding, J. Phys. B 41, 185102 (2008).
- V.G. Stavros, J.A. Ramswell, R.A.L. Smith, J.R.R. Verlet, J. Lei, and H.H. Fielding, Phys. Rev. Lett. 83, 2552 (1999).
- R.A.L. Smith, J.R.R. Verlet, E.D. Boleat, V.G. Stavros, and H.H. Fielding,Faraday Discuss. 115, 63 (2000).
- R.A.L. Smith, V.G. Stavros, J.R.R. Verlet, H.H. Fielding, D. Townsend, and T.P. Softley, J. Chem. Phys. 119, 3085 (2003).
- K. Kaufmann, C. Nager, and M. Jungen, Chem. Phys. 95, 385 (1985).
- S. Fredin, D. Gauyacq, M. Horani, C. Jungen, G. Lefevre, and F. Masnouseeuws,Mol. Phys. 60, 825 (1987).
- U. Fano, Phys. Rev. 124, 1866 (1961).
- M. Raoult, J. Chem. Phys. 87, 4736 (1987).
- A. Giusti-Suzor and C. Jungen, J. Chem. Phys. 80, 986 (1984).