
ABSTRACT
The crystal density of neutral and ionic molecular crystals is remarkably well approximated by the enclosed volume of molecular surfaces, where these surfaces are defined as regions of constant and small electron density. Several workers have proposed that estimates may be improved if one includes quantities extracted from the electrostatic potential on the surface of the molecule. The variation of the potential and the imbalance of positive and negative values have been considered to be of importance. In this study we demonstrate that whereas variation is important for improving crystal density predictions, imbalance is not. We present a density functional theory study on a set of 44 neutral molecular crystals. Ten-fold cross-validations were performed on models that incorporate variation, imbalance and combinations of both. Geometries were optimised using B3LYP and basis sets of type 6-31G(d). Electron densities and electrostatic potentials were computed with B3LYP and M05. Regardless of functional, models that correct for variation yield a relative decrease of 15%–18% in root-mean-square error of prediction. This correction appears to sharpen the error distribution about zero. Models based on imbalance yield no improvement, and we argue that it plays an insignificant role.
1. Introduction
The density is an important parameter for the detonation performance of a material. To a large extent, it determines the detonation velocity and detonation pressure [Citation1], quantities of great interest in the design and development of energetic materials [Citation2]. Theoretical prediction of the density is an attractive goal, not only because of its importance, but also because it avoids the high costs associated with synthesising and testing novel compounds.
Predicting the density of a crystal has turned out to be very difficult. One possible strategy is to make an attempt to determine the crystal structure, and subsequently deduce the density. Unfortunately, crystal structure prediction remains, in general, an unsolved problem [Citation3,Citation4]. A less ambitious but promising strategy consists of approximating the effective volume a molecule occupies in the crystal. This approach has been remarkably successful in the quantum mechanical setting, where estimates of the effective volume are given by enclosed volumes of surfaces of constant and small electron density [Citation5–8]. Denoting the crystal density by ρ, we can define the molecular volume V by
(1) where M is the mass of a single molecule. Here V is the effective volume of a molecule in the crystal, implying that it may differ from the intuitive measure of volume as space. In fact, V will be smaller or larger depending on factors affecting the crystal structure, for instance the molecular shape and intermolecular interactions. To a first approximation, V is simply the size of the molecule, and this can most definitely be estimated by quantum mechanics.
Bader et al. [Citation9] proposed that the surface of molecules may be represented by regions with a small and constant electron density
, defined as the probability density to find an electron at the position
. They suggested to apply surfaces on which
or 0.0010 a.u. The latter,
(2) has mostly been settled on in the literature [Citation5–8,Citation10–15], although it has been remarked that other surfaces would serve equally well as the molecular surface [Citation16–18]. Rice and coworkers [Citation5] found that V is exceptionally well approximated by the volume Vencl enclosed by
. They achieved a root-mean-square error (RMSE) within 4% of experimentally obtained densities for a set of 180 neutral molecular crystals comprised of carbon, hydrogen, nitrogen and oxygen. The molecular surface
was computed by density functional theory (DFT), applying the B3LYP functional and basis sets of type 6-31G(d,p).
Although no systematic errors were found in the Rice et al. [Citation5] study, it is clear that the arbitrary definition of as well as the particular choice of functional and basis set might lead to such errors. Politzer and coworkers [Citation6] observed that Vencl was systematically underestimated with the B3PW91 functional. Consequently, in order to correct for potential systematic errors, we will add a constant γ to Vencl:
(3) In the following, we will denote approximations of V by
. It is implicitly assumed in Equation (Equation3
(3) ) that if a systematic error is present, it is independent of the volume. Another option is to scale Vencl by some constant α, i.e.
, making the assumption that the error is proportional to the volume. One may also combine the two in
, but we have chosen to avoid this in order to keep the number of parameters to a minimum. The constant γ is absent in previous studies [Citation6–8], making the comparison to more complicated models unfair. Moreover, these complicated models have, in addition to proposed electrostatic corrections, both a scaling constant α and an overall constant γ. These facts naturally raise the question of whether their effectiveness is due to α and γ, or as reported, electrostatics.
Although the molecular volume V is well approximated by Vencl, Politzer and coworkers [Citation6] pointed out that the role of intermolecular electrostatic interactions are completely ignored. Building on previous work, they proposed that information about such interactions are present in the electrostatic potential , the electric potential felt by a unit charge positioned at
:
(4) Restricting the potential
to
on
, a number of studies have been conducted in which statistics from
assumed to be relevant for predicting some physical or chemical property have been extracted. Such properties include solubilities [Citation15,Citation19], impact sensitivities [Citation13,Citation14], partition coefficients [Citation20], crystal densities [Citation6–8], chemical inhibition [Citation16,Citation18], critical points and boiling points [Citation21], as well as sublimation enthalpies and solvation free energies [Citation17]. The procedure has been conceptually generalised as
(5) where Φ(i) are parameters computed from
restricted to
. Applied parameters Φ(i) in Equation (Equation5
(5) ) include the extrema of
, average values, variances and other measures of spread, and areas of negative and positive regions [Citation16]. The functional relationship f is unknown and has been termed a general interaction properties function (GIPF) [Citation11]. While it is our view that modelling based on
is a sensible approach that should be further explored, we consider much of the research based on Equation (Equation5
(5) ) to be inconclusive, because the performance of a model has often been equated with the extent to which it fits the data-set, with no consideration of the model’s complexity [Citation11–14,Citation16,Citation20–22]. The complexity may be taken into account by considering information criteria, such the Akaike information criterion (AIC) or Bayesian information criterion (BIC) [Citation23], providing more suitable quantities in the comparison of unvalidated models. Models should nevertheless be validated by testing them on unseen data-sets, for instance by test-set/training-set division, cross-validation or boot-strapping [Citation24].
In this paper we will investigate proposed electrostatic corrections to Vencl and identify the cause of the observed improvement. As such, the work presented provides a firm foundation on which to formulate more accurate models and to interpret the reported results. We begin by describing the quantities that have been applied as corrections. Brinck and coworkers [Citation25] introduced the ‘charge separation’ quantity Π, defined by
(6) A non-zero value of Π has been interpreted as a prerequisite for intermolecular interactions [Citation6]. In this equation, N is the number of points on the discretised surface
, and
is the average value of
on
. The quantity Π can also be identified as the mean absolute deviation from
, a measure of the spread about the mean. A related and more commonly used measure of variation is the standard deviation estimate [Citation26],
(7) a quantity that we will consider as an alternative to Π.Footnote1Politzer et al. [Citation19] proposed another measure of spread,
, in which negative and positive variances were treated separately:
(8) In this expression, the mean positive/negative
value on
is denoted
.
While the spread is a parameter that quantifies the variability of on
, other aspects may be important for intermolecular interactions. It has been suggested that one such aspect is the imbalance of negative and positive
values, the argument being that if significant imbalance is present, the probability for favourable intermolecular interactions diminishes [Citation7,Citation11,Citation17]. Murray and coworkers [Citation21] proposed to use the quantity
(9) for this purpose, a reasonable choice if σ2− and σ2+ correspond to ‘amounts’ of negative and positive values on
. A perhaps simpler way to construct a parameter signifying imbalance is to make use of well-known measures of the asymmetry of distributions. To define such a quantity, we thus apply the statistical notion of the coefficient of skewness [Citation27],
(10) It is our understanding of the term ‘imbalance’ that it should correspond to the ‘absolute skewness of
about the origin’. Consequently, we define an imbalance parameter Θ by first replacing
by zero in s, and then computing its absolute value. We will consider Θ as a possible correction to quantum mechanical volumes. To incorporate both variation and imbalance, Murray et al. [Citation21] combined these two aspects of
in the parameter
.
Politzer and coworkers [Citation6] reasoned that the likelihood of attractive intermolecular interactions is maximised when the imbalance is close to zero (ν is large) and the variation is considerable ( is large). With this interpretation, the molecules for which
is large are the ones that one would expect to be more closely packed in the solid than suggested by their volume. They therefore investigated two models for predicting the crystal density, one correcting for variation, and one correcting for both variation and imbalance:
(11)
(12) Fitting these equations to a set of 36 CHNO compounds, the training-set RMSE obtained was 0.053 g/cm3 for Equation (Equation11
(11) ), and 0.047 g/cm3 for Equation (Equation12
(12) ). The uncorrected Vencl yielded an RMSE of 0.068 g/cm3. In an evaluation [Citation8], Equation (Equation12
(12) ) was validated on a training-set and test-set consisting of 180 and 38 CHNO compounds, respectively. They found a mean absolute error (MAE) of 0.035 g/cm3, compared to 0.050 g/cm3 for the uncorrected Vencl. To our knowledge, Π has never been validated. But it does deserve such a test, given that the training-set RMSE obtained by Politzer and coworkers [Citation6] was very similar for Π and
.
While it has been noted [Citation16–18] that the particular choice of surface should be of minor importance, this claim has important mathematical consequences severely restricting the space of permissible parameters Φ used in linear models. This is the subject of a recent paper [Citation28], in which we present a proof of the following. Consider a linear model of the form
(13) For such a model to make the same predictions on a range of surfaces
of electron density ε, the parameter values of Φ computed on
and
must be linearly related to each other. This requirement is independent of the modelled property, and hence of considerable importance for all attempts to apply molecular surface parameters in modelling. We tested the mathematical requirement in the particular case of imbalance and variation, showing that whereas variation (Φ = σ, Π) satisfies it in the electron density range [0.0001 a.u., 0.0040 a.u.], imbalance (Φ = ν, Θ) does not. This implies, in particular, that the model in Equation (Equation16b
(16b) ) will fail to make the same predictions on these surfaces. The surface
is illustrated in .
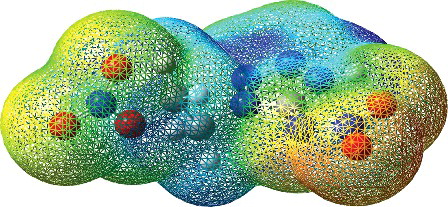
Figure 1. The electron density isosurface for compound 1 with the B3LYP functional. The illustration was produced with the GaussView 4.1 software [Citation29].
![Figure 1. The electron density isosurface for compound 1 with the B3LYP functional. The illustration was produced with the GaussView 4.1 software [Citation29].](/cms/asset/9dcade21-66be-49e8-8082-39f0eb4ea9af/tmph_a_1158420_f0001_oc.jpg)
2. Procedure
We study a set of 44 neutral molecular crystals. Among these, 23 have empirical formula of the form CxHyNzOw, six of the form CxHyOz and four can be written CxNyOz. The remaining 11 compounds also contain carbon, hydrogen, nitrogen and oxygen, but some of them contain either chlorine, phosphor or sulphur. These latter compounds were included to shed some light on the composition-dependence of the studied models, and, in particular, to investigate the suggestion by Rice et al. that the density of halogen-containing compounds might be much less accurately estimated by their volume (10%–40%) [Citation5]. An overview of the compounds is given in the Supporting Information . The experimental densities were obtained from the SciFinder database [Citation30].
Table 1. Model prediction errors (RMSEP). All volumes are given in units of cm3/mol.
Table 3. Fitted parameters for the enclosed volume estimates and the models including Π and σ corrections. The AICc values are listed with respect to the model the lowest value. The unit of β is cm3/(mol Hartree) and the unit of γ is cm3/mol.
Molecular geometry optimisations were performed with the GAUSSIAN03 Revision E.01 software [Citation31], applying DFT with the B3LYP functional and basis sets of type 6-31G(d). Adopting the approach of Qiu et al. [Citation32], we constructed the initial geometries using no information of the molecular geometry in the crystal. This procedure was different from that of Rice et al. [Citation5,Citation8] who selected the initial geometry as that of the crystal, thereby minimising the error caused by an inaccurate guess of the initial geometry, leading to a good volume estimate on which to add further corrections. It is of course also of interest to be able to predict the density for novel or notional compounds for which there exists no crystalline data. The viability of this approach rests on the assumption that geometries are, for the most part, of sufficiently small importance for the resulting volume estimate.
We performed single-point calculations with the B3LYP and M05 functionals in the search for possible functional dependencies of the volume estimates and the electrostatic parameters. The electron density and the electrostatic potential
were evaluated on a 100 by 100 by 100 grid. Points were identified as being on the surface
with a tolerance of 10−4 a.u., yielding 6000–10, 000 points for each molecule. The statistical quantities Π, σ2−, σ+2, σ and Θ were subsequently evaluated on this surface, and UCSF Chimera [Citation33] was applied to find the enclosed volume Vencl.
Five models for the molecular volume V are presented. While earlier studies have proposed models where corrections are linear in ρ [Citation6–8], we will continue to assume linearity in our models of V. First, we study the uncorrected model
(14) Equation (Equation14
(14) ) will provide a good reference to ascertain the efficiency of the more complicated models. These have been selected to identify the factor responsible for the reported improvement from electrostatic considerations [Citation6–8]. We consider two models that correct for the variation of
:
(15a)
(15b) We also investigate whether the imbalance of positive and negative
values is a relevant factor, both in combination with variation (
) and as a potential correction in its own right (Θ):
(16a)
(16b) The models which include the quantities Π and
suggested by Politzer et al. [Citation6] are Equations (Equation15a
(15a) ) and (Equation16a
(16a) ), respectively. Although the predictions of the model based on Θ will be altered with changes in the surface [Citation28], we have included it for the purpose of ascertaining its usefulness on the particular
surface.
Due to the relatively small set of 44 compounds, we performed a 10-fold cross-validation for each model. Dividing the set into 10 separate folds, the models were trained using 9 out of 10 folds in 10 consecutive runs. In each run i, we computed the root-mean-square error of prediction (RMSEP), defined by [Citation24]
(17) In this equation, N is the number of predicted compounds in the given run, and Vexp the experimental molecular volume, as determined by Equation (Equation1
(1) ) from the experimental density ρexp. The model RMSEP was then taken to be the average error of prediction of the 10 consecutive runs:
(18)
3. Results and discussion
The main results of our work can be divided into two parts. We begin by studying the predictive ability of the models that include electrostatic corrections based on variation, imbalance and the combination of the two. Subsequently we take a closer look at the relation of to variation measures, such as
, Π and σ, arguing that the success of
is due to variation and not imbalance.
3.1. Predictive ability
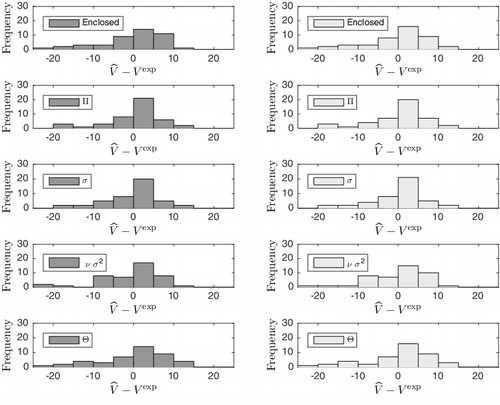
In this section, we review the results of the 10-fold cross-validation. The predictive ability of the models, given in terms of their RMSEP values, is shown in .
The best performing models are those based on the variation parameters Π and σ, i.e. Equations (Equation15a(15a) ) and (Equation15b
(15b) ). Compared to the uncorrected enclosed volume estimates, the Π and σ parameters show a 15% and 18% relative decrease in RMSEP, respectively, regardless of functional. Moreover, it is evident that the imbalance-variation parameter
leads to no improvement over the simpler variation parameters Π and σ. Since applying imbalance as a linear term leads to inconsistent predictions on different surfaces [Citation28], it is not surprising that Θ performs poorly, yielding no improvement over uncorrected volume estimates. Employing the surface invariant skewness s′ about zero (see [Citation28]) in
leads to no improvement over Θ = |s′|; however, we believe this is due to its irrelevance to the problem at hand. This is in contrast to Θ, where the poor performance is likely attributable to its non-linear variability with changes in the molecular surface. In conclusion, our study provides evidence in favour of the view that the variation of
on the molecular surface is related to the error of naive volume estimates. Furthermore, the findings clearly indicate that the imbalance of negative and positive
values is of no relevance, as this factor does not improve upon variation parameters and appears to be of no use on its own.
In order to investigate the observed changes in RMSEP further, we inspected the error distributions of the models, see . Observe that the effect of Π and σ sharpens the peak of the error distribution, causing more compounds to be estimated within 5 cm3/mol of experiment. The tails are left mostly unchanged. Considering B3LYP, the σ correction increases the number of compounds within 5 cm3/mol from 22 to 27 for Π and to 29 for σ. The figures are similar for the M05 functional. The similar accuracy of the two functionals is due to the fact that they agree to a high extent on the value of the parameters (R2 > 0.99) and that their volume estimates Vencl are very similar on the B3LYP geometries (standard deviation equal to 0.25 cm3/mol). It should be noted, however, that the functionals might disagree to a significant extent if the optimisations are done independently. Thus, if one observes a considerable functional dependence, one may expect that this is mainly due to their influence on the optimised geometry.
Figure 2. Error distributions of the models. The M05 distributions are illustrated in dark grey, while those of B3LYP are light grey. The errors are given in cm3/mol.
A concern that must be addressed is that optimised geometries of isolated molecules will differ from the molecular geometries in the crystal. To address this issue, we compared our values with those obtained by Rice et al. [Citation5,Citation8], as they ran the optimisation using the geometry of the compound in the crystal as the initial guess. Their values for the four compounds in common with our study are in good agreement with our data, the deviations being less than 1 cm3/mol, see . We also achieve comparable accuracy, with our estimates yielding for Equations (Equation14(14) ) and (Equation15b
(15b) ) a mean average error of 0.070 and 0.054 g/cm3 from the experimental densities, compared to the respective values 0.050 g/cm3 (Vencl) and 0.035 g/cm3 (
) obtained by Rice and coworkers [Citation8]. Although a more extensive study is required to draw definite conclusions, we note that the considerable agreement and comparable accuracy suggest that crystal densities are in many cases effectively predicted without any knowledge of the molecular geometry in the solid. It may be that our results underestimate the importance of the initial geometry in general, however. We note that many of the compounds studied have limited conformational freedom to change as a consequence of the altered environment in the solid.
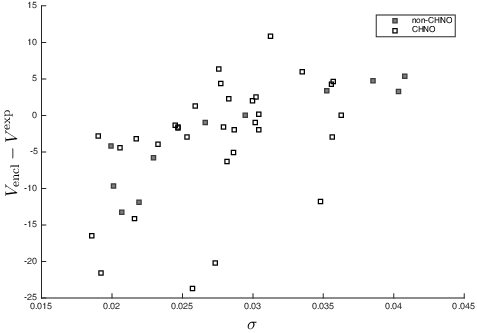
Since the parameters considered in previous studies [Citation6–8] have only been applied to CHNO compounds, we decided to look closer at the σ values of non-CHNO compounds, see . The effectiveness of variation (here given by σ) is evident from the figure, as it is seen that the higher the variation of the potential , the more likely Vencl is an overestimate. This is consistent with the interpretation given by Politzer et al. [Citation6], who suggested that variation of
makes attractive intermolecular interactions more likely, causing the molecules to be closer in the solid than one would expect from their volume. While the non-CHNO compounds appear to be accurately described by both
and σ, as compared to the CHNO systems, we note that the three compounds of highest σ all contain sulphur. A more extensive study is thus needed to ascertain the domain of validity of the variation parameter σ.
Figure 3. The error of the enclosed volume estimates Vencl plotted against σ. Non-CHNO compounds are shown in dark grey, and CHNO compounds in light grey. The values of σ and Vencl were computed with the M05 functional and are given in units of Hartree and cm3/mol, respectively.
For future reference and use, we have fitted the uncorrected models as well as those corrected with Π and σ for B3LYP, see . It should be kept in mind that these models, being based on all compounds, have not been validated. For this reason, we have also listed their AIC values, corrected for sample size (AICc). A rule-of-thumb lends ‘substantial support’ (<2) to the Π and σ corrected models, but ‘essentially no support’ (>10) to the uncorrected model [Citation23].
3.2. The possible irrelevance of imbalance
We have demonstrated that the imbalance-variation parameter leads to no noticeable improvement over the simpler variation parameters Π and σ. Our work suggests that the findings of Rice and Byrd [Citation8] is due to the close relation of
to
, a measure of variation. A comparison of the two reveals R2 to be about 0.75, see .
Figure 4. The values of plotted against the variation quantities σ2 (top) and
(bottom). All values are given in Hartree2.
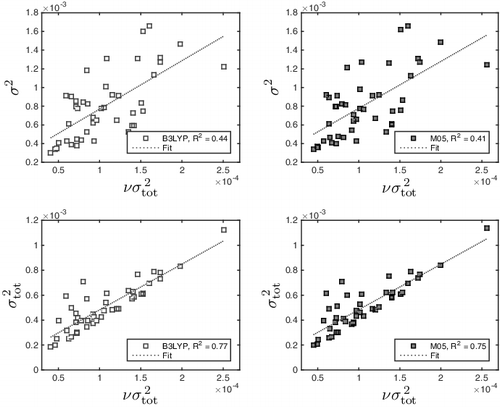
Furthermore, since is a measure of spread, it is also related to Π and σ. Considering the relation of
to σ2, we found a correlation coefficient of R2 = 0.40–0.45. Though not particularly high, it might be sufficiently high for both of them to correct for the same aspect of
, namely variation. Politzer et al. [Citation6] reported R2 = 0.68 between Π and
, but concluded that this value was sufficiently low for them to signify different aspects of
. While it is true that ν might be a small correction, there is as yet no evidence for this, neither in our results nor in the work of Politzer and coworkers [Citation6]. The slight decrease in the training set RMSE is not significant (0.053–0.047 g/cm3). We therefore conclude that ν is adding noise, not correcting.
This discussion has presupposed that Θ or ν are suitable measures of imbalance. We note that they are at the very least consistent with each other, as they have been shown to be in fair agreement [Citation28]. By this we mean that, if the absolute skewness Θ is zero, it is likely that the imbalance parameter ν is equal to 0.25 (indicating no imbalance). Similarly, as Θ increases, the value of ν is seen to decrease.
4. Conclusions and summary
In agreement with previous studies, the enclosed volume of surfaces of small electron density is seen to efficiently predict the crystal density of neutral molecular crystals. Moreover, we have found that, even when the geometry is not taken to be the one experimentally found in the solid, the predictive ability is largely maintained. Our work shows that the presence of other atoms than carbon, hydrogen, nitrogen and oxygen does not result in a breakdown of the method, as the eleven such compounds studied are equally well approximated as the CHNO systems. Our study presents evidence in favour of the view that variation of the electrostatic potential (measured by the standard deviation and related quantities) on the surface of the molecule is responsible for small but possibly significant corrections to quantum mechanical volumes. Applying two measures of variation, we obtained a relative decrease in RMSEP of 15%–18%. The corrections sharpen the error distribution peak, yielding more predictions within 5 cm3/mol of experiment.
The imbalance of the electrostatic potential on the surface of molecules is demonstrated to be irrelevant for the prediction of crystal densities. First, when used as a linear term, it leads to no improvement over the uncorrected estimates. In view of the fact that imbalance yields inconsistent predictions on different surfaces [Citation28], this finding is not surprising. Second, when combined with the variation of the electrostatic potential, it does not improve predictions compared to the simpler corrections based on variation alone. The previously reported success of imbalance combined with variation is therefore likely due to variation alone, i.e. the role of imbalance is to add noise rather than to correct.
Supp_mat_A_Critical_Investigation_Eirik_Fadum.rar
Download (190.2 KB)Supplemental data for this article can be accessed here: http://dx.doi.org/10.1080/00268976.2016.1158420.
Disclosure statement
No potential conflict of interest was reported by the authors.
Notes
1. We have used the unbiased estimator of the standard deviation, dividing by N − 1 instead of N. This choice does not affect the results since N is greater than 6000 in our calculations.
Related Research Data
References
- M.J. Kamlet and S.J. Jacobs, J. Chem. Phys. 48 (3), 23–35 (1968).
- T.M. Klapötke, Chemistry of High-Energy Materials (Walter de Gruyter, Berlin, 2012).
- A. Gavezzotti, Acc. Chem. Res. 27 (10), 309–314 (1994).
- S.M. Woodley and R. Catlow, Nat. Mater. 7 (12), 937–946 (2008).
- B.M. Rice, J.J. Hare, and E.F.C. Byrd, J. Phys. Chem. A 111 (42), 10874–10879 (2007).
- P. Politzer, J. Martinez, J.S. Murray, M.C. Concha, and A. Toro-Labbé, Mol. Phys. 107 (19), 2095–2101 (2009).
- P. Politzer, J. Martinez, J.S. Murray, and M.C. Concha, Mol. Phys. 108 (10), 1391–1396 (2010).
- B.M. Rice and E.F.C. Byrd, J. Comput. Chem. 34 (25), 2146–2151 (2013).
- R.F.W. Bader, M.T. Carroll, J.R. Cheeseman, and C. Chang, J. Am. Chem. Soc. 109 (26), 7968–7979 (1987).
- A.F. Jalbout, Z.Y. Zhou, X. Li, M. Solimannejad, and Y. Ma, J. Mol. Struct. 664–665, 15 (2003). ISSN 0166-1280.
- J.S. Murray, T. Brinck, P. Lane, K. Paulsen, and P. Politzer, J. Mol. Struct. 307, 55 (1994). ISSN 0166-1280.
- H. Hagelin, J.S. Murray, P. Politzer, T. Brinck, and M. Berthelot, Can. J. Chem. 73 (4), 483–488 (1995).
- J.S. Murray, M.C. Concha, and P. Politzer, Mol. Phys. 107 (1), 89–97 (2009).
- J.S. Murray, P. Lane, and P. Politzer, Mol. Phys. 93 (2), 187–194 (1998).
- P. Politzer, J.S. Murray, P. Lane, and T. Brinck, J. Phys. Chem. 97 (3), 729–732 (1993).
- P. Politzer, J.S. Murray, and Z. Peralta-Inga, Int. J. Quant. Chem. 85 (6), 676–684 (2001).
- P. Politzer and J.S. Murray, Theor. Chem. Acc. 108 (3), 134–142 (2002).
- T. Brinck, P. Jin, Y. Ma, J.S. Murray, and P. Politzer, J. Mol. Model. 9 (2), 77–83 (2003). ISSN 1610-2940.
- P. Politzer, P. Lane, J.S. Murray, and T. Brinck, J. Phys. Chem. 96 (20), 7938–7943 (1992).
- T. Brinck, J.S. Murray, and P. Politzer, J. Org. Chem. 58 (25), 7070–7073 (1993).
- J.S. Murray, P. Lane, T. Brinck, K. Paulsen, M.E. Grice, and P. Politzer, J. Phys. Chem. 97 (37), 9369–9373 (1993).
- T. Brinck, J.S. Murray, and P. Politzer, Int. J. Quant. Chem. 48 (2), 73–88 (1993). ISSN 1097-461X.
- K.P. Burnham and D.R. Anderson, Socio. Meth. Res. 33 (2), 261–304 (2004).
- R. Wehrens, Chemometrics with R: Multivariate Data Analysis in the Natural Sciences and Life Sciences (Springer, Heidelberg, 2011).
- T. Brinck, J.S. Murray, and P. Politzer, Mol. Phys. 76 (3), 609–617 (1992).
- W. Ledermann, E. Lloyd, Handbook of Applicable Mathematics. Vol. VI: Statistics, Part A. (Wiley, New York, NY, 1984).
- G.A. Korn and T.M. Korn, Mathematical Handbook for Scientists and Engineers: Definitions, Theorems, and Formulas for Reference and Review (Dover Publications, New York, NY, 2000).
- E.F. Kjønstad, J.F. Moxnes, T.L. Jensen, and E. Unneberg, Mol. Phys. doi:10.1080/00268976.2016.1140842 (2016).
- R. Dennington, T. Keith, and J. Millam, Gaussview Version 4.1 (Semichem Inc. Shawnee Mission KS, 2007).
- Scifinder, Chemical Abstracts Service (Columbus, OH, 2014).
- M.J. Frisch, G.W. Trucks, H.B. Schlegel, G.E. Scuseria, M.A. Robb, J.R. Cheeseman, J.A. Montgomery, Jr., T. Vreven, K.N. Kudin, J.C. Burant, J.M. Millam, S.S. Iyengar, J. Tomasi, V. Barone, B. Mennucci, M. Cossi, G. Scalmani, N. Rega, G.A. Petersson, H. Nakatsuji, M. Hada, M. Ehara, K. Toyota, R. Fukuda, J. Hasegawa, M. Ishida, T. Nakajima, Y. Honda, O. Kitao, H. Nakai, M. Klene, X. Li, J.E. Knox, H.P. Hratchian, J.B. Cross, V. Bakken, C. Adamo, J. Jaramillo, R. Gomperts, R.E. Stratmann, O. Yazyev, A.J. Austin, R. Cammi, C. Pomelli, J.W. Ochterski, P.Y. Ayala, K. Morokuma, G.A. Voth, P. Salvador, J.J. Dannenberg, V.G. Zakrzewski, S. Dapprich, A.D. Daniels, M.C. Strain, O. Farkas, D.K. Malick, A.D. Rabuck, K. Raghavachari, J.B. Foresman, J.V. Ortiz, Q. Cui, A.G. Baboul, S. Clifford, J. Cioslowski, B.B. Stefanov, G. Liu, A. Liashenko, P. Piskorz, I. Komaromi, R.L. Martin, D.J. Fox, T. Keith, M.A. Al-Laham, C.Y. Peng, A. Nanayakkara, M. Challacombe, P.M.W. Gill, B. Johnson, W. Chen, M.W. Wong, C. Gonzalez, and J.A. Pople, Gaussian 03, Revision E.01. (Gaussian, Inc., Wallingford, CT, 2007).
- L. Qiu, H. Xiao, X. Gong, X. Ju, and W. Zhu, J. Hazard. Mater. 141 (1), 280–288 (2007). ISSN 0304–3894.
- E.F. Pettersen, T.D. Goddard, C.C. Huang, G.S. Couch, D.M. Greenblatt, E.C. Meng, and T.E. Ferrin, J. Comput. Chem. 25 (13), 1605–1612 (2004).