
ABSTRACT
The A1Π(v = 0) level of 12C18O has been reinvestigated using three different high-resolution spectroscopic methods: (1) 2 + 1′ resonance-enhanced multiphoton ionisation of the A1Π − X1Σ+(0, 0) band using narrowband lasers in a Doppler-free geometry; (2) Fourier-transform emission spectroscopy in the visible range probing the B1Σ+ − A1Π(0, 0) band in a discharge; (3) Fourier-transform absorption spectroscopy in the vacuum-ultraviolet range measuring the A1Π − X1Σ+(0, 0) and B1Σ+ − X1Σ+(0, 0) bands at multiple temperatures ranging from 90 to 900 K. An effective-Hamiltonian analysis of A1Π, v = 0 levels was performed up to J = 44 which quantitatively addresses perturbations by the e 3Σ−(v = 1), d3Δ(v = 4), a′3Σ+(v = 9), D 1Δ(v = 0), and I 1Σ−(v = 0, 1) levels.
1. Introduction
Spectroscopy of the carbon monoxide molecule and, in particular, its pronounced 4th-positive or A1Π − X1Σ+system has been investigated repeatedly since the 1920s, beginning with Birge [Citation1] and Herzberg [Citation2]. It is a benchmark system for analysing perturbations in diatomic molecules. A comprehensive theoretical framework for such analysis of perturbations in the A1Π state was developed by Field et al. [Citation3,Citation4]. The A1Π state of the specific 12C18O isotopomer has been investigated via emission spectroscopy of the B1Σ+ → A1Π Ångström bands [Citation5,Citation6], the C1Σ+ → A1Π Herzberg bands [Citation7], and the E1Π → A1Π Kȩpa–Rytel system [Citation8,Citation9], and in absorption via the A1Π ← X1Σ+ system using vacuum-ultraviolet (VUV) absorption [Citation10–12]. These experiments reveal multiple non-Born–Oppenheimer interactions of the A1Π state with several other states, which do not themselves readily appear in experimental spectra: d3Δ, e 3Σ−, a′3Σ+, D 1Δ, and I 1Σ−. Previously, Beaty et al. [Citation12] used their high-resolution A1Π → X1Σ+ emission spectra to model the interaction of the A1Π(v = 0 − 9) levels with these states and deduced deperturbed molecular constants. VUV-laser excitation studies on the A1Π → X1Σ+ system for 12C18O have been performed as well [Citation13,Citation14].
Other spectroscopic studies involving 12C18O have focused on the B1Σ+ − X1Σ+ system [Citation15], on transition oscillator strengths [Citation16,Citation17], and on the measurement of lifetimes [Citation18,Citation19]. The spectroscopy of the 12C18O ground state has been studied to high accuracy in microwave [e.g. Citation20,Citation21] and far infrared (FIR) experiments [e.g. Citation22]. A comprehensive analysis was made by Coxon and Hajigeorgiou [Citation23] leading to a very accurate model for the ground-state in CO isotopologues expressed in terms of molecular parameters.
The present investigation is one of a series analysing perturbations in low-v levels of the A1Π state in detail for various isotopologues. These studies have provided a highly accurate description of the level energies and the corresponding perturbations of the A1Π state in the 12C16O main isotopologue [Citation24–27], and in the 13C16O [Citation28], 12C17O [Citation29] and 13C17O [Citation30] isotopologues. One goal of this work is to quantify the electronic isotope shifts in the A1Π state and determine whether it shows anomalous behaviour in common with observations of the a 3Π state [Citation31,Citation32]. The new spectroscopic measurements of A1Π(v = 0) state presented here are necessary to obtain the precision required to probe this effect.
The general methodology of this work is similar to our recent studies of other CO isotopologues [Citation28–30]. Three spectroscopic techniques are employed: Doppler-free two-photon laser spectroscopy of the A1Π − X1Σ+(0, 0) band, Fourier-transform emission spectroscopy in the visible range on the B1Σ+ − A1Π(0, 0) band, and Fourier-transform absorption spectroscopy in the VUV range on the A1Π − X1Σ+(0, 0) and B1Σ+ − X1Σ+(0, 0) bands. The first technique provides transition frequencies with ultrahigh accuracy and the latter two provide high-resolution broadband measurements. These independent measurements of the level energy separations for all combinations of X1Σ+(v = 0), A1Π(v = 0), and B1Σ+(v = 0) levels provide a check on the absolute frequency uncertainties estimated for each experiment.
Based on this variety of complementary spectroscopic experiments, accurate level energies are determined for the rotational levels of A1Π(v = 0) and B1Σ+(v = 0) and some levels in the perturbing d3Δ(v = 4), e 3Σ−(v = 1) and a′3Σ+(v = 9) states. None of the latter states support allowed transitions in our spectra due to spin and orbital angular momentum selection rules, but appear due to their spin–orbit and rotational–electronic (L-uncoupling) interactions with A1Π(v = 0). An effective Hamiltonian is used to model the level structures and to determine deperturbed molecular constants for each of the states. Mutual interactions, as well as interactions with some more remote levels are included in the Hamiltonian matrix, leading to an accurate reproduction of the measured level energies to within experimental accuracy.
Hereafter, we abbreviate vibrational levels and transitions, for example, A1Π(v = 0) and B1Σ+−X1Σ+(v′ = 0, v″ = 0) to A(0) and B−A(0, 0). Rotational branches for transitions involving triplet states are labelled in the tables, presented in this paper, as, e.g. Q21fe, indicating a ΔJ = 0 transition with an upper-state f-symmetry F2 level and lower-state e-symmetry F1 level. The important cases are the d3Δ and e 3Σ− states for which the F1, F2, and F3 rotational stacks correspond to Hund's case (a) levels with J = N − 1, N, and N + 1, respectively. There exist e- and f-symmetry versions of all Fi levels of d3Δ whereas e 3Σ− is restricted to the pairs (F1, e), (F2, f) and (F3, e).
2. 2 + 1′ REMPI laser spectroscopy
2.1. Experimental details
A narrowband tunable pulsed dye amplifier laser system at LaserLaB Amsterdam [Citation33] was used in a molecular beam study. Doppler-free spectra of the A-X(0,0) band of 12C18O were recorded using counter-propagating laser beams of ultraviolet (UV) radiation perpendicularly crossing a molecular beam of 18O isotopically enriched carbon monoxide (Sigma Aldrich, 99.9% 12C and 95% 18O). The excited molecules were ionised by a second pulse-time-delayed laser at 202 nm, forming a 2 + 1′ resonance enhanced multiphoton ionisation (REMPI) process. Signal detection was established by monitoring 30 amu ions in a time-of-flight mass spectrometer. An accurate frequency calibration was performed by simultaneously measuring a saturated absorption spectrum of molecular iodine with reference to pre-calibrated I2 resonances [Citation34] and a stabilised etalon, as was done in previous experiments with other CO isotopologues [Citation26,Citation27]. The measured transition frequencies of the two-photon resonances were corrected for frequency chirp effects in the pulsed dye amplifier [Citation26,Citation33,Citation35] and extrapolated to zero intensity to correct for AC Stark effects [Citation25]. These procedures yielded two-photon transition frequencies with an accuracy of 0.001 cm−1, which corresponds to 30 MHz. This error estimate is composed of contributions from frequency chirp, absolute frequency calibration, and the AC-Stark extrapolation, in order of importance.
2.2. Results
shows a recording of the R(2) two-photon transition in the A−X(0, 0) band of 12C18O. The I2 saturation spectrum used for absolute calibration and the transmission intensity from the stabilised etalon are also shown. The latter exhibits a low finesse at the wavelength of the fundamental, λ = 617 nm, but after fitting a sine function through the markers this does not contribute significantly to the calibration uncertainty. In the 12C18O molecular beam expansion only the lowest J-values can be probed due to rotational cooling. Accurate transition frequencies were measured for 10 lines in the two-photon spectrum and their results are listed in .
Figure 1. Recording of the R(2) two-photon transition in the A1Π − X1Σ+(0, 0) band of 12C18O measured by 2 + 1′ REMPI (red points and fitted black curve). The lower blue and black lines represent etalon markers and the saturated absorption spectrum of I2 used for frequency interpolation and calibration. The asterisk indicates the a13 (7,7) hyperfine component of the B-X (10,3) R(81) iodine line at 16 189.695 59 cm−1 [Citation34] that was used for calibration.
![Figure 1. Recording of the R(2) two-photon transition in the A1Π − X1Σ+(0, 0) band of 12C18O measured by 2 + 1′ REMPI (red points and fitted black curve). The lower blue and black lines represent etalon markers and the saturated absorption spectrum of I2 used for frequency interpolation and calibration. The asterisk indicates the a13 (7,7) hyperfine component of the B-X (10,3) R(81) iodine line at 16 189.695 59 cm−1 [Citation34] that was used for calibration.](/cms/asset/1d1358cf-1136-44cd-a372-43ec28b2cd44/tmph_a_1356477_f0001_oc.jpg)
Table 1. Rotational transition frequencies,1 νobs, the deviations between observed values and calculated values from a fit to the entire data set involving all laser, FT-emission and FT-absorption lines Δobs.-calc., and AC-Stark slope coefficient2, CAC, of A1Π − X1Σ+(0, 0) in 12C18O as measured in the 2 + 1′ REMPI laser experiment.
After the laser spectroscopic measurements on 12C18O, a separate measurement was performed to correct for the chirp phenomenon [Citation26]. Typical values for the chirp-induced shift were −18(5) MHz at the fundamental frequency. Even after quantitative assessment of this contribution to the systematic frequency shift it remains the major source of uncertainty in the error budget for frequencies listed in .
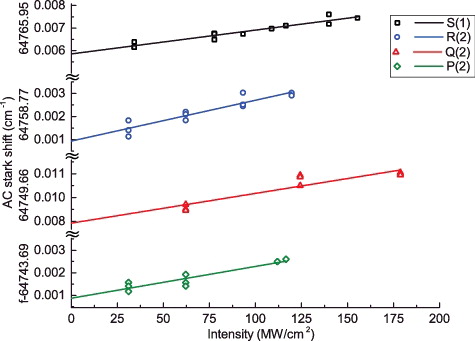
The transition frequencies of all lines were measured under various intensities of the laser field, providing information for making AC-Stark plots. These are shown in for four lines plotted against an absolute scale of laser intensity in the focal region. The uncertainty of the absolute intensity value may be as large as 25%, the relative intensities are accurate within 10%, allowing for an extrapolation to zero intensity to obtain an AC-Stark-free transition frequency. The values listed in include such an extrapolation. An AC-Stark slope parameter CAC was also determined for most lines, representing the proportionality between the laser intensity in units of MW/cm2 and the AC-Stark induced line shift. For the Q(1) and Q(3) lines only indicative values for the slopes were measured. On average a value of CAC = 0.41 (10) is found for the two-photon lines in the A−X(0, 0) band of 12C18O. This value falls within a factor of two of that found in an early high-power study of the AC-Stark effect in CO [Citation36]. Results on dynamic polarisabilities may provide information on the structure and internal dynamics in molecules, but will not be discussed further in this paper, which focuses on high resolution spectra and perturbations in the excited state.
Figure 2. AC-Stark-plots for four transitions measured by two-photon Doppler-free spectroscopy in the A1Π − X1Σ+(0, 0) band of 12C18O.
3. Fourier-transform emission in the visible range (VIS-FT)
3.1. Experimental details
Visible (VIS) wavelength emission spectra of 12C18O were recorded at the University of Rzeszów using an air-cooled, carbon hollow-cathode (HC) lamp operated at 780 V, 54 mA dc. The lamp was filled with a static mixture of 18O2 and 16O2 (Sigma-Aldrich, 98.1% 18O2) at a pressure of 3 mbar. During the discharge process, the O2 molecules react with the 12C atoms ejected from the carbon filler placed inside the cathode, thus forming 12C18O and 12C16O molecules in the gas phase, in sufficient amounts to achieve a signal-to-noise ratio (SNR) of 70: 1 for the 12C18O spectrum. For the current experiment, we used an improved version of the HC lamp with respect to previous investigations [Citation37,Citation38]. A higher temperature dc-plasma (up to 900 K) was obtained at the centre of the cathode and allowed for observations of B−A(0, 0) rotational transitions with J as high as 40. The associated line-broadening increased by only 0.02 cm−1 relative to previous studies [Citation39,Citation40], in which a dc-plasma temperature of about 650 K was used.
The discharge glow was focused by a plano-convex quartz lens onto the entrance aperture (1.0 mm diameter) of a 1.71 m Fourier-transform (FT) spectrometer [Citation28,Citation30]. A recent modification of this spectrometer significantly reduced the reflection of the HeNe laser beam, used for calibration and control of the position of a movable retroreflecting mirror, from optical elements in the interferometer and detector compartments, and noticeably improved its sensitivity in the VIS and UV regions. A visible-wavelength quartz beamsplitter and a photomultiplier tube running in integration mode were used to record the 12C18O B−A(0, 0) spectrum between 22,100 and 22,900 cm−1. The spectrometer was operated under vacuum conditions (pressure below 0.003 mbar). Emission spectra were accumulated over 128 scans to obtain the desired SNR with a spectral resolution of 0.018 cm−1. Under these settings the observed widths of 12C18O lines did not depend on the spectrometer resolution, but were limited by the Doppler broadening, yielding linewidths of 0.1 cm−1. The molecular gas composition used to obtain the spectrum was 12C18O: 12C16O = 1:0.1.
The spectrum was frequency calibrated using the 633 nm line of an internal frequency-stabilised HeNe laser. The central positions of emission lines were measured by fitting Voigt lineshape functions to the experimental spectrum using a least-squares fitting procedure. The estimated absolute calibration uncertainty (1σ) is 0.003 cm−1. The fitting uncertainty of the line frequency measurements is estimated to be 0.003 cm−1 for single medium-strength lines and 0.01–0.02 cm−1 for weak and/or blended ones.
3.2. Results
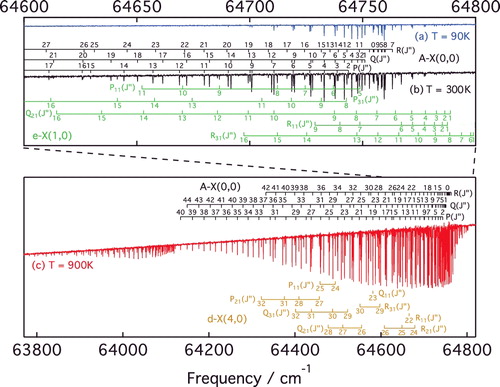
An overview of the wavelength region studied in VIS-emission (437–452 nm), together with rotational assignments and a simulated spectrum, is shown in . In this spectrum some 12C18O B−A (0, 0) lines are blended with 12C16O B−A (0, 0) as well as with lines from B−A (1, 1) bands of 12C18O and 12C16O. This contamination was taken into consideration during the analysis of the spectral lines in the 12C18O B−A (0, 0) band. In total, we assigned and analysed 168 molecular emission lines of 12C18O, among which 119 belong to B−A (0, 0) band, and 49 to the so-called ‘extra lines” associated with the B1Σ+ − e3Σ−(0, 1), B1Σ+ − d3Δ(0, 4) and B1Σ+ − a′3Σ+(0, 9) transitions terminating on perturber states and gaining intensity from mixing with the A1Π state. Wavenumbers of the 12C18O B−A (0, 0) band are listed in and transition frequencies of the extra lines are presented in .
Figure 3. High resolution emission spectrum with rotational assignments of the 12C18O B1Σ+ − A1Π (0, 0), B1Σ+ − e3Σ− (0, 1), B1Σ+ − d3Δ (0, 4), and B1Σ+ − a′3Σ+ (0, 9) bands recorded with the VIS-FT spectrometer. Upper trace: experimental spectrum; Lower trace: simulation of 12C18O B1Σ+ − A1Π (0, 0) obtained with the Pgopher software [Citation41]. Lines indicated by red labels represent J-values with the strongest perturbations.
![Figure 3. High resolution emission spectrum with rotational assignments of the 12C18O B1Σ+ − A1Π (0, 0), B1Σ+ − e3Σ− (0, 1), B1Σ+ − d3Δ (0, 4), and B1Σ+ − a′3Σ+ (0, 9) bands recorded with the VIS-FT spectrometer. Upper trace: experimental spectrum; Lower trace: simulation of 12C18O B1Σ+ − A1Π (0, 0) obtained with the Pgopher software [Citation41]. Lines indicated by red labels represent J-values with the strongest perturbations.](/cms/asset/8bdeae7a-9c8d-4cc7-88aa-40f734bbf6aa/tmph_a_1356477_f0003_oc.jpg)
Table 2. Transition frequencies of the 12C18O B1Σ+ − A1Π (0, 0) band obtained in the VIS-FTS experiment.1
Table 3. Spin-forbidden lines appearing in the VIS-FT absorption spectra.1
4. Fourier-transform absorption in the vacuum ultraviolet (VUV-FT)
The Fourier-transform (FT) vacuum ultraviolet (VUV) spectrometer on the DESIRS beamline at the SOLEIL synchrotron was used to record spectra of the A−X(0, 0) and B−X(0, 0) bands of 12C18O. Its operation and performance have already been described in detail [Citation42,Citation43] as well as its application for the measurement of CO spectra [Citation24,Citation27,Citation44].
4.1. A1Π ← X1Σ+(0, 0)
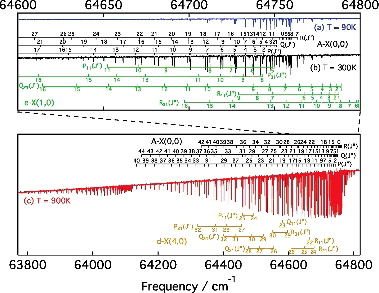
shows three absorption spectra of A−X(0, 0) recorded with successively greater sample temperatures and column densities. The quasi-static CO gas was outflowing from a windowless cell under three different temperature regimes: liquid-nitrogen cooled (90 K), room temperature (300 K) and a heated cell (900 K) [Citation45]. Doppler-broadening of the observed spectral lines increases at higher temperatures and limits the accuracy of line-center measurements. The advantage of high-temperature spectra is that more rotational states can be probed, in the present study up to J = 41. Analysis of the combined spectra permitted precise frequency measurements for strong A−X(0, 0) lines and much-weaker forbidden transitions. Lines arising from the A−X(1, 1) hot band are also evident in (c) between 63,800 and 64,130 cm−1.
Figure 4. Spectra of the A−X(0, 0) band, and perturbing e3Σ− − X1Σ+(1,0) and d3Δ − X1Σ+(4,0) bands, recorded with the VUV-FT spectrometer at the SOLEIL synchrotron for three different sample temperatures, T = 90 K, T = 300 K and T = 900 K, as indicated.
The integrated cross sections of all lines were optimised to best fit the 900 K spectrum after application of the Beer–Lambert law to their Doppler broadened summation. This required consideration of the sinc-shaped instrumental broadening of the VUV-FT instrument, with a full-width half-maximum of 0.27 cm−1 (a higher spectral resolution, 0.07 cm−1, was adopted while recording 90 and 300 K spectra). To improve the fitting of blended lines, the spectra were analysed while assuming combination differences of P- and R-branch transitions fixed to known ground state term values [Citation23]. Also, no perturbers of A(0) have dipole-allowed transitions to the ground state and we assumed no intensity-interference effects afflicting A−X(0, 0) P- and R-branch lines with common J′, which might otherwise arise from the mixing of parallel and perpendicular transition moments [Citation46]. Under this assumption, the relative strengths of P(J′ + 1) and R(J′ − 1) lines are then given by the ratio of their Hönl–London factors and a Boltzmann distribution of ground state J″ level populations [Citation47,Citation48].
Linearity of the FT frequency scale is intrinsically reliable, being dictated by the macroscopic interferometrically controlled stepping of a mirror in the wave-front-division interferometer. An absolute frequency calibration of the A−X(0, 0) spectrum was obtained by comparison with our two-photon absorption laser-based measurements of low-J A1Π − X1Σ+ lines, described in Section 2. This required consideration of the parity of excited levels probed in one- and two-photon absorption because of significant Λ-doubling of the A1Π state. The estimated accuracy of this absolute calibration is 0.0015 cm−1. The final list includes 126 rotational transitions of A−X(0, 0), and 73 spin-forbidden lines associated with the e3Σ− − X1Σ+(1,0) and d3Δ − X1Σ+(4,0) bands. All measured frequencies are listed in and .
Table 4. Transition frequencies of A1Π − X1Σ+(0, 0) from the VUV-FT experiment.1
Table 5. Spin-forbidden lines arising in the VUV-FT absorption spectra.1
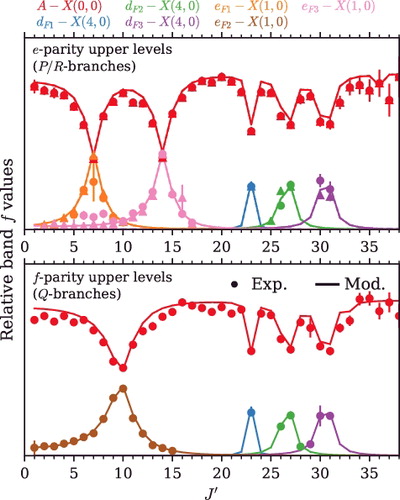
In the zero-order model, only the A−X(0, 0) band provides any oscillator strength and has a J′/J″-independent band f-value when dividing by the Hönl– London factors for a 1Π − 1Σ+ transition [Citation47,Citation48]. After level mixing is considered, some transitions to d(4) and e(1) levels borrow intensity by mixing with nearby A(0) levels.
The integrated cross sections of A−X(0, 0) lines were converted into band f-values by factorising their ground state populations and Hönl–London transition factors and are shown in . Band f-values will be J′ independent in the absence of perturbations, whereas A−X(0, 0) shows locally reduced f-values due to intensity borrowing by levels of d3Δ − X1Σ+(4,0) and e3Σ− − X1Σ+(1,0). The integrated cross sections of extra lines of d3Δ − X1Σ+(4,0) and e3Σ− − X1Σ+(1,0) were converted into band f-values assuming Hönl–London factors for a 1Π − 1Σ+ transition and are also shown in . The summation of transitions to all interacting levels is J′ independent and represents the unperturbed A−X(0, 0) band f-value. For P/R branch transitions connected to e-symmetry excited levels J′ = 7 and 14 the admixture of A(0) into the F3 component of e(1) is nearly 50%, indicated by the equal sharing of intensity. The f-symmetry J′ = 10 levels of A(0) and e(1) are similarly affected.
Figure 5. Intensity sharing between A1Π − X1Σ+(0, 0) and overlapping bands. Band f-values for all transitions were calculated assuming the Hönl-London factors for a 1Π − 1Σ+ transition. Points / error bars: experimental data (circles: P/Q branches, triangles: R branch). Lines: Results of the deperturbation model.
4.2. B1Σ+ ← X1Σ+(0, 0)
A spectrum of the B−X(0, 0) absorption band near 115 nm is shown in , recorded with the FT-VUV instrument set at a spectral resolution of 0.11 cm−1. A list of experimental transition energies is given in . Transition energies measured from this spectrum were combined with the VIS-FT spectrum of A−X(0, 0) to arrive at absolute term values for A(0), which can be compared with those derived from the REMPI laser experiment. Additionally, the direct measurement of small perturbations in the B(0) energy levels, indicated with (*) in , prevented these from being misinterpreted in B−A(0, 0) spectra as arising from A(0). The nature of levels interacting with B(0) interactions is beyond the scope of the current work and will be subsequently studied.
Figure 6. Photoabsorption spectrum of B1Σ+ − X1Σ+(0, 0) band with a sample temperature of 1000 ± 100 K. The B−X(1, 1) band also appears due to the higher temperature. The overall intensity slope is due to the continuum profile of the synchrotron beam. Also shown is the residual difference of the experimental spectrum and its modelled profile. Residuals are plotted on the same scale as the spectrum.
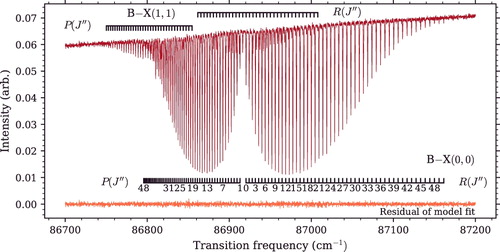
Table 6. Transition frequencies of B1Σ+ − X1Σ+(0, 0) in 12C18O from the VUV-FT experiment.1
An absolute frequency calibration of the spectrum containing B−X(0, 0) was made with respect to NIST data for several lines of atomic Kr, Xe and H2 contaminating the spectrum. These lines were induced by absorption upstream in the synchrotron beam line at the location of the gas filter used for discriminating the harmonics produced by the undulator [Citation43]. Since these lines are Doppler broadened under static gas conditions there should be no shift of their centre frequencies. Lines of 12C18O itself, previously measured in several high-resolution laser-based experiments [Citation18,Citation19,Citation49] concerning B−X(0, 0) and other well-known transitions E1Π − X1Σ+(1,0) and C1Σ+ − X1Σ+(1,0) were used for calibration as well. The estimated accuracy of this absolute calibration is 0.02 cm−1.
5. Perturbation analysis
The CO A1Π state, especially its v = 0 level, has one of the more complicated rotational structures among low-lying states of diatomic molecules due to the multiple rotational-electronic (L-uncoupling) and spin–orbit perturbations that affect it. The spin–orbit interactions of A(0) with the e 3Σ−(v = 1), d3Δ(v = 4) and a′3Σ+(v = 9) levels, as well as electronic– rotational interactions with D 1Δ(v = 0) and I 1Σ−(v = 0, 1) are responsible for these irregularities.
The rotational term values of 12C18O A1Π(v = 0) are plotted in in reduced form. The crossing term series of e 3Σ−(v = 1), d3Δ(v = 4), a′3Σ+(v = 9), and D 1Δ(v = 0) are also indicated and are associated with shifts of the A(0) energy levels. The strongest perturbation of A(0) rotational structure is due to spin–orbit interaction with the e 3Σ−(v = 1) at low J and is associated with a large splitting of e- and f-symmetry levels. An accurate treatment of this interaction is essential for determining a deperturbed value for the A(0) term origin and its mass dependence. All three spin substates of the d3Δ(v = 4) level strongly perturb A(0) at mid-J. The F3 substate induces the largest shifts because of the Hund's case (a) selection rule limiting the spin–orbit interaction of 1Π and 3Δ states to their Ω = 1 components, in this case the F3 level of the inverted d3Δ. Relaxation of this rule by spin-rotational mixing then permits the further interactions with F1 and F2 levels. The A(0)–a′(9) interaction is weaker, with associated level shifts of ∼0.5 cm−1 occurring between J = 33 and 39.
Figure 7. Reduced term values (in cm−1) of the 12C18O A1Π (v = 0) level and the perturbing rovibronic levels.
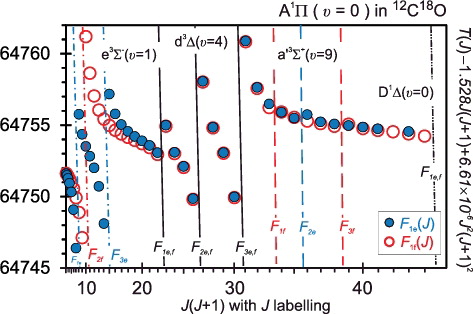
When comparing the perturbations evident in with similar data and figures addressing other isotopologues (e.g. 12C16O [Citation25,Citation50], 13C16O [Citation28,Citation51], and 13C17O [Citation30]) the crossings of A(0) with higher-v e(1), d(4), a′(9) levels all occur at decreasing J with increasing reduced-mass, μ, as is expected from the proportionality of first-order isotope shifts. Conversely, the level crossings of A(0) and D(0) occur at higher J for higher mass because of the smaller vibrational constant, ωe, of D 1Δ.
To quantify the interaction energies and deperturbed molecular constants of all directly and indirectly observed levels we employ the same methodology as Niu et al. [Citation25] and Hakalla [Citation30] applied to other isotopologues. We used 476 transition frequencies obtained from the laser, VIS-FT and VUV-FT studies of A−X(0, 0), B−A(0, 0) and B−X(0, 0) transitions and their satellite extra lines. We computed level energies and transition frequencies in a matrix diagonalisation of all interacting levels. The effective Hamiltonian used has matrix elements described in Niu et al. (see Table 6 in [Citation25]) and the deperturbation was performed using the Pgopher software [Citation41]. The interpretation of the interaction parameters ξ and η was also discussed in [Citation25] and in [Citation29]. The rotational structure of the ground state was fixed to the 12C18O constants of Coxon and Hajigeorgiou [Citation23] throughout the analysis in the present paper and are listed in a footnote to .
Table 7. Deperturbed molecular parameters of 12C18O for the A(0) state and its perturbers, and B(0).a, b Perturbation parameters as discussed in Refs. [Citation25,Citation29].
The different sets of experimental data have different accuracies so we use relative weights to integrate them into a single molecular-parameter fit. A relative weight of 5 is assigned to data obtained from 2 + 1′ REMPI laser spectroscopy; 2 to isolated and strong lines in the VIS-FTS spectrum, and 1–0.5 for weak and/or blended transitions and 1 to isolated and strong lines in the the VUV-FTS spectrum and 0.5–0.1 to weak and/or blended transitions.
Fitted deperturbed molecular constants and interaction parameters are given in with the same parameter definitions as in Niu et al. [Citation25]. The root-mean-square error (RMSE) of unweighted transition-frequency residuals is 0.014 cm−1 after finalising the deperturbation fit. This measure of the overall quality-of-fit of the model to the experimental data is dominated by uncertainty in the least accurate B1Σ+ − X1Σ+(0, 0) lines. This demonstrates an overall high level of agreement between the experimental and model frequencies. A correlation matrix was calculated during the least-squares fitting procedure and checked to ensure satisfactorily low correlation coefficients between the model parameters.
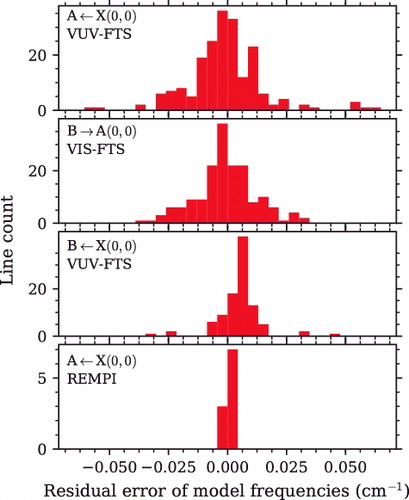
shows the residual error of the deperturbation model when compared with experimental frequencies. Histograms for each data-set contributing to the deperturbation fit have a width representative of the random uncertainties for each experiment. As expected, the laser-absorption REMPI frequencies are least scattered; all values are within 0.003 cm−1 (see ). The greater scatter of VUV-FTS data in the A−X(0, 0) region relative to B−X(0, 0) is due to a combination of the somewhat better instrumental resolution adopted for measurements of the latter and the greater number of weak and overlapped lines present in the former. A small +0.005 cm−1 bias of the VUV-FTS B−X(0, 0) model residuals indicates a slight disagreement of the absolute calibration of this experiment relative to the others with a superior calibration to the REMPI laser experiment. Actually, under optimal conditions the VUV-FTS experiment is limited to an accuracy of 0.01 cm−1 [Citation24], which is significantly larger than the systematic offset found here.
Figure 8. Residual error of modelled line frequencies after deperturbation, shown separately for each experimental measurement. The histograms consist of residuals for the main bands and all observed extra lines.
Modelled energies for all bands and excited-state term values are given as an online data archive. All bands and levels are extrapolated to J = 60 but increasing errors are expected for levels which are not well constrained by the observed lines and crossings. There are also archived experimental spectra and the Pgopher input file used to perform our deperturbation.
The level mixing deduced from deperturbing the interaction of A(0) and its perturbers also provides a means to calculate the linestrength borrowed by extra lines that appear in the experimental B→A and A←X spectra. Modelled band f-values are compared with A←X(0, 0) absorption f-values in and show good agreement, further validating the deperturbation model deduced from level energies.
The careful absolute calibration of our laser-based measurements with respect to the ground state energy means that the value for the deperturbed A(0) Tv constant can be determined at high accuracy. Least-squares fitting of the deperturbation model returns a statistical uncertainty of 0.0006 cm−1 for this parameter. However, this statistical uncertainty is smaller than the 0.001 cm−1 absolute frequency uncertainty of our data (tied to the REMPI-laser experiment) and we conclude that the estimated uncertainty of T0 is 0.001 cm−1. We list all residual differences of laser-measured and modelled frequencies in and these show agreement between 0.0001 and 0.003 cm−1.
A deperturbation analysis of 12C18O A(0) and perturbers was previously performed by Beaty et al. [Citation12] based on comprehensive emission spectra of A−X(0, 0) and extra lines from perturbing states, with their deperturbed constants also listed in . A similar scale of experimental information was used in that previous work but with frequency uncertainties of 0.05 cm−1 or more. Our new measurements, with uncertainties between about 0.001 and 0.02 cm−1, enable the determination of more constants defining the A(0) and perturber levels than previously, and with better precision. All comparable parameters show consistency between this work and that of Beaty et al. [Citation12], given their estimated uncertainties, apart from the A(0) and d(4) term origins and the ηA(0) ∼ d(4) interaction parameter. The Tv discrepancies likely arise from correlation of this parameter with high-order rotational constants and our inclusion of an additional constant, H, relative to Beaty et al. [Citation12].
Some parameters in are experimentally determined for the first time, for example, the ξ parameters that control the L-uncoupling matrix elements ⟨A(0)|J+L−|D(0)⟩ and ⟨A(0)|J+L−|I(1)⟩. We do not experimentally observe spectral lines associated with D(0) nor I(1) and their avoided crossings with A(0) occur above our highest-observed J level. Fixed molecular constants representing the D(0) and I(1) levels are nevertheless included in our perturbation analysis by isotopically rescaling their electronic-state equilibrium constants found in the literature [Citation52–55]. The D(0)– A(0) and I(1)–A(0) interaction parameters then exhibit quantitatively well-defined values ξA(0) ∼ D(0) = 0.0229(48) cm−1 and ξA(0) ∼ I(1) = 0.0944(24) cm−1 when included in the deperturbation optimisation. The ξA(0) ∼ D(0) parameter is consistent within its uncertainty with a value calculated from the isotopically invariant rotational-interaction parameter determined by Lefloch et al. [Citation50] (parameter b in their Table IV). A similar mass-scaling calculation is described by Hakalla [Citation30]. The newly determined ξA(0) ∼ I(1) does not show such good agreement, differing by 36% from its rescaled value. This may be due to a poorer determination of this parameter in our deperturbation than suggested by its estimated uncertainty. The crossing point of A(0) and I(1) rotational series in 12C18O occurs near J = 49 while the maximum J of our experimentally constrained term values is significantly lower J = 44, suggesting the possibility of some uncertainty.
The isotopologue-independent A1Π∼a′3Σ+ perturbation parameter has a typical magnitude for spin–orbit interactions in CO [Citation30], 84.02(10) cm−1, and the weakness of the fitted A(0)– a′(9) interaction energy is then due to a relatively small overlap of vibrational wavefunctions. We calculate a normalised value for this matrix element, using the method of Refs. [Citation29,Citation30] and find a value similar to other CO isotopologues, e.g. 0.070 and 0.072 with respect to 12C17O and 13C17O.
6. Conclusion
Three different state-of-the-art techniques were employed to gather transition frequencies of the A1Π − X1Σ+(0, 0), B1Σ+ − X1Σ+(0, 0), and B1Σ+ − A1Π(0, 0) bands in 12C18O with the highest resolution and accuracy obtained to date. The spectra show many extra lines probing optically forbidden transitions to the d3Δ(4), e 3Σ−(1), and a′3Σ+(9) levels, due to their interaction with A1Π(0) by spin-orbit and rotational-electronic L-uncoupling. This spectroscopic data was included into an effective Hamiltonian model of all observed levels and their interactions.
Lines probing the d3Δ(4), e 3Σ−(1), and a′3Σ+(9) triplet state perturbers were observed directly, while interactions with the further remote perturber states D 1Δ(0) and I 1Σ−(1) were found to measurably affect the A(0) term values. As expected, the extents and strengths of perturbations arising in A1Π(0) in 12C18O level are similar to the cases of 12C16O [Citation25], 13C16O [Citation28], and 13C17O [Citation30].
The deperturbed term origin of A1Π(v = 0) is found with a precision of 0.001 cm−1. This term origin will be compared with our past and future measurements in other CO isotopologues to determine the precise magnitude of the A1Π − X1Σ+(0, 0) electronic isotopic shift.
Sup-mat-Perturbations_in_the_A-Trivikram.zip
Download Zip (31.3 KB)Acknowledgments
The authors are grateful to the general and technical staff of SOLEIL for providing beam time under project numbers 20120653 and 20160118. This work was supported by Dutch Astrochemistry Program of NWO. R. Hakalla thanks LASERLAB-EUROPE for support of this research (grant numbers EUH2020-RIP-654148 and EC's-SPF-284464) as well as European Regional Development Fund and the Polish state budget within the framework of the Carpathian Regional Operational Programme (RPPK.01.03.00-18-001/10) through the funding of the Center for Innovation and Transfer of Natural Science and Engineering Knowledge of the University of Rzeszów. A.N. Heays was supported for this work by the postdoctoral fellowship program of PSL Research University Paris. W. Ubachs acknowledges financial support from the European Research Council (ERC) under the European Union's Horizon 2020 research and innovation programme (grant agreement number 670168). R.W. Field thanks the US National Science Foundation (grant number CH3-1361865) for support of his research, which includes substantial collaborations.
Disclosure statement
No potential conflict of interest was reported by the authors.
Additional information
Funding
Related Research Data
References
- R.T. Birge, Phys. Rev. 28, 1157–1181 (1926).
- G. Herzberg, Zeitschr. f. Physik 52, 815–845 (1929).
- R.W. Field, S.G. Tilford, R.A. Howard, and J.D. Simmons, J. Mol. Spectr. 44(2), 347–382 (1972).
- R.W. Field, B.G. Wicke, J.D. Simmons, and S.G. Tilford, J. Mol. Spectr. 44(2), 383–399 (1972).
- M. Rytel, Acta Phys. Polon. A 38, 299 (1970).
- J. Janjić, J. Danielak, R. Kepa, and M. Rytel, Acta Phys. Polon. A 41, 757 (1972).
- J. Janjić, L.U. C̆onkić, D.S. Pes̆iś, R. Kepa, and M. Rytel, J. Mol. Spectr. 72(2), 297–300 (1978).
- R. Kepa, M. Rytel, and Z. Rzeszut, Acta Phys. Polon. A 54, 355–361 (1978).
- R. Kepa, Acta Phys. Hung. 60, 227–237 (1986).
- C. Haridass, S.P. Reddy, and A.C. Le Floch, J. Mol. Spectr. 168(2), 429–441 (1994).
- C. Haridass, S.P. Reddy, and A.C. Le Floch, J. Mol. Spectr. 167(2), 334–352 (1994).
- L.M. Beaty, V.D. Braun, K.P. Huber, and A.C. Le Floch, Ap. J. Suppl. Ser. 109(1), 269 (1997).
- C.M. Steinmann, E.G. Rohwer, and H. Stafast, Astrophys. J. Lett. 590(2), L123 (2003).
- A. du Plessis, E.G. Rohwer, and C.M. Steenkamp, Astrophys. J. Suppl. Ser. 165(1), 432 (2006).
- M. Eidelsberg, J.Y. Roncin, A.L. Floch, F. Launay, C. Letzelter, and J. Rostas, J. Mol. Spectr. 121(2), 309–336 (1987).
- G. Stark, A.N. Heays, J.R. Lyons, P.L. Smith, M. Eidelsberg, S.R. Federman, J.L. Lemaire, L. Gavilan, N. de Oliveira, D. Joyeux, and L. Nahon, Astroph. J. 788(1), 67 (2014).
- M. Eidelsberg, J.L. Lemaire, S.R. Federman, G. Stark, A.N. Heays, L. Gavilan, J.R. Lyons, P.L. Smith, N. de Oliveira, and D. Joyeux, Astron. Astroph. 566, A96 (2014).
- P. Cacciani, W. Ubachs, P.C. Hinnen, C. Lyngå, A. L’Huillier, and C.G. Wahlström, Astroph. J. Lett. 499(2), L223 (1998).
- W. Ubachs, I. Velchev, and P. Cacciani, J. Chem. Phys. 113(2), 547 (2000).
- G. Klapper, F. Lewen, R. Gendriesch, S.P. Belov, and G. Winnewisser, Zeitschr. für Naturf. A 56(3–4), 329–332 (2014).
- G. Cazzoli, C. Puzzarini, and A.V. Lapinov, Astrophys. J. Lett. 592(2), L95 (2003).
- P. de Natale, M. Inguscio, C.R. Orza, and L.R. Zink, Astroph. J. Lett. 370, L53–L55 (1991).
- J.A. Coxon and P.G. Hajigeorgiou, J. Chem. Phys. 121(7), 2992–3008 (2004).
- E.J. Salumbides, M.L. Niu, J. Bagdonaite, N. de Oliveira, D. Joyeux, L. Nahon, and W. Ubachs, Phys. Rev. A 86, 022510 (2012).
- M.L. Niu, E.J. Salumbides, D. Zhao, N. de Oliveira, D. Joyeux, L. Nahon, R.W. Field, and W. Ubachs, Mol. Phys. 111, 2163–2174 (2013).
- M.L. Niu, F. Ramirez, E.J. Salumbides, and W. Ubachs, J. Chem. Phys. 142, 044302 (2015).
- M.L. Niu, E.J. Salumbides, A.N. Heays, N. de Oliveira, R.W. Field, and W. Ubachs, Mol. Phys. 114(5), 627–636 (2016).
- M.L. Niu, R. Hakalla, T.M. Trivikram, A.N. Heays, N. de Oliveira, E.J. Salumbides, and W. Ubachs, Mol. Phys. 114(19), 2857–2867 (2016).
- R. Hakalla, M.L. Niu, R.W. Field, E.J. Salumbides, A.N. Heays, G. Stark, J.R. Lyons, M. Eidelsberg, J.L. Lemaire, S.R. Federman, M. Zachwieja, W. Szajna, P. Kolek, I. Piotrowska, M. Ostrowska-Kopec, R. Kepa, N. de Oliveira, and W. Ubachs, Roy. Soc. Chem. Adv. 6, 31588–31606 (2016).
- R. Hakalla, M.L. Niu, R.W. Field, A.N. Heays, E.J. Salumbides, G. Stark, J.R. Lyons, M. Eidelsberg, J.L. Lemaire, S.R. Federman, N. de Oliveira, and W. Ubachs, J. Quant. Spectr. Rad. Transfer 189, 312–328 (2017).
- A.J. de Nijs, E.J. Salumbides, K.S.E. Eikema, W. Ubachs, and H.L. Bethlem, Phys. Rev. A 84, 052509 (2011).
- A.J. de Nijs, D. Zhao, H.L. Bethlem, H. Linnartz, and W. Ubachs, J. Mol. Spectr. 292, 20–22 (2013).
- W. Ubachs, K.S.E. Eikema, W. Hogervorst, and P.C. Cacciani, J. Opt. Soc. Am. B 14(10), 2469–2476 (1997).
- S. Xu, R. van Dierendonck, W. Hogervorst, and W. Ubachs, J. Mol. Spectr. 201, 256–266 (2000).
- E.E. Eyler, A. Yiannopoulou, S. Gangopadhyay, and N. Melikechi, Opt. Lett. 22, 49–51 (1997).
- B. Girard, N. Billy, J. Vigue, and J.C. Lehmann, Chem. Phys. Lett. 102(2–3), 168–173 (1983).
- R. Hakalla, W. Szajna, and M. Zachwieja, J. Phys. B 45(21), 215102 (2012).
- R. Hakalla, M. Zachwieja, and W. Szajna, J. Phys. Chem. A 117(47), 12299–12312 (2013).
- R. Hakalla, Roy. Soc. Chem. Adv. 4, 44394–44407 (2014).
- R. Hakalla, M. Zachwieja, and W. Szajna, J. Quant. Spectr. Rad. Trans. 140, 7–17 (2014).
- C.M. Western, Pgopher: a program for simulating rotational structure (University of Bristol, Bristol, 2017).
- N. de Oliveira, M. Roudjane, D. Joyeux, D. Phalippou, J.C. Rodier, and L. Nahon, Nat. Photon. 5(3), 149–153 (2011).
- N. de Oliveira, D. Joyeux, M. Roudjane, J.F. Gil, B. Pilette, L. Archer, K. Ito, and L. Nahon, J. Synch. Rad. 23, 887–900 (2016).
- J.L. Lemaire, M. Eidelsberg, A.N. Heays, L. Gavilan, S.R. Federman, G. Stark, J.R. Lyons, N. de Oliveira, and D. Joyeux, J. Phys. B 49(15), 154001 (2016).
- M.L. Niu, A.N. Heays, S. Jones, E.J. Salumbides, E.F. van Dishoeck, N. de Oliveira, L. Nahon, and W. Ubachs, J. Mol. Spectr. 315, 137–146 (2015).
- H. Lefebvre-Brion and R.W. Field, The Spectra and Dynamics of Diatomic Molecules (Elsevier, Amsterdam, 2004).
- M. Larsson, Astron. Astrophys. 128, 291–298 (1983).
- G. Herzberg, Molecular Spectra and Molecular Structure I: Spectra of Diatomic Molecules, 2nd ed. (Krieger Publishing Company, New York, NY, 1989).
- M. Drabbels, J. Heinze, J.J. Ter Meulen, and W.L. Meerts, J. Chem. Phys. 99(8), 5701–5711 (1993).
- A.C. Le Floch, F. Launay, J. Rostas, R.W. Field, C.M. Brown, and K. Yoshino, J. Mol. Spectr. 121(2), 337–379 (1987).
- C. Haridass and K.P. Huber, Astroph. J. 420, 433–438 (1994).
- C. Kittrell and B.A. Garetz, Spectrochim. Acta 1(45), 31–40 (1989).
- R.W. Field, Ph. D. thesis, Harvard University, 1971.
- S.G. Tilford and J.D. Simmons, J. Phys. Chem. Ref. Data 1, 147–188 (1972).
- K.P. Huber and G. Herzberg, Constants of diatomic molecules. (Van Nostrand Reinhold, New York, NY, 1979).