
 ?Mathematical formulae have been encoded as MathML and are displayed in this HTML version using MathJax in order to improve their display. Uncheck the box to turn MathJax off. This feature requires Javascript. Click on a formula to zoom.
Abstract
We present neutron diffraction data for liquid benzene measured as a function of temperature from 10°C to 70°C. Isotopic substitution and Empirical Potential Structure Refinement were used to obtain a complete spatial and orientational understanding of nearest neighbour correlations. We find an increased prevalence of nearest neighbour molecules where the angle between the aromatic planes is perpendicular, and at an angle of around 60°, when the temperature is reduced. There is no significant change in prevalence parallel stacked arrangements of nearest neighbour molecules as a function of temperature. The structure of the increased local order is consistent with structural motifs observed in benzene dimers and clusters from quantum chemistry calculations in the literature.
GRAPHICAL ABSTRACT
Introduction
The non-covalent interactions between aromatic moieties are fundamental to many biological and chemical processes [Citation1–3], including protein–ligand complexation [Citation4], DNA base stacking [Citation5], supramolecular chemical recognition [Citation6–8], selectivity in chemical reactions [Citation9], aggregation and solvation of carbon nanostructures[Citation10], and petroleum phase behaviour [Citation11,Citation12]. The local structure of aromatic liquids is a delicate balance between dispersion attraction, exchange repulsion and electrostatic forces due to the quadrupolar distribution of charge over the molecule [Citation2,Citation13]. Benzene, as the archetypal aromatic, is one of the most studied room temperature molecular liquids, probably second only to water. A detailed and reliable knowledge of its intermolecular structure in the liquid state is therefore important in its own right, but is also a vital experimental benchmark for the validation of simulations of aromatic systems [Citation14].
Our previous experiments [Citation15,Citation16], alongside those of Falkowska and co-workers [Citation17,Citation18], have successfully used Neutron Diffraction with Isotopic Substitution (NDIS) interpreted using Empirical Potential Structure Refinement (EPSR) to understand the liquid structure of a number of small aromatics, including benzene, in unprecedented detail. The key feature of the liquid structure of benzene is perpendicular ‘Y-stacking’ molecules with two hydrogen atoms pointing towards the aromatic ring of the central molecule (Figure ). At short intermolecular separations there is a preference for molecules to be in a parallel offset stacked structure (Figure ), however the numbers of molecules in the parallel stacking motif are small [Citation17].
Figure 1. Schematics of low energy structural motifs for benzene dimers (off-set parallel and perpendicular ‘Y’ and ‘T’ shaped) and a triangular trimer.
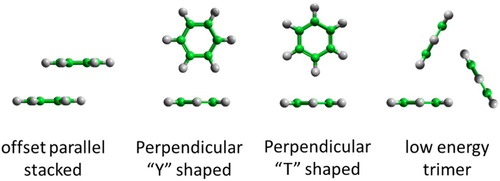
Quantum mechanical calculations have been extensively used to study the structure of benzene dimers, trimers and larger clusters. For dimers, most studies show that offset-stacked and perpendicular ‘T-shaped’ structures (Figure ) are the most stable and close to iso-energetic [Citation19–23]. Calculations of equilibrium geometries for trimers give cyclic, triangular arrangements (Figure ) as minimum energy structures, with tetramers and pentamers having a similar structure in which the 4th and 5th molecule is on a triangular face of the cyclic trimer [Citation24]. Similar C3 symmetric arrangements are also seen in calculations of larger clusters of benzene molecules [Citation25].
In the solid state benzene has a herringbone structure with predominantly near perpendicular nearest neighbour contacts, with this orientation preference preserved in the liquid state [Citation15,Citation17]. A recent combined spectroscopic and simulation study analysed the occurrence and location of parallel stacked molecules in solution as a function of temperature [Citation26], and which found an increase in parallel stacking and overlap of stacked molecules with increasing temperature. The apparent increase in intermolecular order with increasing temperature seems counterintuitive, however this may be compensated for by an overall decrease in order once the whole system is considered, not just specific (parallel) configurations.
In this manuscript we present NDIS for liquid benzene as a function of temperature between 10°C and 70°C. We utilise EPSR methods to study in detail temperature dependant changes in local positional and orientational structure. We find an increased prevalence of nearest neighbour molecules where the angle between the aromatic planes is perpendicular, and at an angle of around 60°, when the temperature is reduced, with no significant change in the prevalence of parallel stacked arrangements.
Methods
Overview of relevant theory
The quantity measured in a neutron scattering experiment is the differential scattering cross-section [Citation27]. After appropriate corrections this yields the total structure factor, F(Q). We take advantage of the fact that neutrons scatter from nuclei and therefore the scattering length, bi, is different for different isotopes. Specifically, substitution of hydrogen (bH = −3.74 fm) for deuterium (bD = 6.67 fm), is convenient and relatively easily exchanged for many organic molecules. By performing the experiment on three isotopically exchanged samples it is therefore possible for us to determine more reliable radial and orientational correlations, as the complimentary data sets place strong constraints on the structure refinement methods.
In general we measure several data sets , each of which has the same chemical composition but a different isotopic composition. The corrected diffraction data is a weighted sum of the different partial structure factors arising from different pairs of atoms
.
(1)
(1) where
is the atomic fraction of species
,
is the neutron scattering length of atom
,
(i.e. the magnitude of the momentum change vector of the scattered neutrons of wavelength λ),
is the Faber-Ziman partial structure factor involving atoms
and
only, and Kroneker delta δαβ = 1 when α = β, and 0 otherwise to avoid double counting. The partial structure factor, Sαβ(Q), contains information about correlations between the two atomic species α and β in Q-space, and is defined as:
(2)
(2) where
is the atomic number density of the sample, and gαβ(r) is the partial distribution function for the relative density of atoms of type
as a function of their distance,
, from one of type
. The total radial distribution function, f(r), is a weighted sum of the partial radial distribution functions present in a particular sample:
(3)
(3) which is related to the measured data, F(Q), by the Fourier transform:
(4)
(4)
Experimental methods
Scattering data were collected using the Small Angle Neutron Diffractometer for Amorphous and Liquid Samples (SANDALS) at the ISIS spallation neutron source at the Rutherford Appleton Laboratory, U.K. SANDALS is optimised for the measurement of the structure of liquid and amorphous samples, and in particular for hydrogen/deuterium substitution [Citation28]. Neutron scattering data on three isotopically distinct samples of liquid benzene were collected: (i) fully deuterated (Aldrich, 99.6 at%D), (ii) hydrogenated benzene (Aldrich, anhydrous) and (iii) an equimolar mixture of the two. The liquids were used as received and inserted into a flat-plate null coherent scattering titanium/zirconium cell, with 1 mm sample and wall thicknesses. This geometry minimises multiple neutron scattering and attenuation effects. The temperature was maintained via a closed-cycle water bath, with diffraction measured at four temperatures: 10°C, 30°C, 50°C and 70°C. The temperature was measured and controlled to +/−0.2°C over the course of each measurement by a thermocouple on the frame to which the sample containers were mounted. Typical counting times were ∼8 h for each sample and temperature. For data correction and calibration, scattering data were also collected from the empty instrument, the empty sample cell, and a null scattering Vanadium-Niobium alloy standard slab of thickness 3 mm. Background subtraction, and multiple scattering, absorption, and normalisation correction procedures were performed using GUDRUN [Citation29], to give the interference differential scattering cross-section for each isotopically distinct sample. Particular attention needs to be paid to correction of inelasticity effects, especially for the samples containing hydrogen. The self-scattering background and inelasticity effects were removed from the total differential scattering cross section using an iterative method developed by Soper [Citation30,Citation31].
Empirical potential structure refinement
EPSR is a means to maximise the information that can be extracted from a set of scattering experiments on a disordered system. The method produces a 3-dimensional ensemble of molecules which is consistent with the measured scattering data, and uses the scattering data as a constraint against which to refine a classical molecular simulation of the system under study. The detailed theory behind the EPSR technique is discussed elsewhere [Citation30,Citation32]. In brief, the method starts with an equilibrated Monte Carlo simulation based on initial ‘seed’ potentials. The procedure then iteratively modifies an additional empirical potential, based on the difference between measured and simulated structure factors, until the molecular ensemble becomes consistent with the scattering data. The technique allows known prior information, such as molecular geometry, overlap and electrostatic constraints to be built into the refinement procedure.
The EPSR ensemble consists of 500 molecules of benzene. The ‘seed’ potentials are the atom-centered OPLS-AA force field parameters [Citation33]. A different simulation box was used for each temperature, with the atomic density matching values available for benzene at that temperature from the DETHERM database [Citation34], densities used are given in Table . Bond lengths were varied by hand to give the best match to the real space f(r). Bonds are represented by a harmonic potential, with intramolecular-angles maintained by the use of a harmonic potential between the first and third atom. Dihedral terms are also applied and are vital to maintain the planarity of the aromatic rings. The coordinates of all atoms were saved every 5 Monte Carlo iterations for a total of over at least 40,000 iterations. This allowed a later analysis of ensemble of molecules consistent with the different scattering datasets. Analysis of EPSR simulation trajectories was conducted using the dlputils [Citation35] suite of programmes to obtain the molecule-molecule radial distribution functions, angular radial distribution functions and spatial density functions.
Table 1. Details of first solvation shell and bulk density for benzene at each temperature.
Results and discussion
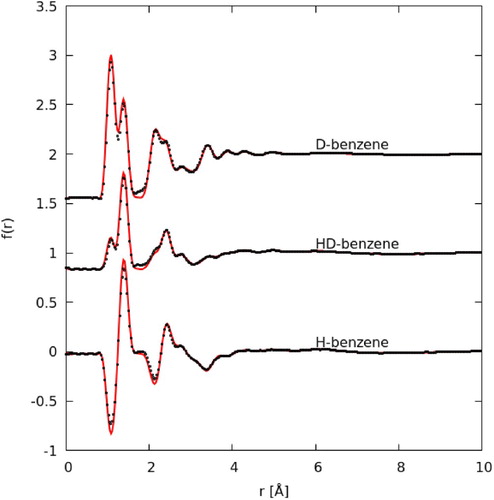
The measured interference scattering function for each of the three samples: hydrogenated (H), deuterated (D), and a 1:1 mix of the two (HD) at each temperature (10°C, 30°C, 50°C, 70°C) are shown in Figure (a). The clearest differences with temperature are apparent in the lowest Q peak, with a clear shift to lower Q with increasing temperature. The fit to EPSR is shown for the 10°C sample in Figure (b), with the residuals (the difference between EPSR and data) for all temperatures shown below. Data and fits at each temperature are plotted individually in the supplementary information. The EPSR fit to the data is good, with a similar residual for each temperature. In Figure we show the Fourier transform of the data to real space f(r) (equation 3) for data measured at 10°C (all other temperatures are plotted in the supplementary information). The quality of the fit in real-space, a low r is dominated by intramolecular correlations, and therefore the quality of observed fit shows how well the molecular geometry used fits the data. It should be noted that EPSR does not change the intramolecular distances as part of the fitting procedure, however bond distances were changed manually to give the best fit in the f(r). The C–H and C–C bonds used were 1.070 and 1.385 Å respectively.
Figure 2. (a) Measured interference scattering for benzene at all measured temperatures, showing main differences as a function of temperature at lower Q. (b) Measured interference scattering function (black points) and EPSR fit (blue curve) for three isotopologues of benzene measured at 10°C. The difference between EPSR fit and experiment is shown for all temperatures offset by −0.3. Datasets are offset on the y-axis for clarity.
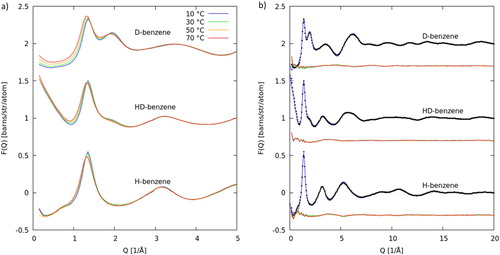
Figure 3. Plot of the Fourier transform of the data to real space f(r) as calculated by equation 3 (black dots) and EPSR fit to the data (red curve). Data and fit are for benzene at 10°C. Data are offset on the y-axis for clarity.
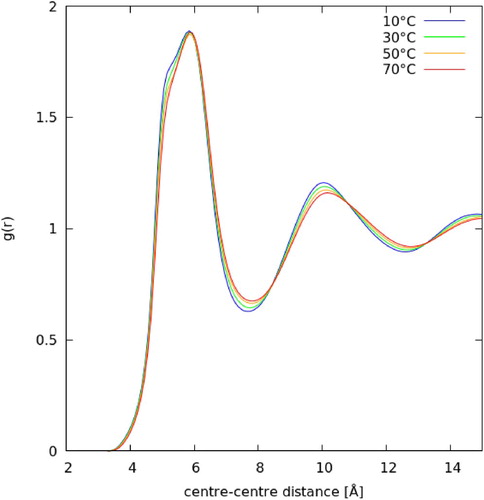
From the EPSR generated ensembles of molecules we can obtain all manner of structural and orientational information about molecules in the liquid state. In Figure we show the calculated, one-dimensional, molecule centre-centre radial distribution function, g(r), as a function of temperature. In Table we give the key features of the g(r): position of first maximum, position of first minimum (i.e. the size of the first solvation shell), and the total coordination number in the first solvation shell. As expected with increasing temperature there is an increase in the size of the first solvation shell and a slight decrease in coordination number. However the most noticeable difference in the first solvation shell is a shoulder to the main g(r) peak, at ∼5 Å, which increases with decreasing temperature. Looking out to longer distance the g(r) shows a clear decrease in order with increasing temperature, with decreases in intensity for the second and third solvation shells.
Figure 4. Molecule centre-centre radial distribution functions for liquid benzene as a function of temperature. Calculated from EPSR ensemble fitted to scattering data.
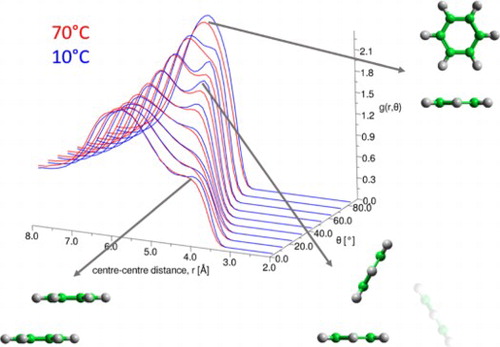
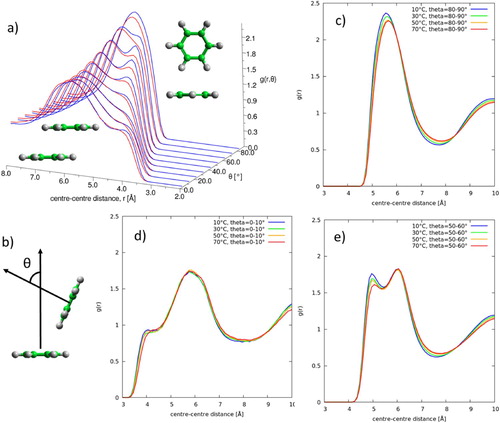
In order to understand the local structure in the first solvation shell in greater detail we plot the radial distribution function as a function of the angle between the aromatic planes, θ, in Figure , as calculated by:
(5)
(5)
where is the number of molecules in the distance range r + Δr and angle range, θ + Δθ; ρ is the bulk number density and the 1/sinθ factor corrects for the θ dependence of the solid angle when integrating over the azimuthal angle. For clarity, and to show where there are clear differences as a function of temperature, we also plot the distribution functions at fixed θ = 0–10°, 50–60°, and 80–90°. For parallel nearest neighbour molecules there is very little change in local structure with temperature. As previously observed [Citation15] we see a shoulder in the distribution at r ∼ 4 Å, attributed to close parallel offset stacking. However this feature changes very little with temperature. For perpendicular nearest neighbour molecules there is an increase in the first peak at r = 5.5–6.0 Å, indicating a slight increase in perpendicular nearest neighbours. Interestingly in the region of θ = 40–70° there are two clear peaks in the first solvation shell at r ∼ 5 and 6.2 Å. The second, longer distance peak does not change with temperature, however there are very clear changes in the first, shorter distance peak. At lower temperature there is a clear preference for short range (5 Å) nearest neighbour molecules, where the angle between the aromatic planes is in the region of 60° (e).
Figure 5. Radial distribution function for liquid benzene as a function of angle between the aromatic planes, θ (defined in (b)). (a) shows ARDF for 10°C (blue) and 70°C (red) over all angles. One dimensional plots then show g(r) at specific angles at all temperatures: θ = 0–10° (d), θ = 80–90° (c) and θ = 50–60° (e).
The question then arises as to what spatial distribution is causing this increased short distance interaction where the angle between the aromatic planes is in the region of 60°? To investigate this we first plot spatial density functions for the molecules in the first solvation shell surrounding a central benzene molecule (Figure ). These are plotted for all orientations of the second molecule, and for the specific orientation ranges θ = 0–10°, 50–60°, and 80–90°. In order to differentiate structural changes with temperature we plot the SDF for 10°C as a blue volume, and for 70°C as a red mesh. The spatial density function for all orientations is very similar to that reported previously [Citation15,Citation17], with density above and below that aromatic plane and six lobes in-between the hydrogen atoms. Taken together with the preference for perpendicular nearest neighbour orientations this confirms the ‘Y-stacking’ structure (Figure ) is a high probability structural motif at all temperatures, as previously seen at room temperature [Citation15].
Figure 6. Spatial density function for the 20% most likely positions of benzene molecules in the first solvation shell for benzene at 10°C (blue volume) and 70°C (red mesh). The spatial density functions are plotted for all orientations of the second molecule (top left), and for specific orientations of the second molecule, given as the angle between the aromatic plane, θ.
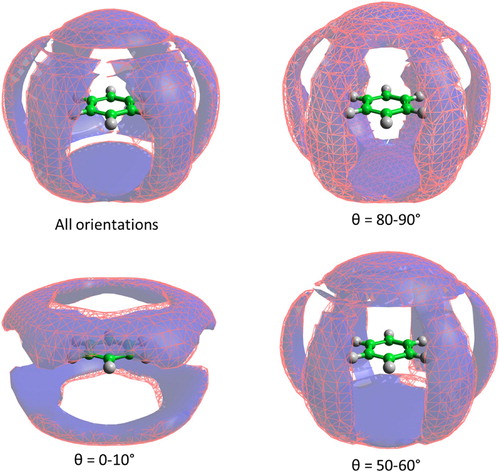
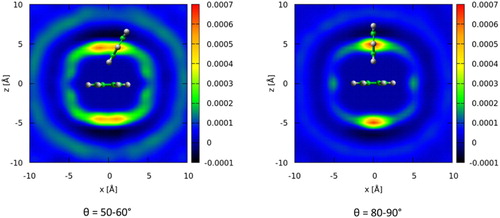
The small differences of the blue (10°C) and red mesh (70°C) volumes in Figure indicate that changes in spatial distributions as a function of temperature are relatively minor. There is some slight increase in separation between the central and second molecules with increasing temperature, as expected with the decrease in density. For parallel molecules (θ = 0–10°), there is a slight change in the density surface towards greater molecular overlap as observed by Nagasaka et al. [Citation26]. In order to find the likely spatial position of the short range (∼5 Å) correlation for molecules with θ ∼ 60° we compute the difference between the spatial density function at 10°C minus that at 70°C, for nearest neighbour molecules where θ = 50–60°. The results are shown in Figure along with a similar difference for perpendicular nearest neighbour molecules (θ = 80–90°). They show that for relative orientations of 60°, the largest differences in spatial distribution come above and below the aromatic plane. In other words, the additional short distance peak at low temperature, centred around θ = 60° in the angular radial distribution function, comes from molecules being above and below the aromatic plane. This location and orientation of the molecules is similar to that seen for small clusters, of up to 13 benzene molecules, from quantum chemistry calculations [Citation24,Citation25] where C3 symmetric triangular distributions of molecules are observed (i.e. with θ = 60°). The observed change in structure is therefore consistent with a move to a lower energy configuration as temperature is decreased. For perpendicular molecules (θ = 80–90°) the increase in local correlations is also above and below the central molecule, directly over the molecule centre, as expected for increased ‘Y-stacking’ with decreasing temperature.
Figure 7. Two-dimensional slice of difference between spatial density functions at 10°C and 70°C for molecules in the first solvation shell where the angle between the aromatic planes, θ, is either in the range 50–60° (left) or 80–90°. A second molecule in a highly probable positon at the given orientation is given as an illustration.
Conclusions
Using neutron diffraction with isotopic substitution analysed by Empirical Potential Structure Refinement we have been able to reveal how the spatial and orientational structure of nearest neighbour molecules changes with temperature in liquid benzene. As expected there is a general trend towards broadening of correlation functions with increasing temperature due to increases in disorder. Careful analysis of the orientation of nearest neighbour molecules reveals the key structural motifs that increase in probability density with decreasing in temperature. One of these motifs is of perpendicular nearest neighbours, as expected as this is the main nearest neighbour structure seen in the solid. The second motif is, perhaps surprisingly, with the angle between the aromatic planes of broadly in the region of 60°. This is, however, consistent with minimum energy structures of small clusters of benzene molecules as seen in the literature, which show equilateral triangular structures similar to that shown in Figure . Finally we compare our results to those of a recent study of Nagasaka et al. [Citation26] using spectroscopy and molecular dynamics to study changes in benzene liquids structure as a function of temperature. In similarity to this study we do find a slight increase in molecular overlap of parallel molecules with increasing temperature. Unlike this study we do not find any increase in nearest neighbour parallel stacking of molecules with increasing temperature, as shown by only minor changes in the angular radial distribution function for close parallel molecules (θ = 0–10°) as a function of temperature.
Supplemental Material
Download MS Word (312.2 KB)Acknowledgements
We kindly acknowledge the Science and Technology Facilities Council for the award of beamtime on SANDALS through beamtime request RB1900050 (DOI:10.5286/ISIS.E.RB1900050), and thank Tristan Youngs for helpful comments.
Disclosure statement
No potential conflict of interest was reported by the author.
ORCID
Thomas F. Headen http://orcid.org/0000-0003-0095-5731
Related Research Data
References
- S.E. Wheeler and J.W.G. Bloom, J. Phys. Chem. A. 118, 6133 (2014). doi: 10.1021/jp504415p
- C.R. Martinez and B.L. Iverson, Chem. Sci. 3, 2191 (2012). doi: 10.1039/c2sc20045g
- L.M. Salonen, M. Ellermann, and F. Diederich, Angew. Chemie Int. Ed. 50, 4808 (2011). doi: 10.1002/anie.201007560
- R. Fasan, R.L.A. Dias, K. Moehle, O. Zerbe, D. Obrecht, P.R.E. Mittl, M.G. Grütter, and J.A. Robinson, ChemBioChem. 7, 515 (2006). doi: 10.1002/cbic.200500452
- V.L. Malinovskii, F. Samain, and R. Häner, Angew. Chemie Int. Ed. 46, 4464 (2007). doi: 10.1002/anie.200700891
- K. Tahara, T. Fujita, M. Sonoda, M. Shiro, and Y. Tobe, J. Am. Chem. Soc. 130, 14339 (2008). doi: 10.1021/ja804604y
- J. Yang, M.B. Dewal, D. Sobransingh, M.D. Smith, Y. Xu, and L.S. Shimizu, J. Org. Chem. 74, 102 (2009). doi: 10.1021/jo801717w
- C.M. Fitchett, C. Richardson, and P.J. Steel, Org. Biomol. Chem. 3, 498 (2005). doi: 10.1039/b416553e
- S.E. Wheeler, A.J. McNeil, P. Müller, T.M. Swager, and K.N. Houk, J. Am. Chem. Soc. 132, 3304 (2010). doi: 10.1021/ja903653j
- E.M. Pérez and N. Martín, Chem. Soc. Rev. 44, 6425 (2015). doi: 10.1039/C5CS00578G
- O.C. Mullins, H. Sabbah, J. Eyssautier, A.E. Pomerantz, L. Barré, A.B. Andrews, Y. Ruiz-Morales, F. Mostowfi, R. McFarlane, L. Goual, R. Lepkowicz, T. Cooper, J. Orbulescu, R.M. Leblanc, J. Edwards, and R.N. Zare, Energy Fuels. 26, 3986 (2012). doi: 10.1021/ef300185p
- M.R. Gray, R.R. Tykwinski, J.M. Stryker, and X. Tan, Energy Fuels. 25, 3125 (2011). doi: 10.1021/ef200654p
- N.J. Singh, S.K. Min, D.Y. Kim, and K.S. Kim, J. Chem. Theory Comput. 5, 515 (2009). doi: 10.1021/ct800471b
- C.-F. Fu and S.X. Tian, J. Chem. Theory Comput. 7, 2240 (2011). doi: 10.1021/ct2002122
- T.F. Headen, C.A. Howard, N.T. Skipper, M.A. Wilkinson, D.T. Bowron, and A.K. Soper, J. Am. Chem. Soc. 132, 5735 (2010). doi: 10.1021/ja909084e
- T.F. Headen, P.L. Cullen, R. Patel, A. Taylor, and N.T. Skipper, Phys. Chem. Chem. Phys. 20, 2704 (2018). doi: 10.1039/C7CP06689A
- M. Falkowska, D.T. Bowron, H.G. Manyar, C. Hardacre, and T.G.A. Youngs, Chem. Phys. Chem. 17, 2043 (2016). doi: 10.1002/cphc.201600149
- J. Szala-Bilnik, M. Falkowska, D.T. Bowron, C. Hardacre, and T.G.A. Youngs, Chem. Phys. Chem. 18, 2541 (2017). doi: 10.1002/cphc.201700393
- E. Miliordos, E. Aprà, and S.S. Xantheas, J. Phys. Chem. A. 118, 7568 (2014). doi: 10.1021/jp5024235
- M.O. Sinnokrot and C.D. Sherrill, J. Phys. Chem. A. 110, 10656 (2006). doi: 10.1021/jp0610416
- A.K. Tummanapelli and S. Vasudevan, J. Chem. Phys. 139, 201102 (2013). doi: 10.1063/1.4834855
- T. Janowski and P. Pulay, Chem. Phys. Lett. 447, 27 (2007). doi: 10.1016/j.cplett.2007.09.003
- O. Bludský, M. Rubeš, P. Soldán, and P. Nachtigall, J. Chem. Phys. 128, 114102 (2008). doi: 10.1063/1.2890968
- C. Gonzalez and E.C. Lim, J. Phys. Chem. A. 105, 1904 (2001). doi: 10.1021/jp0015776
- D. Chakrabarti, T.S. Totton, M. Kraft, and D.J. Wales, Phys. Chem. Chem. Phys. 13, 21362 (2011). doi: 10.1039/c1cp22220a
- M. Nagasaka, H. Yuzawa, K. Mochizuki, E. Rühl, and N. Kosugi, J. Phys. Chem. Lett. 9, 5827 (2018). doi: 10.1021/acs.jpclett.8b02615
- H.E. Fischer, A.C. Barnes, and P.S. Salmon, Reports Prog. Phys. 69, 233 (2010). doi: 10.1088/0034-4885/69/1/R05
- C. Benmore and A.K. Soper, The SANDALS Manual, Rutherford Appleton Laboratory Technical Report, RAL-TR-89-046 (1989).
- A.K. Soper, RAL Reports (Didcot, UK, 2011). <http://purl.org/net/epubs/work/56240 >.
- A.K. Soper, ISRN Phys. Chem. 2013, 1 (2013). doi: 10.1155/2013/279463
- A.K. Soper, Mol. Phys. 107, 1667 (2009). doi: 10.1080/00268970903025667
- A.K. Soper, Phys. Rev. B72, 104204 (2005). doi: 10.1103/PhysRevB.72.104204
- W.L. Jorgensen, D.S. Maxwell, and J. TiradoRives, J. Am. Chem. Soc. 118, 11225 (1996). doi: 10.1021/ja9621760
- <https://i-systems.dechema.de/detherm/ >.
- T.G.A. Youngs, DLPUtils <https://www.projectaten.com/dlputils >.