
 ?Mathematical formulae have been encoded as MathML and are displayed in this HTML version using MathJax in order to improve their display. Uncheck the box to turn MathJax off. This feature requires Javascript. Click on a formula to zoom.
ABSTRACT
The disaccharide trehalose has shown outstanding anti-aggregation properties for proteins, which are highly important for the possibility to treat neurodegenerative diseases, such as Alzheimer’s and Huntington’s disease. However, the role and mechanism of trehalose for such stabilising effects are still largely unknown, partly because a direct structural picture of how trehalose organises around proteins in an aqueous system is missing. Here we compare small-angle neutron scattering (SANS) data on myoglobin in aqueous solutions of either sucrose or trehalose, in order to investigate their effect on protein–protein interactions. We find that both trehalose and sucrose induces a well-defined protein–protein distance, which could explain why these inhibit protein–protein interactions and associated protein aggregation. It does not however explain the superior anti-aggregation effect of trehalose and suggests that the local solvent structures are highly important for explaining the protein stabilisation mechanism. In a broader perspective, these findings are important for understanding the role of sugars in biological stabilisation, and could provide a structural explanation for why trehalose is a promising candidate for the treatment of neurodegenerative and other protein aggregation related diseases.
GRAPHICAL ABSTRACT
Introduction
The stabilisation mechanism of biological materials is an important field of research due to its potential in improving many different biologically relevant techniques. By exploring the different mechanisms of how stabilisation occurs, researchers can better understand how to exploit these mechanisms for developing methods for preserving biological materials. Such methods include for example cryopreservation and lyophilisation. The mechanisms which control biomolecular stabilisation are also highly relevant for medical science; a deeper understanding for how e.g. proteins and cell membranes degrade over time can lead to the development of suitable treatments. One way of exploring this topic is to examine how certain stabilising co-solutes interact with biological molecules. For the purpose of this study, we have used the disaccharides trehalose and sucrose as co-solutes to myoglobin in aqueous solutions. Both trehalose and sucrose have been demonstrated to exhibit biomolecular stabilising properties in a wide number of studies [Citation1–4], however in most aspects trehalose out-performs sucrose as a stabilising agent. Trehalose and sucrose are particularly interesting molecules because they are excellent co-solutes for protection against many different kinds of environmental stresses, such as desiccation [Citation5–7], sub-zero temperatures [Citation8,Citation9], and heat-shocks [Citation9–15]. The mechanisms behind these stabilisation events by disaccharides are however still not fully understood, although one important hypothesis for stabilising co-solutes is that they are preferentially excluded from direct interaction with the protein surface [Citation16,Citation17]. This preferential hydration model proposes that co-solutes, which are preferentially excluded from the proteins (thereby leaving the proteins preferentially hydrated), increase the energy barriers between the folded and the unfolded state of a protein, which thus leads to stabilisation. An important extension to this idea is that the water at the protein surface becomes trapped there by the presence of the co-solute when the water concentration is reduced [Citation18]. In this scenario, the trapped water molecules act as a bridge between the protein and a slow trehalose/water glassy matrix. It has also been shown that trehalose has an exceptionally strong dynamic coupling to water [Citation19–21] and subsequently couples this (reduced) dynamics to the protein. Multiple MD simulations have shown that this water entrapment model is also relevant for more hydrated systems, in which trehalose forms structures around the proteins, beyond the hydrated protein surface [Citation22,Citation23].
The disaccharides trehalose and sucrose (particularly trehalose) have furthermore been found to exhibit positive effects against protein-aggregation [Citation24–27], which may be important for e.g. developing treatments against neurodegenerative diseases [Citation24,Citation28]. For example, in polyglutamine-mediated diseases, such as Huntington’s disease, trehalose has been shown to inhibit aggregation. However, in this case, it has been claimed that the protein aggregation is inhibited by directly binding of trehalose to the polyglutamine units, which thereby prevents these units from inducing protein aggregation [Citation24]. Some studies have also pointed out that trehalose may not just prevent aggregation from occurring, but also aid in the removal of toxic aggregates via autophagy [Citation29], or by the preservation of proteasome activity [Citation30]. Trehalose has also been shown to inhibit aggregation of ß-amyloid 40, which causes Alzheimer’s disease if it is allowed to aggregate and form fibrils [Citation31]. The molecular mechanism explaining why these types of aggregations occur is, however, not yet fully understood [Citation32], and subsequently neither are the mechanisms of how to prevent protein aggregation. Thus, if we can understand why trehalose is better than sucrose at preventing protein aggregation, we may obtain key insights into how to improve treatments against neurodegenerative diseases.
To understand these mechanisms, it is important to start at the microscopic level. There are multiple aspects to consider as protein aggregation may arise due to many different reasons. Some studies have investigated how proteins structure in dry disaccharide matrices [Citation33–36], and it has been found, for example, that trehalose has a larger ability of keeping the water content around the proteins constant, thus maintaining a stiff environment around the protein even at more humid conditions [Citation33,Citation34,Citation37]. Furthermore, trehalose homogeneously distribute themselves around the protein molecules, thereby creating a physical barrier between the protein molecules [Citation35]. However, an increasing ability to prevent protein aggregation due to sugars has also been found in more diluted cases [Citation24–27]. One explanation in general for how protein aggregation in the solution can be prevented, is by generally decreasing the attractive forces of protein molecules from each other (although that is not necessarily a requirement [Citation38]). And indeed, such a repulsive effect of trehalose and sucrose on proteins has been indicated by studies using e.g. quasielastic light scattering [Citation38].
In this study, we investigate if the superior protein-aggregation reducing the effect of trehalose is related to an increase in the repulsive effect of trehalose compared to sucrose. To investigate this, we have performed neutron diffraction experiments of myoglobin (Mb) dissolved in both aqueous trehalose and aqueous sucrose with the aim to compare the distribution of the protein molecules in either solution. We show that both sugar molecules have an effect on separating proteins from each other, however both sugars have an equally repulsive effect. Furthermore, we show that there are no other large-scale structures in the investigated concentration which can explain the better efficacy of trehalose.
Experimental and computational methods
Sample preparation
We investigated three different samples for the two different three-component systems (water and myoglobin with either sucrose or trehalose), with the same molar concentration of 1956:51:1 (corresponding to a weight ratio of 2:1:1 of water:sugar:myoglobin for a fully protonated sample). The concentrations were chosen such that there would be a strong signal from the protein and sugar correlations. This was particularly important for studying the local solvent interaction, which was done in our previous study on the trehalose samples [Citation39]. At the same time, the protein and sugar concentration had to be low enough to allow these components to be dissolved, which resulted in the present concentration compromise. The samples for the present study differed in isotope composition accordingly:
(1). D2O – d-sugar – Myoglobin (with deuteration of all exchangeable OH-groups)
(2). D2O – h-sugar – Myoglobin (with deuteration of all exchangeable OH-groups)
(3). 50–50 mol% mixture of samples 1 and 2
We also investigated one reference system of myoglobin in D2O (1956:1 water:myoglobin molar ratio). Protonated α,α-trehalose (in dihydrated form) and protonated sucrose (in anhydrous form) were purchased from Sigma-Aldrich and used without any further purification. These are referred to as h-sugar in sample #2. The deuterated versions of the same sugars (referred to as d-sugar, or d-Sug as in sample #1) were purchased from Omicron Biochemicals in anhydrous form. These sugar molecules had their carbon-bound hydrogens exchanged for deuterium. The hydrogen atoms in the hydroxyl groups of the sugars were exchanged by repeatedly dissolving in D2O and drying the sugars under vacuum at 70°C. Myoglobin was also purchased from Sigma-Aldrich and was freeze-dried in D2O before mixing with either D2O or the sugar/D2O solution. This was done to remove residual water molecules, and to deuterate the exchangeable protein hydrogens. The pH of the different solutions was determined to be approximately 7.8.
Neutron diffraction experiments
All samples were measured inside a 1 mm thick Ti0.676Zr0.324 containers which were sealed with a PTFE O-ring and mounted onto an automatic sample changer, and the temperature of the samples was set to 25°C. The neutron diffraction experiments were performed on the Near and InterMediate Range Order Diffractometer (NIMROD) [Citation40] at the ISIS Pulsed Neutron and Muon Source (STFC Rutherford Appleton Laboratory, U.K.). The structure factors were obtained from the raw diffraction data using the GUDRUN suite (2015 version) [Citation41]. The GUDRUN software package handled multiple data-corrections, such as background subtraction and inelasticity corrections (more detailed information about this software is found in Ref. [Citation41]). It should however be noted that these obtained structure factors (as shown in Figure ) also contain the scattering contribution from the form factor.
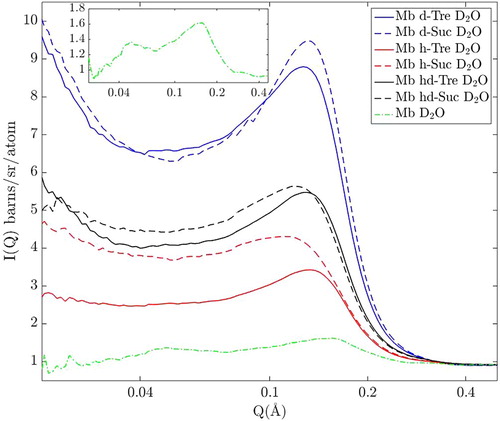
Figure 1. Scattering intensity of small-angle neutron scattering for all samples containing protein in D2O-solution. The inset shows a magnified view of the scattering from myoglobin in pure D2O.
Form factor calculations
In order to extract the pure structure factors, i.e. information about interparticle correlations, the total scattering intensity (I(Q)), as shown in Figure , had to be corrected for contributions of the form factor. I(Q), is a product of the structure factor, S(Q), and the form factor P(Q) (I(Q)∝P(Q)·S(Q)) which mainly originates from the intramolecular scattering of the protein molecules. To find an approximative form factor of myoglobin, we used the crystal protein structure of myoglobin (obtained from the protein data bank, PDB ID: 1DWR [Citation42]), and calculated the form factor with the use of SaSView 4.1.2 (http://www.sasview.org). This software calculates the form factor of a general atomic structure according to the following equation:
(1)
(1) where
is the volume and
is the scattering length density of atom j in the protein. N is the total number of atoms in the protein and V is the total volume of the protein. Using this form factor, we calculated S(Q) as [Citation43]:
where V is the volume of the protein,
is the volume fraction of the proteins, and ΔSLD is the difference in neutron scattering length density between protein and solvent (|ΔSLD| as shown in Table ), dependent on the isotope composition.
Table 1. Neutron scattering length densities of solvent and proteins in the different samples.
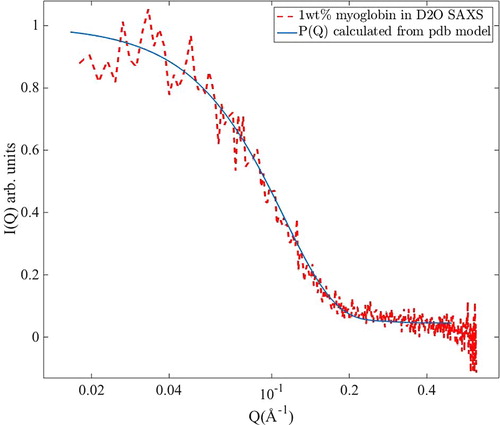
In order to validate the theoretical form factor calculated by Equation (1), we also performed a small-angle X-ray scattering (SAXS) measurement on a diluted sample (1 wt% myoglobin) of myoglobin in D2O. This measurement was performed on a Mat:Nordic instrument from SAXSLAB/Xenocs, using a Cu-radiation source. The sample was placed inside a glass capillary and measured for 20 min at ambient temperature. An empty capillary was also measured which spectra were subtracted from the sample spectra, and the spectra were multiplied with a scale factor to obtain the same scaling as the simulated P(Q). As can be seen in Figure , the simulated form factor matches well with the experimentally obtained form factor, thus validating the use of the simulated P(Q).
Figure 2. Normalized small angle X-ray scattering signal of 1wt% myoglobin in D2O (red dashed line) and simulated form factor based on pdb crystal structure (blue line).
Theoretical distance calculations
In the results and discussion below, we compare measured protein–protein distances in different solutions based on SANS data with protein–protein distances of theoretical solutions where the protein molecules are maximally separated, i.e. as far apart as the present protein concentration allows for. This is based on the following equation:
(2)
(2) where
is the density of the solution, which was measured to 1.198 and 1.0879 g/cm3 for three- and two-component system, respectively (for a fully protonated sample).
is the mass fraction of the myoglobin, i.e. either 0.25 or 0.33 for three- and two-component system, respectively. NA is Avogadro’s constant, and MMb is the molecular weight of myoglobin (∼17.6 kDa). The maximally separated protein distance according to Equation (2) is given in cm.
Differential scanning calorimetry (DSC) measurements
To check the stabilising effects of each sugar on myoglobin, the denaturation temperatures were measured, with the use of DSC, for both sugar samples and the two-component system (for fully protonated systems). These measurements were performed using a DSC Q1000 from TA Instruments. Several samples of each composition were measured to reduce the sample variability and ensure reproducibility. The samples were cooled to –120°C at a rate of 30°C/min and then heated up to 100°C at a rate of 10°C/min. The denaturation temperatures were determined by the peak position of the exothermic denaturation event around 65°C–75°C.
Results
The experimentally obtained diffraction data reveals spatial correlations as a function of momentum transfer (Q). In Figure we present the small-angle scattering part of the neutron diffraction data of all samples. One distinct feature, which is most prominent, is the peak in the region 0.1–0.3Å−1, which is attributed to intermolecular correlations of proteins. This attribution could be checked by analysing the peak intensities as a function of the difference of the scattering length densities between protein and solvent (ΔSLD as shown in Table ). If this attribution is correct one expects to find the largest intensity in the purely deuterated system (Mb d-Tre in D2O), followed by Mb hd-Tre in D2O and lastly Mb h-Tre in D2O. And indeed, it is seen in Figure that the data matches this prediction, and we can conclude that this peak is indeed due to protein–protein correlations. Furthermore, a similar protein–protein peak was observed and discussed for a similar myoglobin/trehalose system (although at a lower water content) by Longo et al. [Citation33,Citation34] in support of our prediction.
In order to isolate the structure factor from the total scattering, the form factor was removed from it, as explained in the experimental section. The resulting approximate structure factors are shown in Figure for the same region of Q. Although the peaks for all samples in Figure are relatively broad, they do exhibit approximately the same peak position at around 0.156 Å−1 (±0.002 Å−1) for all three-component samples. This corresponds to an approximate real-space centre to centre distance of 40.5 Å. For the two-component system of myoglobin in D2O, the peak-position is 0.175 Å−1 (±0.004 Å−1), corresponding to a real-space distance of about 36 Å. In a much drier system, as studied by Longo et al. [Citation33,Citation34] using SAXS, sucrose and trehalose exhibited quite different structures. They reported that sucrose formed, as expected, nanocrystals about 35 Å in size distributed throughout the sample whether myoglobin was present or not. This was not the case for trehalose, which on the other hand, in the presence of myoglobin, formed larger domains (∼150 Å) of trehalose and water which had a much lower protein concentration than the sample in average. As they hydrated their samples, they reported that both these structures disappeared; and it can be seen in the present study that indeed no such domains exists at the much higher water concentration (50 wt%) used here. On the other hand, Krueger et al. [Citation44] measured lysozyme well diluted (50 mg/ml) in water and glycerol, and showed that even in highly diluted solutions, proteins form domains with higher and lower protein concentrations. Similarly, in the present data, there is a rising slope in the scattering intensity in the region 0.01–0.04 Å−1 in Figure for the most deuterated three-component samples, which indicates some, relatively small (compared to e.g. those presented in Ref. [Citation33,Citation34]), inhomogeneities within the sample.
Figure 3. Small angle scattering of all samples with protein in D2O, after division by the form factor (i.e. with the structure factor remaining).

If the radius of myoglobin in a trehalose solution is 16 Å (based on the measurements of Ajito et al. [Citation45]), the reported inter-protein distance in the three-component system suggests that there would exist regions of water/sugar-solution in between the proteins which are in the order of 8–10 Å. This kind of separation permits both water and trehalose molecules to enter in between protein molecules (at least in regions where the space between the protein molecules is larger than at the closest distance). However, the protein–protein distance is shorter than expected for a completely homogeneous distribution of the protein molecules, indicating that a characteristic protein–protein distance is produced despite that the protein molecules are not maximally separated by trehalose. Since the proteins are not maximally separated it means by necessity that there are some inhomogeneities in these samples; i.e. there are regions within the sample with higher protein concentration than elsewhere. It is most likely those inhomogeneities which give rise to the slope in the region 0.01–0.04 Å−1 in Figure . These findings are very much in line with the analysis of lysozyme in water and glycerol described in Ref. [Citation44], where In the lysozyme molecules also exhibited quite distinctive spatial correlations in the high concentration domains.
In the two-component system a shorter protein–protein distance is to be expected due to the higher protein concentration. If the proteins would be perfectly homogeneously distributed throughout the solution (i.e. maximally separated), they would be separated at a distance of 43 Å rather than 36 Å as shown here. This short distance indicates that, in the two-component sample, where the size of protein is estimated to be about 17 Å [Citation45], barely, a single water layer is permitted in between the protein molecules. It can also partly explain why the peak for the Mb-D2O sample is much weaker, since the scattering contrast reduces with almost no solvent between the protein molecules. However, it is also likely that only a relatively small fraction of all the protein molecules are participating in these ‘clusters’ or domains, and that the remaining protein molecules are statistically distributed in the water without contributing to a specific protein–protein correlation.
Goldenberg and Argyle [Citation46] found similar results with a protein–protein correlation of 37 Å in their small-angle X-ray scattering (SAXS) data at a similar concentration of myoglobin in water. These results imply that proteins, in the presence of either sucrose or trehalose, on average are more separated, however not maximally separated. Although the proteins on average are closer than they would be in a perfectly homogeneous solution (in which they would be separated on average 46 Å), they still exhibit a clear spatial correlation much larger than a single water layer, most likely due to the steric hindrance of the interstitial sugar molecules.
Denaturation temperatures
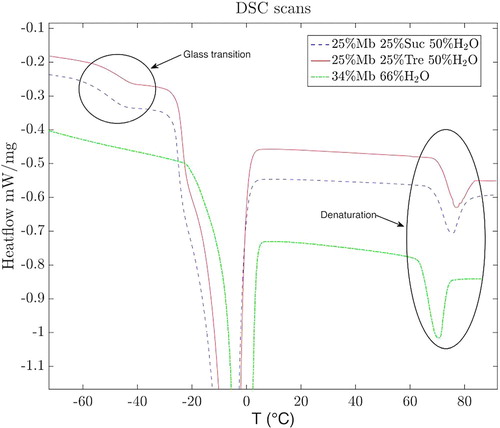
To verify that trehalose indeed exhibits a more effective stabilising effect on proteins, we measured the denaturation temperature of myoglobin in both sugar solutions, and in the purely aqueous solution. The denaturation temperature of myoglobin in water is 70.2 (±0.5)°C, whereas in trehalose and sucrose it is 77.0(±0.3)°C and 75.3(±0.1)°C, respectively. As previously reported [Citation14], both sugars have a stabilising effect on myoglobin, however, trehalose exhibits a slightly better result with an approximately 1.7°C higher denaturation temperature at equal molar ratios. Three representative DSC scans are shown in Figure , which also shows how trehalose exhibits a higher glass transition temperature than sucrose. This is a well-known fact [Citation47], and is often mentioned as an important aspect of trehalose better stabilising effects, since this also implies that trehalose is better at embedding biomolecules in a more stable amorphous environment.
Figure 4. DSC scans of both investigated three-component systems, and the two-component system. Both sugars increase the denaturation temperature compared to myoglobin in water. Trehalose exhibits both higher glass transition temperature and denaturation temperature.
Discussion
Comparing the SANS results from the three- and two-component systems one can draw the conclusion that the sugars have a repulsive effect on the protein–protein interactions. In the two-component system the characteristic distance of 36 Å between neighbouring protein molecules permits barely a single water layer in between, thus producing a substantially shorter protein–protein distance than would be the case for a homogeneous solution. However, in the sugar solutions a considerably larger protein–protein distance was observed, indicating that the sugars are acting as separating agents.Footnote1
Trehalose has been reported to have a stronger effect in preventing protein aggregation than sucrose [Citation24,Citation26], however, both sugar molecules in this study appear to separate protein molecules in this solution about the same, so what property makes trehalose better at reducing protein aggregation? One important explanation is that unfolded proteins are more prone to aggregate [Citation32,Citation48], and since trehalose increases the stability of the folded state [Citation2,Citation11–14,Citation49] the addition of trehalose subsequently leads to less aggregation [Citation50]. This has been shown to be the case for many different proteins during dehydration, where trehalose (and other disaccharides) have inhibited unfolding, subsequently leading to less aggregation [Citation3]. Another relevant study was made by Barreca et al. [Citation13] where they incubated lysozyme at 98°C for 30 min both with and without trehalose and found that in the absence of trehalose the secondary protein structure was altered, which led to aggregation. In the presence of a 1 M trehalose solution these secondary structures were protected, and subsequently protein aggregation was prevented. However, it has previously been pointed out that stabilisation of the native protein structure does not necessarily lead to a colloidal stability of the protein molecules in the solution, since protein aggregation is dependent on many different mechanisms [Citation38].
One such mechanism of interest was reported by Lerbret et al. [Citation35] who showed, using molecular dynamic simulations combined with inelastic neutron scattering, that trehalose in relatively dry systems (with water contents less than 15 wt%) physically separate protein molecules (in that case they studied lysozyme) by sterical hindrance, i.e. by simply occupying the interstitial space between the protein molecules and thereby separating them. A sterical hinderance could also explain the repulsive effect of sugars on proteins in more diluted cases, given that the sugars are homogeneously distributed in the sample.
Interestingly, it has been suggested that trehalose forms structures close to the protein surface, just outside the water hydration layer [Citation22,Citation23]. Such a trehalose ‘layer’ around each protein molecule could give rise to colloidal protein stability in a solution by steric hindrance of direct protein–protein interactions.
In our previous study on the local solvent structure [Citation39] we showed that the trehalose molecules were indeed close to the protein molecules, technically supporting this trehalose layer hypothesis, however, this might merely be a natural consequence of the high protein concentration. Given that the proteins are quite well separated, and that the proteins are predominantly covered in water, the only space for the trehalose molecules to enter is in the very limited space between the hydrated protein molecules. This forces the trehalose molecules to form a layer-like structure between neighbouring protein molecules. Hence, we are unable to distinguish a preferential layer formation of trehalose outside the protein hydration layer from a homogeneous distribution of the trehalose molecules in the remaining aqueous solution outside the preferential hydration layer (see Figure for an illustration). Only experiments on more dilute protein solutions can distinguish between these two structural scenarios.
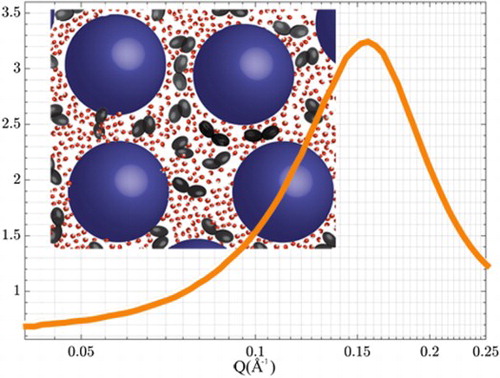
Figure 5. Sketch of proteins in aqueous sugar solutions. Blue spheres represent the protein, and the black double ellipsoids represent sugar molecules, whereas the water molecules are drawn in red and white.
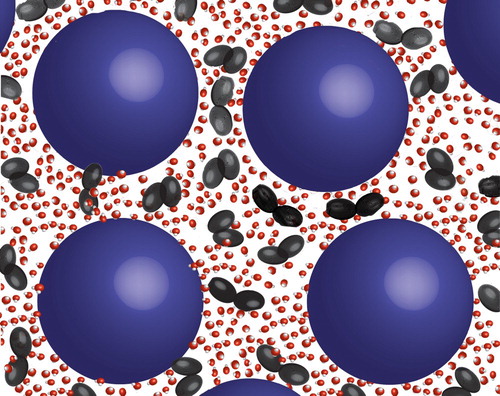
In relation to this hypothesis it should be pointed out that one reason for protein clustering is the hydrophobic effect. Water molecules at hydrophobic patches of the protein are forced into an ordered structure in order to avoid direct bonding to the protein, and when two hydrophobic patches from different proteins come into contact, there is thus an entropy loss due to the breaking of these ordered structures. If sugar molecules trap these ordered water regions into place this entropy loss cannot be obtained in the system, and thus aggregation is less likely to occur [Citation28]. Alternatively, in line with the so-called water replacement hypothesis, the sugar molecules themselves preferentially occupy these protein sites, thus lowering the energy gain for protein–protein contacts.
The results in this study indicate that the key to understand which properties make trehalose better at stabilising protein molecules is found in the structure of the solvent around the protein molecules. Such structures have been studied widely by e.g. MD simulations [Citation22,Citation23,Citation35,Citation51] and FTIR spectroscopy [Citation18]. On the other hand, those methods typically depend upon approximative force fields, or indirect information about the system. Neutron diffraction on the other hand may provide more detailed answers, since it can accurately probe distances between specific molecular sites in a liquid. This has been measured for these systems in a trehalose solution, and modelled with the use of Empirical Potential Structure Refinement (EPSR) [Citation39], in order to analyse the neutron diffraction data, which can otherwise be cumbersome to interpret. That study yielded a good quantification on the level of preferential hydration of the proteins, and how the trehalose molecules structured around them. A similar study using neutron diffraction with EPSR modelling was recently made on a model peptide (N-methylacetamide) in an aqueous trehalose solution [Citation52], which also showed how these model peptides were preferential hydrated. This study furthermore showed that the model peptides were separated due to the presence of trehalose, in support of our present analysis. Currently, we are working on a neutron diffraction and EPSR study with myoglobin in aqueous sucrose (same neutron diffraction data as presented here), which could provide an excellent comparison to the trehalose solvent structure, and perhaps disentangle the questions surrounding stabilisation of proteins due to the presence of disaccharide.
Conclusions
In this study, we investigated whether or not the extraordinary protein-stabilisation effect of trehalose was specifically related to its ability to prevent protein–protein interactions. This effect was studied by the use of small-angle neutron scattering in combination with isotopic substitution, and the superior stabilising effect of trehalose was checked with the use of determining the denaturation temperature in either trehalose or sucrose solutions. According to the analysis of the SANS data, both sucrose and trehalose separate the protein molecules to approximately the same distances of 40.5 Å, which corresponds to about 8–10 Å of solvent separating proteins from each other. This was interestingly found to be in quite stark contrast to the investigated two-component system containing water and myoglobin, which exhibited a protein–protein distance only permitting about a single water layer. This indicates that both sugar molecules act by separating the protein molecules, which thereby is not an effect specific to trehalose. Furthermore, we found no other significant large-scale structures in either sugar solution, which has otherwise been reported at lower water contents [Citation33,Citation34]. Instead, we propose that the origin of the superior anti-aggregation and protein stabilisation effects provided by trehalose can be found in their solvent structure and dynamics, which has previously been suggested by others in the literature [Citation50]. An analysis of such structures in both trehalose and sucrose systems is currently being conducted by us with the use of neutron diffraction and EPSR modelling. Further understanding of how trehalose act as an anti-aggregation agent can be useful for the study of such molecules for the treatment against protein aggregation related diseases, such as Alzheimer’s and Huntington’s disease.
Acknowledgements
We would like to thank Tristan Youngs for helping with the NIMROD measurements, and for all the help with interpreting the data. Furthermore, we gratefully acknowledge the Science and Technology Facilities Council (STFC) for access to neutron beam time at ISIS, on the NIMROD instrument (RB number 1520094). This work also benefited from the use of the SasView application, originally developed under NSF award DMR-0520547. SasView contains code developed with funding from the European Union’s Horizon 2020 research and innovation programme under the SINE2020 project, grant agreement No 654000.
Disclosure statement
No potential conflict of interest was reported by the authors.
ORCID
Christoffer Olsson http://orcid.org/0000-0002-8440-9393
Jan Swensonhttp://orcid.org/0000-0001-5640-4766
Additional information
Funding
Notes
1. Although, as pointed out above, the three-component system exhibits domains with higher protein concentrations (based on the rising slope in the Q-range 0.01–0.04 Å−1 in figure ), which indicates in part an attractive intermolecular force. However, within those domains the proteins are experiencing a shorter ranged repulsive force.
References
- J.H. Crowe, L.M. Crowe and S.A. Jackson, Arch. Biochem. Biophys. 220, 477 (1983). doi: 10.1016/0003-9861(83)90438-1
- N.K. Jain and I. Roy, Protein. Sci. 18, 24 (2009).
- J.H. Crowe, J.F. Carpenter and L.M. Crowe, Annu. Rev. Physiol. 60, 73 (1998). doi: 10.1146/annurev.physiol.60.1.73
- A.B. Richards, S. Krakowka, L.B. Dexter, H. Schmid, A.P.M. Wolterbeek, D.H. Waalkens-Berendsen, A. Shigoyuki, and M. Kurimoto, Food Chem. Toxicol 40, 871 (2002). doi: 10.1016/S0278-6915(02)00011-X
- J.H. Crowe, L.M. Crowe, J.F. Carpenter and C. Aurell Wistrom, Biochem. J. 242, 1 (1987). doi: 10.1042/bj2420001
- W.Q. Sun and A.C. Leopold, Comp. Biochem. Physiol. Part A Physiol. 117, 327 (1997). doi: 10.1016/S0300-9629(96)00271-X
- M. Malferrari, A. Savitsky, W. Lubitz, K. Möbius and G. Venturoli, J. Phys. Chem. Lett. 7, 4871 (2016). doi: 10.1021/acs.jpclett.6b02449
- T. Duong, R. Barrangou, W.M. Russell and T.R. Klaenhammer, Appl. Environ. Microbiol. 72, 1218 (2006). doi: 10.1128/AEM.72.2.1218-1225.2006
- A. Wiemken, Antonie Van Leeuwenhoek. 58, 209 (1990). doi: 10.1007/BF00548935
- G. Bellavia, L. Cordone, A. Cupane and J. Therm, Anal. Calorim. 95, 699 (2009). doi: 10.1007/s10973-008-9490-4
- G. Bellavia, S. Giuffrida, G. Cottone, A. Cupane and L. Cordone, J. Phys. Chem. B. 115, 6340 (2011). doi: 10.1021/jp201378y
- C. Olsson, H. Jansson and J. Swenson, J. Phys. Chem. B. 120, 4723 (2016). doi: 10.1021/acs.jpcb.6b02517
- D. Barreca, G. Laganà, S. Magazù, F. Migliardo, G. Gattuso and E. Bellocco, Int. J. Biol. Macromol. 63, 225 (2014). doi: 10.1016/j.ijbiomac.2013.11.011
- G. Bellavia, G. Cottone, S. Giuffrida, A. Cupane and L. Cordone, J. Phys. Chem. B. 113, 11543 (2009). doi: 10.1021/jp9041342
- A. Hédoux, J.-F. Willart, L. Paccou, Y. Guinet, F. Affouard, A. Lerbret, and M. Descamps, J. Phys. Chem. B 113, 6119 (2009). doi: 10.1021/jp900330r
- T. Arakawa and S.N. Timasheff, Biochemistry, 21, 6536, (1982).
- T. Arakawa and S.N. Timasheff, Biophys. J. 47, 411 (1985). doi: 10.1016/S0006-3495(85)83932-1
- P.S. Belton and A.M. Gil, Biopolymers. 34, 957 (1994). doi: 10.1002/bip.360340713
- S. Magazù, F. Migliardo and M.T.F. Telling, J. Phys. Chem. 110, 1020 (2006). doi: 10.1021/jp0536450
- S. Magazù, F. Migliardo and M.T.F. Telling, Eur. Biophys. J. 36, 163 (2006). doi: 10.1007/s00249-006-0108-0
- N. Ekdawi-Sever, J.J. de Pablo, E. Feick and E. von Meerwall, J. Phys. Chem. A. 107, 936 (2003). doi: 10.1021/jp020187b
- R.D. Lins, C.S. Pereira and P.H. Hünenberger, Proteins Struct. Funct. Bioinforma. 55, 177 (2004). doi: 10.1002/prot.10632
- D. Corradini, E.G. Strekalova, H.E. Stanley and P. Gallo, Sci. Rep. 3, 1218 (2013). doi: 10.1038/srep01218
- M. Tanaka, Y. Machida, S. Niu, T. Ikeda, N.R. Jana, H. Doi, M. Kurosawa, M. Nekooki, and N. Nukina, Nat. Med 10, 148 (2004). doi: 10.1038/nm985
- Z. Ignatova and L.M. Gierasch, Proc. Natl. Acad. Sci. 103, 13357 (2006). doi: 10.1073/pnas.0603772103
- M.A. Singer and S. Lindquist, Mol. Cell. 1, 639 (1998). doi: 10.1016/S1097-2765(00)80064-7
- T. Hottiger, T. Boller and A. Wiemken, FEBS Lett. 220, 113 (1987). doi: 10.1016/0014-5793(87)80886-4
- R. Liu, H. Barkhordarian, S. Emadi, C.B. Park and M.R. Sierks, Neurobiol. Dis. 20, 74 (2005). doi: 10.1016/j.nbd.2005.02.003
- S. Sarkar, J.E. Davies, Z. Huang, A. Tunnacliffe and D.C. Rubinsztein, J. Biol. Chem. 282, 5641 (2007). doi: 10.1074/jbc.M609532200
- Y. Li, Y. Luo, T. Luo, B. Lu, C. Wang, Y. Zhang, M. Piao, C. Feng, and P. Ge, Mol. Neurobiol 54, 6857 (2017). doi: 10.1007/s12035-016-0196-5
- R. Liu, H. Barkhordarian, S. Emadi, C.B. Park and M.R. Sierks, Neurobiol. Dis. 20, 74 (2005). doi: 10.1016/j.nbd.2005.02.003
- W. Wang, Int. J. Pharm. 289, 1 (2005). doi: 10.1016/j.ijpharm.2004.11.014
- S. Giuffrida, M. Panzica, F.M. Giordano and A. Longo, Eur. Phys. J. 34, 87 (2011).
- A. Longo, S. Giuffrida, G. Cottone and L. Cordone, Phys. Chem. Chem. Phys. 12, 6852 (2010). doi: 10.1039/b926977k
- A. Lerbret, F. Affouard, A. Hédoux, S. Krenzlin, J. Siepmann, M.-C. Bellissent-Funel, et al., J. Phys. Chem. B. 116, 11103 (2012). doi: 10.1021/jp3058096
- V. Ragoonanan and A. Aksan, Biophys. J. 94, 2212 (2008). doi: 10.1529/biophysj.107.110684
- D. Kilburn, S. Townrow, V. Meunier, R. Richardson, A. Alam and J. Ubbink, Nat. Mater. 5, 632 (2006). doi: 10.1038/nmat1681
- S. James and J.J. McManus, J. Phys. Chem. B. 116, 10182 (2012). doi: 10.1021/jp303898g
- C. Olsson, S. Genheden, V. García Sakai and J. Swenson, J. Phys. Chem. B. 123, 3679 (2019). doi: 10.1021/acs.jpcb.9b01856
- D.T. Bowron, A.K. Soper, K. Jones, S. Ansell, S. Birch, J. Norris, et al., Rev. Sci. Instrum. 81, 33905 (2010). doi: 10.1063/1.3331655
- Disordered Materials Software Homepage (2016).
- K. Chu, J. Vojtchovsky, B.H. McMahon, R.M. Sweet, J. Berendzen and I. Schlichting, Nature. 403, 921 (2000). doi: 10.1038/35002641
- P.S. Sarangapani, S.D. Hudson, R.L. Jones, J.F. Douglas and J.A. Pathak, Biophys. J. 108, 724 (2015). doi: 10.1016/j.bpj.2014.11.3483
- S. Krueger, D. Ho and A. Tsai, Small-Angle Neutron Scattering as a Probe for Protein Aggregation at Many Length Scales, in Misbehaving Proteins: Protein (Mis)Folding, Aggregation, and Stability (Springer New York, New York, NY, 2006), pp. 125–146.
- S. Ajito, M. Hirai, H. Iwase, N. Shimizu, N. Igarashi and N. Ohta, Phys. B Condens. Matter. 551, 249 (2018). doi: 10.1016/j.physb.2018.03.040
- D.P. Goldenberg and B. Argyle, Biophys. J. 106, 895 (2014). doi: 10.1016/j.bpj.2013.12.004
- J.L. Green and C.A. Angell, J. Phys. Chem. 93, 2880 (1989). doi: 10.1021/j100345a006
- C.A. Ross and M.A. Poirier, Nat. Med. 10, S10 (2004). doi: 10.1038/nm1066
- L. Cordone, G. Cottone, A. Cupane, A. Emanuele, S. Giuffrida and M. Levantino, Curr. Org. Chem. 19, 1684 (2015). doi: 10.2174/1385272819666150429232426
- M. Panzica, A. Emanuele and L. Cordone, J. Phys. Chem. B. 116, 11829 (2012). doi: 10.1021/jp3054197
- G. Cottone, J. Phys. Chem. B. 111, 3563 (2007). doi: 10.1021/jp0677288
- M. Di Gioacchino, F. Bruni and M.A. Ricci, J. Phys. Chem. B. 122, 10291 (2018). doi: 10.1021/acs.jpcb.8b08046