
 ?Mathematical formulae have been encoded as MathML and are displayed in this HTML version using MathJax in order to improve their display. Uncheck the box to turn MathJax off. This feature requires Javascript. Click on a formula to zoom.
Abstract
The liquid structure of the commonly used solvents dimethylformamide (DMF) and dimethylacetamide (DMA)were measured using state-of-the-art state neutron diffraction augmented with isotopic substitution (NDIS) and interpreted with empirical potential structure refinement (EPSR). Both solvents are found to develop rich local ordering with similar local packing densities, though with differences related to their three-dimensional molecular structure. While DMF’s dipole preferentially orientates anti-parallel to maximise hydrogen bonding, DMA favours parallel arrangement maximising non-directional dispersive forces. The highly-developed local orientational structure found in these solvents rationalises their ability to solvate a range of charged and neutral nanomaterials and highlights that the understanding of nanomaterial dispersions is a multi-body problem in which the geometry of the molecule, as well its dipole moment, must be incorporated.
GRAPHICAL ABSTRACT

Introduction
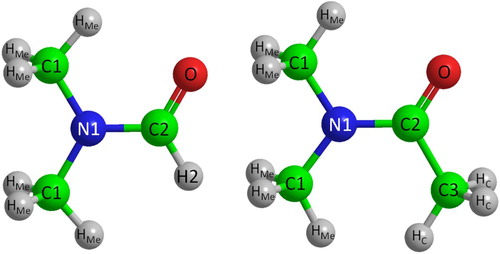
Dimethylformamide (DMF) and dimethylacetamide (DMA), shown in Figure , are both widely used, polar, aprotic solvents with a particuarly useful combination of physicochemical properties. DMF is a high boiling point (153°C) liquid, miscible with most solvents, notably baring aliphatics, capable of dissolving the majority of organic compounds, infiltrating most polymers, and being available in bulk quantities at low cost. The solvating power of this solvent is particularly exploited in fuel refinement to separate (miscible) aromatics from (immiscible) aliphatic components in petroleum refinement [Citation1]. DMF is highly suitable for nucleophilic/electrophilic reactions, or indeed any involving highly charged species, due to its polar nature (μ = 3.9 D at room temperature). Consequently, DMF is one of the most common solvents for chemical synthesis and refinement, both at the laboratory and industrial scales. Major applications include as polymer-solvent for fibre (electro) spinning [Citation2], solid-state peptide synthesis [Citation3], and more recently, as a solvent for charged and uncharged nanomaterials processing [Citation4–10] where it has shown among the best performances for neat-solvent dispersion of nanocarbons [Citation11–17].
Figure 1. The molecular structures of [left] dimethylformamide (DMF) and [right] dimethylacetamide (DMA).
![Figure 1. The molecular structures of [left] dimethylformamide (DMF) and [right] dimethylacetamide (DMA).](/cms/asset/0372c263-ed37-473d-9de4-5ff1daf31e97/tmph_a_1649494_f0001_ob.jpg)
DMA has a similar structure, boiling point (165°C), and dipole (μ = 3.7 D at room temperature) to DMF, resulting in similar properties and applications [Citation7,Citation18,Citation19]. However, as a more expensive chemical, it is typically only used in applications where DMF is specifically unsuitable. In particular, DMF reacts in highly basic conditions (hydrolyses), with strong reducing agents (decomposes) [Citation20], chlorinating agents (forms imidoyl chlorides) [Citation21], and can decompose at prolonged elevated temperatures [Citation22], while DMA is typically more stable. These specialist properties facilitate a range of important reactions, particularly in pharmaceutical syntheses [Citation23–25], polymer production [Citation26,Citation27], and nanomaterial processing applications [Citation28,Citation29], particularly for anionic nanomaterial dissolution [Citation30].
Both solvents are carboxamides (or amino carbonyls) with the general structure R1-C(=O)-NR2R3 where R2 and R3 are methyl groups, which differ only in their R1 group: while DMF has a hydrogen atom, DMA has a methyl group. As acyclic amides, their resonance structure develops a partial double bond character, with π -electron delocalisation over the N–C=O entities.
A major focus of interest in the literature concerns the intersolvent hydrogen bonding that occurs, particularly in the case of DMF. Formamide (FA, R2/R3 = H) and N-methylformamide (NMF, R2 = H, R3 = CH3), of which DMF is a derivative, are both protic solvents and can therefore act as both proton donors and acceptors via their N–H and C=O groups, respectively, and are consequently able to form C=O—H–N hydrogen bonds (H-bonds). Neutron diffraction studies have revealed the existence of this H-bonding network in the liquid structures of both FA and NMF. FA comprises a structure dominated by large cyclic clusters, with each molecule participating in exactly two H-bonds cooperatively arranged in a ring [Citation31]. The preferred nearest neighbour orientation of two molecules is such that the C–N bonds of neighbouring molecules sit anti-parallel [Citation32], forming strong directional C=O—H–N bonds at 1.95 Å. As for its derivative, N-methylformamide (NMF), the findings point to very stable dimers and ‘linear’ trimers leading to a chain-like structure stabilised by weak H-bonds. Interestingly, however, the prevalence of these C=O—H–N H-bonds has been found to be greater in NMF than in FA [Citation33].
In contrast to FA and NMF, DMF is aprotic. The added N-methyl-group prevents any amine-centric hydrogens contributing to a H-bonding system, with H-bonding necessarily involving the weaker methyl hydrogens or formic proton; as such, the formation of strong H-bonds is less likely [Citation34]. However, reports of H-bonding in DMF do exist. For example, Raman and infrared spectroscopy studies of liquid DMF have reported H-bonds between the weakly donating carbonyl-adjacent hydrogen and methyl hydrogen atoms [Citation35]. This H-bonding network was again reported by X-ray diffraction studies and supported by complementary Molecular Orbital calculations [Citation36,Citation37]. H-bonding was also reported in more recent studies using Fourier-transform infrared spectroscopy and molecular simulations [Citation38,Citation39]. The literature for DMA is mostly limited to studies where the solvent is mixed with another species, where hydrogen bonding has been reported [Citation40–42], but no reports of hydrogen bonding were found for the pure solvent.
In this work, we use neutron scattering with isotopic substitution, analysed using Empirical Potential Structure Refinement (EPSR) to obtain a spatial and orientational description of the structure the first solvation shell of the important liquid solvents DMF and DMA. We find a similar spatial structure between the two solvents, but observe clear differences in the relative orientation of nearest neighbour molecules. Finally, we measure the extent to which hydrogen bonding can be said to occur in these liquids.
Methods
Overview of scattering theory
The quantity measured in a neutron scattering experiment is the differential scattering cross-section [Citation43], which after appropriate corrections, gives the total structure factor, F(Q). Here, we take advantage of the fact that neutrons scatter from nuclei with a different scattering length, b, is different for different isotopes; specifically the substitution of hydrogen (bH = −3.74 fm) for deuterium (bD = 6.67 fm) is particularly effective for generating contrast, due to the change in sign. By performing the experiment on three isotopically exchanged samples it is, therefore, possible for us to determine reliable radial and orientational correlations, as the complementary data sets place stronger constraints on the structure refinement methods as described below.
In practice, we measure M data sets, Fi(Q), each of which has a different isotopic composition. The corrected diffraction data are then a weighted sum of the different partial structure factors arising from different pairs of atoms α,β.
(1)
(1) where cα is the atomic fraction of species α, bα is the neutron scattering length of atom α, Q = 4π (sinθ)/λ (i.e. the magnitude of the momentum change vector of the scattered neutrons where λ is the wavelength of the neutrons), and Sαβ (Q) is the Faber-Ziman partial structure factor involving atoms α and β only. Equation (1) may be re-written as
(2)
(2) where
represents the ith dataset, the index j runs over the N partial structure factors in the system, and the weights matrix, wij, is given by
, where j runs over all the N pairs of
values. The partial structure factor, Sαβ(Q), contains information about correlations between the two atomic species α and β in Q-space and is defined as
(3)
(3) where
is the atomic number density of the sample and gαβ(r) is the partial distribution function for the relative density of atoms of type
as a function of their distance,
, from one of type
(4)
(4) where
is the number of atoms of β between distances r and r + dr from an atom of α and
is the bulk density of β atoms in the system. This function is related to the cumulative coordination number of species
from species
at a distance
by
(5)
(5)
The total radial distribution function, f(r), is a weighted sum of the partial radial distribution functions present in a particular sample
(6)
(6) which is related to the measured data, F(Q), by the Fourier-transform
(7)
(7)
Experimental details
Neutron diffraction data were collected on the Near and InterMediate Range Order Diffractometer (NIMROD) instrument [Citation44] at the ISIS spallation neutron source (Harwell, U.K.). Measurements of three isotopomeric samples were taken for each solvent: a non-isotopically enriched sample (H–DMF/H–DMA), a fully deuterated sample (D–DMF/D–DMA), and a 1:1 molar mix of the two (HD–DMF/HD–DMA). Each sample was contained in flat-plate null-scattering Ti0.68Zr0.32 alloy cells of internal dimensions 35 × 35 × 1 mm, and loaded onto an automatic sample changer with the temperature was maintained at 21°C using a circulating water-bath.
Neutron scattering from the samples was measured using a 30 × 30 mm beam size for a minimum of 2 h. The measured neutron scattering was reduced to the interference differential scattering cross-section, F(Q), using the GudrunN programme [Citation45]. This programme merges the time-of-flight scattering from all detectors to a single Q scale, normalises to a 3 mm VNb plate calibration standard, subtracts scattering from the sample container and empty instrument and applies corrections for beam attenuation and multiple scattering. For samples containing light hydrogen, attention must be paid to careful subtraction of inelasticity effects, which is achieved through the application of an iterative correction developed by Soper [Citation46,Citation47].
Empirical potential structure refinement
The Empirical Potential Structural Refinement (EPSR) method aims to maximise the information that can be extracted from a set of scattering experiments on a disordered system. The method produces a 3-dimensional ensemble of molecules which is consistent with the measured scattering data, using the measured diffraction data as a constraint against which to refine a classical molecular simulation of the system under study. The detailed theory behind the EPSR technique is discussed elsewhere [Citation48]. In brief, the method starts with an equilibrated Monte Carlo simulation based on initial ‘seed’ potentials. The procedure then iteratively modifies an additional empirical potential, based on the difference between measured and simulated structure factors, until the molecular ensemble becomes consistent with the scattering data. The technique allows known prior information, such as molecular geometry, overlap and electrostatic constraints to be built into the refinement procedure.
The EPSR simulations for both DMF and DMA were initiated by constructing a cubic box for each of the liquids containing 500 molecules at the atomic number densities 0.09330 Å−1 for DMF and 0.09750 Å−1 for DMA. The seed parameters used for the EPSR simulations were obtained for the atom-centred OPLS/AA force field [Citation49,Citation50]. The labels assigned to atomic sites for each of the molecules shown in Figure .
Figure 2. Atom labelling used in Empirical Structure Refinement (EPSR) analysis for DMF (left) and DMA (right).
Once the system was equilibrated, for data acquisition, each simulation was then run for another 80,000 iterations, with the coordinates saved at each iteration. The resulting set of coordinates was analysed by the dlputils suite of programmes [Citation51] with the spatial density functions mapped over the molecular structure using the Aten programme [Citation52].
Results and analysis
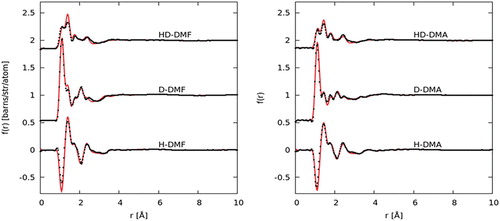
The total normalised structure factors, F(Q)s, show good agreement with the EPSR-refined fits for DMF and DMA (Figure ). Fits to the total radial distribution functions (RDF), f(r)s, in real space are given in Figure . The discrepancy between the fit and data, F(Q), at low values of Q for the hydrogenated samples is attributable to difficulty in applying the inelastic scattering correction in this region [Citation46].
Figure 3. Experimental F(Q) (black data points) for the hydrogenated (H−), deuterated (D−) and mixed (HD−) samples, alongside EPSR fit (red line) and residual (blue line) plotted for DMF (left) and DMA (right).
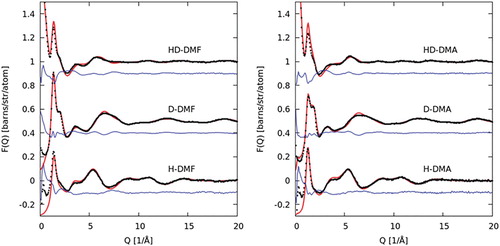
Figure 4. Experimental pair distribution functions, f(r), for DMF (left) and DMA (right), EPSR fit to the data are shown as a red line.
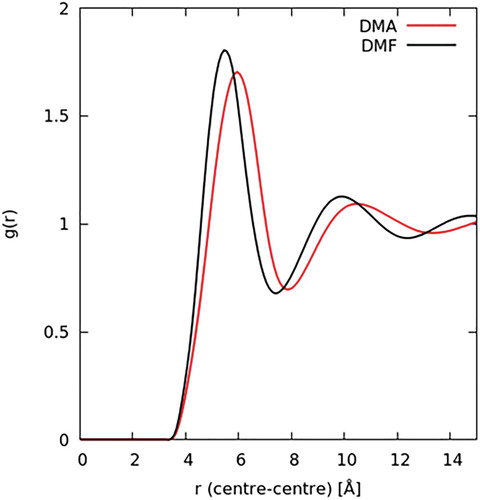
From the ensemble of the fitted EPSR simulation over many iterations, we can obtain a wealth of structural information. The simplest is the one-dimensional centre–centre radial distribution functions, g(r), as shown in Figure . Both RDFs show three distinct intermolecular shells. For DMF, the shell maxima occur at 5.5, 9.9 and 14.7 Å. For DMA, these features occur at 5.9, 10.5 and 15.8 Å, with the third peak appearing slightly broader (i.e. less structured) than that in DMF. Spatial correlation decays rapidly beyond ∼16 Å for both solvents. The molecular coordination number can be calculated using Equation (5). On average, the total number of molecules in the first solvation shell (coordination number) is found to be 12.8 for DMF and 13.0 for DMA.
Figure 5. Molecule geometric centre–centre radial distributions functions for liquid DMF (black curve) and DMA (red curve) from EPSR model.
Spatial density functions (SDFs) allow the visualisation of correlations as three-dimensional maps, showing regions of space around a central molecule (of fixed orientation) that are most likely to be occupied by the molecular centres of a neighbouring molecule in the liquid. In contrast to 1-dimensional histogram binning in the case of the RDFs, calculations of SDFs are based on 3-dimensional histogram binning into volume elements.
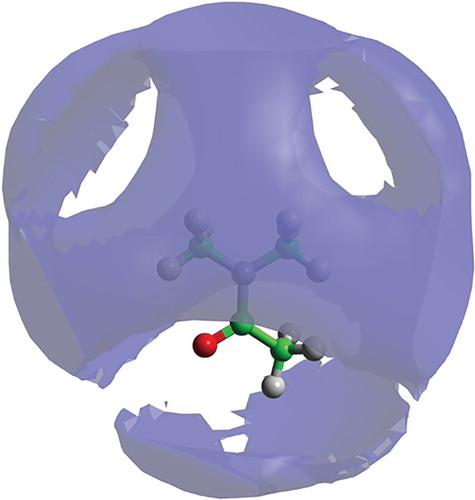
The SDF for DMF (Figure ) shows the volume representing the 30% most likely locations of the DMF centre of geometry in the first solvation shell (up to 7.4 Å). The isosurface is remarkably symmetric, with little in the way of strong structural features, apart from gaps near the location of the hydrogen and oxygen atoms. The SDF for DMA (Figure ), again plotted at the 30% level in the first solvation shell (up to 7.9 Å), is less structured, on the whole, than DMF and shows a more pronounced gap surrounding the oxygen atom.
Figure 6. Spatial density function (blue lobes) for liquid DMF showing 30% most likely locations for molecules in the first solvation shell (up to 7.4 Å), around a fixed central molecule, as shown in the molecular model.
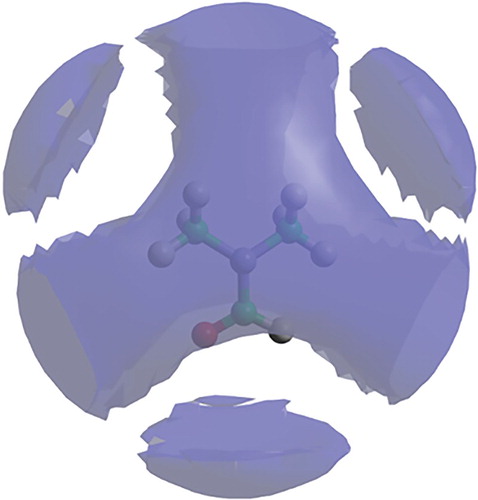
Figure 7. Spatial density function for liquid DMA showing 30% most likely locations for molecule in the first solvation shell (up to 7.9 Å), around a fixed central molecule, as shown in the molecular model (hydrogen white, oxygen red, carbon green and nitrogen blue).
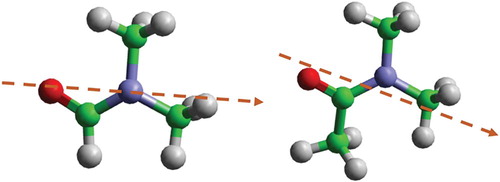
Further information on the liquid structure of these two solvents can be obtained from looking at the relative orientations of a molecule in the first solvation shell compared to the central reference molecule. In order to define the relevant axes, the directions of the dipole moments in both DMF and DMA need to be first calculated. Though DMF’s dipole moment could be obtained from the literature [Citation53], no reports of DMA’s were found. As a result, both dipoles were instead calculated in ORCA v4.0.1 though MP2 calculations using a def2-SVP basis set. Initial molecular geometries were calculated from MM2 Force Field relaxed structures in ChemBio3D (v.14.0.0.117). The method has been shown to be of comparable accuracy to several hybrid functionals and found a dipole moment for DMF in agreement with other recent calculations [Citation53]. The dipole moment for each molecule is shown in Figure .
Figure 8. Dipole moment directions for (left) DMF and (right) DMA. Molecular dipoles were calculated through MP2 calculations using a def2-SVP basis set.
By defining axes that lie along the dipole moment of the molecule and calculating the angle between the axes of a central and a surrounding molecule, the orientation due to the polar moment can be explored by calculation of the angular RDF, g(r,θ) (aRDF), using
(8)
(8) where
is the number of molecules in the distance range r + Δr and angle range, θ + Δθ; ρ is the bulk number density and the 1/sinθ factor corrects for the θ dependence of the solid angle when integrating over the azimuthal angle.
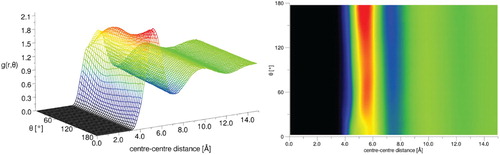
For the DMF molecules, the N-O axis, which lies close to the direction of dipole moment, was chosen as the principal axis for the calculation (as shown in Figure ). The aRDF (Figure ) reveals that beyond the first solvation shell there is no clear orientational preference for the molecules. However, in the first solvation shell, there is a marked preference for anti-parallel alignments, which give preferential dipole-dipole interactions. A preference for an anti-parallel arrangement of the N–O bonds in nearest neighbours is consistent with the orientation of the dominant dimer structures recently found in molecular simulations [Citation54].
Figure 9. Angular radial distribution function for liquid DMF where the angle theta is that between the vectors along the NO direction in the molecule (close to the molecular dipole)(left), the same data viewed in the theta/r plane with the g(r, theta) as the colour bar axis is shown on the right.
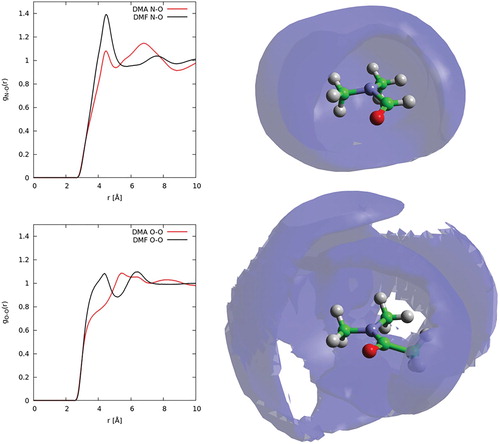
For DMA, the aRDF (Figure ) was calculated with the angle θ between the axes lying along the C2-O axis, i.e. the direction of the dipole moment (see Figure ). As with DMF, there is little orientational preference beyond the first solvation shell; however, unlike DMF, there is a slight orientational preference in the first solvation shell for parallel interactions. This arrangement suggests that dipole-dipole interactions are less dominant in DMA than for DMF. To investigate further, the N … O and O … O partial g(r)s for DMA and DMF are plotted alongside spatial density functions for the 20% most likely locations of oxygen atoms in the first solvation shell in Figure . For DMF, there is a clear preference for short-range N … O interactions compared to DMA, with a large peak at ∼4 Å. Similarly, the O … O show shorter range correlations in DMF compare to DMA. Conversely, DMA shows greater N … O correlations at a slightly longer range, peaking at ∼6 Å. This trend is also evident from inspections of the oxygen spatial density functions, where a clear second shell is shown for DMA that is not present in DMF.
Figure 10. Angular radial distribution function for liquid DMA where the angle theta is that between the vectors along the CO direction in the molecule (close to the molecular dipole) (left), the same data viewed in the θ/r plane with the g(r, θ) as the colour bar axis is shown on the right.
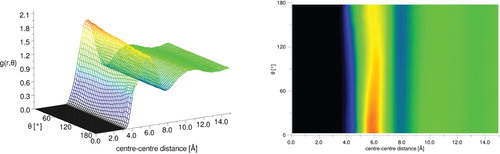
Figure 11. Left, partial radial distribution functions for N … O (top) and O … O (bottom) correlations in DMF (black curves) and DMA (red curves). Right, spatial density functions showing 20% most likely locations for oxygen atoms in first solvation shell for DMF (top) and DMA (bottom).
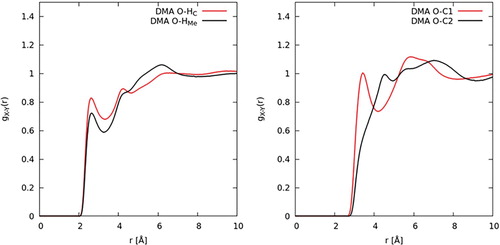
As discussed in the introduction, one of the prevalent issues in the literature relating to the structure of DMF is to what extent hydrogen bonding might dictate or govern its liquid structure. To investigate hydrogen bonding, the relevant intermolecular contacts between the carbonyl oxygen atom, O, and the donor groups, HMe–C1 and H2–C2, are studied first. The intermolecular site-site partial distribution functions between these atom types were calculated for both DMF (Figure ) and DMA (Figure ). As defined by Jeffrey [Citation55] for hydrogen bonding, donor-acceptor distances of 2.2–2.5 Å are ‘strong, mostly covalent’, 2.5–3.2 Å are ‘moderate, mostly electrostatic’, and 3.2–4.0 Å are ‘weak, electrostatic’. For both in DMF and DMA, the radial distribution functions show peaks occurring at 3.6 Å. As such, an initial examination of the O–C contacts seems to point to a weak electrostatic correlation. Figures and also show intermolecular contacts between the oxygen atom and the two distinct hydrogen atom species. The correlations are both characterised by peaks which occur at 2.7 Å. The second and third peaks in the O-HMe correlation are due to a longer range interactions between the oxygen and another hydrogen atom on the same C1 site. Though there is not a clear-cut defined critical distance where an interaction changes from hydrogen bonding to van der Waals interaction, the interaction still occurs a distance slightly larger than expected for a strong or moderate hydrogen bond.
Figure 12. EPSR derived site–site partial radial distribution functions for intermolecular pairs potentially involved in hydrogen bonding in DMF.
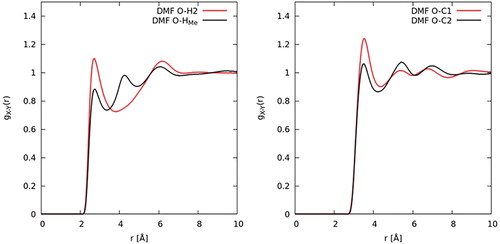
Figure 13. EPSR derived site–site partial radial distribution functions for intermolecular pairs potentially involved in hydrogen bonding in DMA.
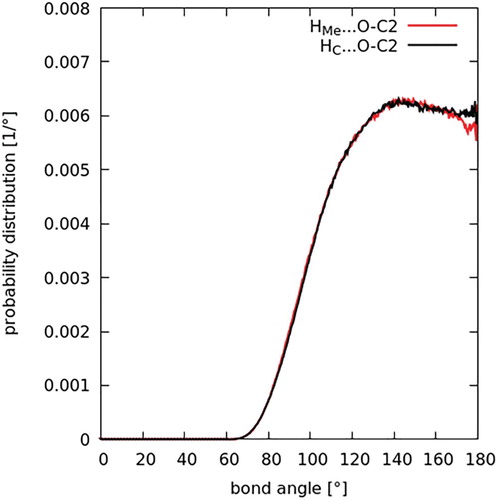
Another criterion, or key defining characteristic, for a hydrogen bond, as per the recently published IUPAC definition [Citation56], is its directionality. In a hydrogen bond, the intermolecular angle X–H … Y is generally linear (or 180°), with a suggested lower limit of 110° for this angle. The distribution of these angles in both DMF and DMA were therefore studied, in light of this criterion. Histograms of the intermolecular bond angles between the three atoms constituting the potentially hydrogen bond donating and accepting groups in both solvents were then computed (Figure for DMF and Figure for DMA). Specifically, the bond angles are C1–HMe … O and C2–H2 … O in DMF, and C1–HMe … O and C3–HC … O in DMA; and the data were converted to a probability function and normalised for the sinθ dependence with bonding angle θ. In both liquids, the probability is almost constant for angles greater than ∼130°, with a rapid rise from zero probability below 70° up to this point. The dependence is within the IUPAC range that is characteristic of hydrogen bonding. However, some of this angular dependence is likely due to steric interference preventing molecular geometries that allow acute bonding angles at such short distances.
Figure 14. Probability distribution function for hydrogen bonding angles in DMF.
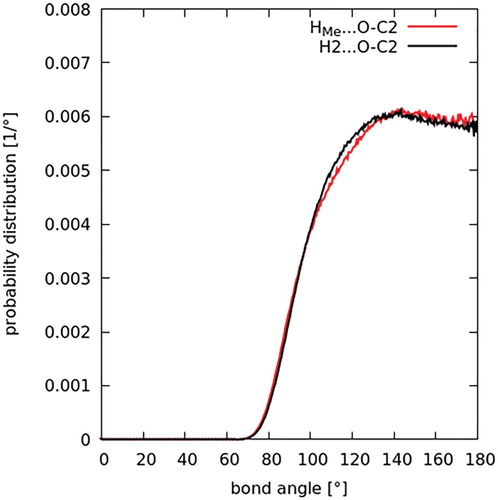
Figure 15. Probability distribution function for hydrogen bonding angles in DMA.
Discussion
Neutron diffraction with isotopic substitution, analysed by EPSR has been successfully used to elucidate the spatial and orientation correlations found for two common solvents, DMF and DMA. From a purely spatial analysis of the molecule centres, in both one and three dimensions, there is little difference between the liquids. However, analysis of the orientational correlations reveals opposite preferences for orientations of dipole moments in the first solvation shell, with DMF showing a small preference for anti-parallel alignment and DMA a slight preference for parallel alignment. This difference can be understood by the additional methyl group of the DMA giving greater preference to dispersion forces which are not direction dependant and/or the steric bulk of this methyl preventing favourable, anti-parallel, close approach of the molecules.
Analysis of the EPSR simulations has also allowed investigation of a commonly discussed issue in the literature for DMF; that of hydrogen bonding. Distances, angles and directionality trends were analysed for the H-donating and H-accepting groups in both solvents, and quantitative analysis of coordination numbers was performed. The findings point to weak hydrogen bonding in both solvents, that is electrostatic in nature.
The new structural details established here for DMF/DMA will help to develop a fuller understanding of their behaviour, in particular, their great solvating power and ability to facilitate/accelerate organic reactions. These results are also consistent with recent diffraction measurements of liquid NMP [Citation57], wherein it was argued that the solvent’s strongly developed local order/self-bonding and its intrinsically high configurational entropy rationalised its ability to dissolve both charged and uncharged nanomaterials [Citation30]. While less ordered than NMP, the rich structures seen here for DMF and (to a slightly lesser extent) DMA, are consistent with this argument, with the typical qualitative trend of nanomaterial dispersibility [Citation14] increasing with intrinsic solvent order (NMP > DMF ≈ DMA). The orientationally dependant 3D ordering found in these solvents echo recent conclusions that solvent ordering around nanomaterials is a multi-body problem and cannot be reduced to simple additive forces or generalised solvent properties such as surface energies [Citation58] but rather the full system needs to be adequately modelled to understand the dissolution.
Acknowledgements
We acknowledge the Science and Technology Facilities Council (STFC) for beam time at the ISIS Pulsed Neutron and Muon Source through allocations RB1610416 (doi:10.5286/ISIS.E.RB1610416) and RB1700030 (doi:10.5286/ISIS.E.RB1700030).
Disclosure statement
No potential conflict of interest was reported by the authors.
ORCID
A. J. Clancyhttp://orcid.org/0000-0002-1791-8999
M. S. P. Shafferhttp://orcid.org/0000-0001-9384-9043
N. T. Skipperhttp://orcid.org/0000-0003-2940-3084
T. F. Headen http://orcid.org/0000-0003-0095-5731
C. A. Howard http://orcid.org/0000-0003-2550-0012
Additional information
Funding
References
- E.H. Najib and R.W. Jahnke, Method of Rerefining Oil by Distillation and Extraction. US4021333A. (1975).
- C. Feng, K. Cheng, J. Lin, and C. Lee, Method for Making Environment-Friendly Artificial Leather from Ultra Micro Fiber Without Solvent Treatment. US20060218729. (2005).
- C.-H. Wong and K.-T. Wang, Experientia. 47, 1123 (1991). doi: 10.1007/BF01918376
- R. Taylor and O. Kennard, J. Am. Chem. Soc. 104, 5063 (1982). doi: 10.1021/ja00383a012
- J.I. Paredes, J.M.D. Tasco, and a. Martı, Experienta 24, 10560 (2008).
- C.-J. Shih, S. Lin, M.S. Strano, and D. Blankschtein, J. Am. Chem. Soc. 132, 14638 (2010). doi: 10.1021/ja1064284
- A.L. Tiano, L. Gibbons, M. Tsui, S.I. Applin, R. Silva, C. Park, and C.C. Fay, Nanoscale. 8, 4348 (2016). doi: 10.1039/C5NR08259E
- P.L. Cullen, K.M. Cox, M.K. Bin Subhan, L. Picco, O.D. Payton, D.J. Buckley, T.S. Miller, S.A. Hodge, N.T. Skipper, V. Tileli, and C.A. Howard, Nat. Chem. 9, 244 (2017). doi: 10.1038/nchem.2650
- T.S. Miller, T.M. Suter, A.M. Telford, L. Picco, O.D. Payton, F. Russell-Pavier, P.L. Cullen, A. Sella, M.S.P. Shaffer, J. Nelson, V. Tileli, P.F. McMillan, and C.A. Howard, Nano Lett. ACS. Nanolett. 7b01353 (2017).
- M.C. Watts, L. Picco, F.S. Russell-Pavier, P.L. Cullen, T.S. Miller, S.P. Bartuś, O.D. Payton, N.T. Skipper, V. Tileli, and C.A. Howard, Nature, 568, 216 (2019). doi: 10.1038/s41586-019-1074-x
- J. Liu, M.J. Casavant, M. Cox, D.A. Walters, P. Boul, W. Lu, A.J. Rimberg, K.A. Smith, D.T. Colbert, and R.E. Smalley, Chem. Phys. Lett. 303, 125 (1999). doi: 10.1016/S0009-2614(99)00209-2
- C.A. Furtado, U.J. Kim, H.R. Gutierrez, L. Pan, E.C. Dickey, and P.C. Eklund, J. Am. Chem. Soc. 126, 6095 (2004). doi: 10.1021/ja039588a
- Q. Li, I. A. Kinloch, and A.H. Windle, Chem. Commun. (Camb). 3283 (2005). doi: 10.1039/b419039d
- S.D. Bergin, Z. Sun, D. Rickard, P.V Streich, J.P. Hamilton, and J.N. Coleman, ACS Nano. 3, 2340 (2009).
- Q. Cheng, S. Debnath, L. O’Neill, T.G. Hedderman, E. Gregan, and H.J. Byrne, J. Phys. Chem. C. 114, 4857 (2010). doi: 10.1021/jp911202d
- O.V. Kharissova, B.I. Kharisov, and E.G. de Casas Ortiz, RSC Adv. 3, 24812 (2013). doi: 10.1039/c3ra43852j
- S. Fogden, C.A. Howard, R.K. Heenan, N.T. Skipper, and M.S.P. Shaffer, ACS Nano. 6, 54 (2012). doi: 10.1021/nn2041494
- A.A. Dyshin, O.V. Eliseeva, G.V. Bondarenko, A.M. Kolker, and M.G. Kiselev, Russ. J. Phys. Chem. A. 90, 2434 (2016). doi: 10.1134/S0036024416120086
- B.J. Landi, H.J. Ruf, J.J. Worman, and R.P. Raffaelle, J. Phys. Chem. B. 108, 17089 (2004). doi: 10.1021/jp047521j
- A.J. Clancy, J. Melbourne, and M.S.P. Shaffer, J. Mater. Chem. A. 3, 16708 (2015). doi: 10.1039/C5TA03561A
- C.M. Marson, Tetrahedron 48, 3659 (1992). doi: 10.1016/S0040-4020(01)92263-X
- A.J. Clancy, J.M. Serginson, J.L. Greenfield, and M.S.P. Shaffer, Polymer (Guildf). 133, 263 (2017). doi: 10.1016/j.polymer.2017.10.047
- J. Miller and A.J. Parker, J. Chem. Soc. 83, 117 (1961). doi: 10.1021/ja01462a023
- W. Garbrecht, Cephalosporin Process and Product. US3781282A. (1973).
- Y. Lin, R. Wallace, and D. White, Nouveaux Agents de Contraste aux Rayons X, Composition et Procede de Preparation. EP0558484A1. (1990).
- V.B. Gupta and V.K. Kothari, Manufactured Fibre Technology (Springer, Netherlands, 1997).
- C.E. Sroog, A.L. Endrey, S.V. Abramo, C.E. Berr, W.M. Edwards, and K.L. Olivier, J. Polym. Sci. Part A Gen. Pap. 3, 1373 (1965). doi: 10.1002/pol.1965.100030410
- H.S. Leese, L. Govada, E. Saridakis, S. Khurshid, R. Menzel, T. Morishita, A.J. Clancy, E.R. White, N.E. Chayen, and M.S.P. Shaffer, Chem. Sci. 7, 2916 (2016). doi: 10.1039/C5SC03595C
- A.J. Clancy, D.B. Anthony, S.J. Fisher, H.S. Leese, C.S. Roberts, and M.S.P. Shaffer, Nanoscale. 9, 8764 (2017). doi: 10.1039/C7NR00734E
- A.J. Clancy, M.K. Bayazit, S.A. Hodge, N.T. Skipper, C.A. Howard, and M.S.P. Shaffer, Chem. Rev. 118, 7363 (2018). doi: 10.1021/acs.chemrev.8b00128
- R. Ludwig, F. Weinhold, and T.C. Farrar, J. Chem. Phys. 103, 3636 (1995). doi: 10.1063/1.470040
- F.-J. Wiesmann, M.D. Zeidler, H. Bertagnolli, and P. Chieux, Mol. Phys. 57, 275 (1986). doi: 10.1080/00268978600100211
- J.M.M. Cordeiro, Int. J. Quantum Chem. 65, 709 (1997). doi: 10.1002/(SICI)1097-461X(1997)65:5<709::AID-QUA37>3.0.CO;2-U
- G. Desiraju and T. Steiner, The Weak Hydrogen Bond (Oxford University Press, Oxford, 2001).
- G. Fini and P. Mirone, J. Chem. Soc. Faraday Trans. 2. 70, 1776 (1974). doi: 10.1039/F29747001776
- H. Ohtaki, S. Itoh, T. Yamaguchi, S. Ishiguro, and B.M. Rode, Bull. Chem. Soc. Jpn. 56, 3406 (1983). doi: 10.1246/bcsj.56.3406
- T. Radnai, S. Itoh, and H. Ohtaki, Bull. Chem. Soc. Jpn. 61, 3845 (1988). doi: 10.1246/bcsj.61.3845
- X.G. Wu Jinguang, L. Xiangxing, L. Yingzhang, and G. Hai, Chem. J. Chinese Univ. 6, 729 (1984).
- R. Vargas, J. Garza, D.A. Dixon, and B.P. Hay, J. Am. Chem. Soc. 122, 4750 (2000). doi: 10.1021/ja993600a
- M.S. Manjunath, P. Sivagurunathan, and J. Sannappa, E-Journal Chem. 6, S143 (2009).
- Q. Liu, M. Li, Y. Gu, Y. Zhang, S. Wang, Q. Li, and Z. Zhang, Nanoscale. 6, 4338 (2014). doi: 10.1039/C3NR06704A
- G.Z. Jia, F. Wang, X.Q. Yang, and J. Qian, J. Mol. Liq. 197, 328 (2014). doi: 10.1016/j.molliq.2014.04.024
- H.E. Fischer, A C. Barnes, and P.S. Salmon, Reports Prog. Phys. 69, 233 (2010). doi: 10.1088/0034-4885/69/1/R05
- D.T. Bowron, A.K. Soper, K. Jones, S. Ansell, S. Birch, J. Norris, L. Perrott, D. Riedel, N.J. Rhodes, S.R. Wakefield, A. Botti, M.-A. Ricci, F. Grazzi, and M. Zoppi, Rev. Sci. Instrum. 81, (2010). doi: 10.1063/1.3331655
- A.K. Soper, RAL Reports, Didcot, UK, (2011).
- A.K. Soper, Mol. Phys. 107, 1667 (2009). doi: 10.1080/00268970903025667
- A.K. Soper, ISNR Phys. Chem. 2013, 1 (2013).
- A.K. Soper, Phys. Rev. B. 72, 104204 (2005). doi: 10.1103/PhysRevB.72.104204
- W.L. Jorgensen and C.J. Swenson, J. Am. Chem. Soc. 107, 1489 (1985). doi: 10.1021/ja00292a007
- W.L. Jorgensen and J. Tirado-Rives, J. Am. Chem. Soc. 110, 1657 (1988). doi: 10.1021/ja00214a001
- T.G.A. Youngs, DLPUtils: https://Www.Projectaten.Com/Dlputils (n.d.).
- T.G.A. Youngs, J. Comput. Chem. 31, 639 (2010).
- W. Gao, H. Niu, T. Lin, X. Wang, and L. Kong, J. Chem. Phys. 140, 44501 (2014). doi: 10.1063/1.4861893
- C. Zhang, Z. Ren, L. Liu, and Z. Yin, Mol. Simul. 39, 875 (2013). doi: 10.1080/08927022.2013.775438
- G.A. Jeffrey, An Introduction to Hydrogen Bonding (Oxford University Press, Oxford, 1997).
- E. Arunan, G.R. Desiraju, R.A. Klein, J. Sadlej, S. Scheiner, I. Alkorta, D.C. Clary, R.H. Crabtree, J.J. Dannenberg, P. Hobza, H.G. Kjaergaard, A.C. Legon, B. Mennucci, and D.J. Nesbitt, Pure Appl. Chem. 83, 1619 (2011). doi: 10.1351/PAC-REP-10-01-01
- N.S. Basma, T.F. Headen, M.S.P. Shaffer, N.T. Skipper, and C.A. Howard, J. Phys. Chem. B. 122, 8963 (2018). doi: 10.1021/acs.jpcb.8b08020
- C.A. Silvera Batista, R.G. Larson, and N.A. Kotov, Science ( 80-.). 350, 1242477 (2015). doi: 10.1126/science.1242477