
 ?Mathematical formulae have been encoded as MathML and are displayed in this HTML version using MathJax in order to improve their display. Uncheck the box to turn MathJax off. This feature requires Javascript. Click on a formula to zoom.
Abstract
We present an extensive analysis of one- and two-photon absorption processes in some organic host-guest (H-G) complexes using linear and quadratic response theory within the framework of time-dependent density functional theory. For this purpose, we have considered all possible 20 host-guest complexes constructed from 4 host and 5 guest molecules. We have analysed how the one- and two-photon activity of the host and guest molecules are transferred to the respective host-guest complexes and how the electron donating and electron accepting ability of host-guest complexes affect their two-photon activity. Based on an analysis using the concept of channel interference, we have performed an in-depth analysis of the two-photon absorption processes in all these systems and provided a microscopic explanation for their variation among different complexes.
GRAPHICAL ABSTRACT
1. Introduction
The chemistry of host-guest systems, where two identical or different subsystems (molecules/ions) are held together and interact with each other in a non-covalent way, such as via van der Waals forces, hydrogen bonding, or π –π interactions, falls under the broad subject area of ‘supramolecular chemistry’ and ‘molecular recognition’ [Citation1,Citation2]. As the name suggests, a host-guest system consists of two components – a host and a guest, both of which can either be neutral molecules or ions. The host generally has a cavity-like space or a suitable space to hold another molecule, which is then called the guest. Such systems are also recognised in biology [Citation3], where they are denoted as enzyme-receptor systems and/or lock-key system. Protein folding processes involve excellent examples of host-guest systems in biology [Citation4]. Currently, a main driving force for the interest in host-guest systems is their potential role in cutting-edge advances in fields such as nano-technology [Citation5], green chemistry, catalyst design [Citation6], and medicinal chemistry [Citation7] to mention a few.
The synthesis of crown ethers, which are known to bind specific cations selectively, by Pederson et al. in 1967 was the beginning of host-guest chemistry [Citation8,Citation9]. Since then several other hosts, for example, cyclodextrins [Citation10,Citation11], calixarenes [Citation12,Citation13], cucurbiturils [Citation14,Citation15] etc. have been synthesised and studied extensively. These molecules host different types of molecules or ions. Recently, ExBox and Ex
Box
have been synthesised by Stoddart et al. in 2013 [Citation16]. These systems take a box-like structure and host a number of polycyclic aromatic hydrocarbons [Citation16,Citation17]. One year later, in 2014, Das and Chattaraj theoretically studied host-guest systems consisting of ExBox
and aromatic hydrocarbons/azine [Citation18]. Pillar[n]arenes, pillar-shaped macrocyclic hosts with a hydrophobic cavity, can accommodate different guest molecules, and were synthesised by Ogoshi et al. in 2008 [Citation19]. The progress in host-guest chemistry of pillar[n]arenes is well documented in a recent review by Guo et al. [Citation3].
Another well-known type of host molecules that can host aromatic guest molecules are molecular tweezers [Citation20]. These were first synthesised in 1978 by Whitlock and Chen and are characterised by two more or less rigid and flat aromatic pincers separated from each other by a covalently bonded spacer [Citation20]. Based on their study, Whitlock and Chen concluded that the binding of an aromatic guest molecule in molecular tweezers is enhanced if two rigid pincers in the latter are in syn conformation and separated from each other by a distance of 7 Å [Citation20]. Based on this strategy, several other tweezer molecules have been synthesised and studied [Citation21–23]. Such systems have also been studied and explored theoretically. Recently, in 2012, Jacquemin et al. [Citation24] used dispersion-corrected density functionals to study the interaction of small organic molecules with a moleular tweezer. In another theoretical study, Grimme et al. [Citation25,Citation26] studied the geometries and binding energies of molecular tweezers and clips with six different aliphatic and aromatic substrates. In 2009, Chakrabarti and Ruud theoretically studied the two-photon absorption (TPA) process in the molecular tweezer-TNF host-guest system [Citation27]. They found that tweezer-TNF display a very large TPA cross-section as compared to the constituents. In another work, the same authors theoretically studied the TPA process in yet another host-guest system – fullerene bound in a buckycatcher [Citation28]. In this complex, they observed that one of the constituents (buckycatcher) has much larger TPA cross-section than the complex itself. Nevertheless, the complex showed fairly large TPA cross sections at desirable near-IR wavelengths. This was later confirmed experimentally [Citation29]. Several other theoretical studies have also been conducted on systems having molecular tweezers as host and other organic molecules as guest [Citation30–33]. All these works clearly indicate that molecular properties change when two systems combine together to form a host-guest system. However, questions such as how the nature of the host and guest molecules as electron donor and/or acceptor influences the overall molecular properties such as TPA has not yet been addressed. To fill this gap, in the present work we study the TPA process in a number of host-guest complexes. We will also study the role of the donor/acceptor nature of the host and guest molecules on the two-photon absorption (TPA) process in the resultant host-guest systems.
The rest of the paper is organised as follows. In Section 2 we describe the computational details, before we in Section 3 discuss our results. We start this latter discussion by considering the structures and binding energies of the complexes in Section 3.1, before we turn to a discussion of one-photon and two-photon absorption properties of these complexes in Sections 3.2 and 3.3, respectively. We then analyse the origins of the TPA using a generalised few-state model (GFSM) in Section 3.4. We end the paper with a summary and some concluding remarks in Section 4.
2. Computational details
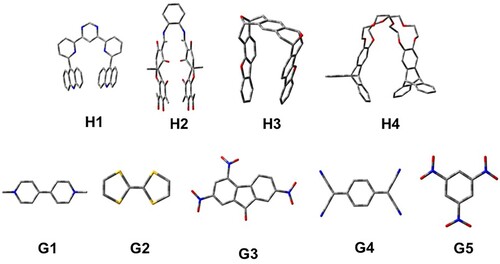
For this work, we have considered 4 host (H1–H4) and 5 guest (G1–G5) molecules, as shown in Figure . By considering all possibilities of the host and guest combinations, these 9 molecules give a total of 20 host-guest (H–G) complexes. We have considered all these 29 molecules (4 H, 5 G, and 20 H–G) in this work. 11 out of these 29 molecules have been synthesised and studied for various properties by different researchers. For example, H1, G3 and H1G3 have been synthesised by Petitjean in 2004 [Citation34]. The TPA properties of these molecules have been studied theoretically by Chakrabarti and Ruud in 2009 [Citation27]. Furthermore, the role of dipole alignment (a.k.a. channel interference) on the TPA in the H1G3 complex has been explored theoretically by Alam et al. in 2012 [Citation35]. In the same year, Friese et al. [Citation30] studied the TPA in a slightly modified H1G3 complex at the CC2 level of theory. The H4, G1 and H4G1 have been synthesised by Peng et al. in 2007 [Citation36]. The molecule H2, which is a chiral tweezer, and the complex H2G3 have been synthesised by Legouin et al. in 2009 [Citation37]. Another chiral tweezer H3, the guest G5 and the complex H3G5 have been syntesised by Harmata et al. in 1990 [Citation38].
Figure 1. Structures of host and guest molecules considered in this work.
The ground-state geometries of all the 29 systems in vacuum have been optimised at the B3LYP/6-311G(d,p) level of theory with tight convergence criteria, fine or ultrafine grid for integration and empirical dispersion GD3B [Citation39], as implemented in the Gaussian16 program package [Citation40]. We observed that 9 out of the 29 systems display very small () imaginary frequencies. All of the systems having imaginary frequencies are either the host molecules or host-guest complexes. A close inspection of these imaginary frequencies indicate that the imaginary frequencies correspond to a slow movement of two pincers in the host molecule and/or the slow movement of the guest molecule in the respective host-guest systems. Therefore, these imaginary frequencies can be attributed to the floppy structures of the host and/or host-guest systems. The small imaginary frequencies due to the floppy structure of the molecules are very difficult to remove. The maximum values of the imaginary frequencies we encountered were in the range i1.6–
. We tried without success, the verytight optimisation criterion in combination with superfine integration grid. Apart from this, we also tried without any success, to start the geometry optimisation from different initial structures. After the failure of all these attempts in converging to a true minimum energy structure, we moved to the last resort i.e. using a different combination of exchange-correlation functional and basis set. Finally, for all the problematic cases we obtained converged ground-state geometries with all real vibrational frequencies at the MPW1PW91/6-311G(d) level of theory. For further calculations, we took the fully converged geometries only.
After geometry optimisation and vibrational frequency calculations, we performed linear and quadratic response theory [Citation41] calculations on all the 29 systems at the CAM-B3LYP/cc-pVDZ level of theory as implemented in the LSDALTON code [Citation42,Citation43] to obtain the one- and two-photon absorption (OPA and TPA) parameters along with the transition dipole moment matrix elements between different states. The CAM-B3LYP functional was chosen due to its excellent performance for charge-transfer excitations [Citation44–46], as many of the relevant TPA intense transitions correspond to charge-transfer transitions to/from the host from/to the guest molecule (vide infra). Transition dipole moment matrix element calculations in LSDALTON allow the value of transition dipole moment vectors for transitions between different states to be obtained, i.e. for both ground to excited state transitions as well as for transitions between two excited states). It also gives the values of dipole moments of the ground and different excited states. The OPA parameters and transition dipole moments have been calculated for the first 10 singlet excited states in each molecule. However, considering the size of the systems and the computationally expensive feature of quadratic response theory calculations, we restrict ourselves to TPA of the first 4 singlet-excited states in each system. Using the transition dipole moment elements and one-photon absorption parameters, we have performed an in-depth channel interference analysis of the TPA processes in all the systems considered. All the calculations are performed in vacuum.
3. Results and discussions
The Cartesian coordinates of the optimised ground-state geometries of all the 29 systems considered in this work have been provided in the supporting information. The optimised structures of all the host-guest systems are shown in Figure . It is interesting to note that the two pincers in the optimised geometry of the pristine host molecules are usually not parallel to each other. However, in the host-guest systems, the two pincers are mostly parallel to each other. The distances between two pincers in each of the 20 H-G complexes as well as in the pristine host molecules are presented in Table , and correspond to the distances between the centroids of two pincers in the respective systems. The distance obtained for the H2G3 complex matches excellently (7.07Å vs 7.02Å) the result obtained for a similar complex using the B97-D functional by Granton et al. [Citation24] In general, the distances in the H-G complexes are almost the same as those in the respective pristine host molecules. However, in the HnGm (n = 2, 3;m = 1−5) complexes, these differences are noticeably larger. This is correlated with a larger number of electronegative atoms in the pincers of the H-G complexes. The unusually larger distance in these H4G3 and H4G5 complexes are due to the proximity of the oxygen atoms present in the G3 and G5 guest molecules with the eight oxygen atom in H4.
Figure 2. Structures of all 20 host-guest complexes considered in this work.
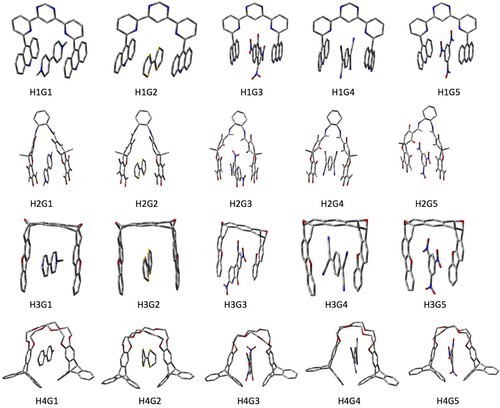
Table 1. Distance (in Å) between the two pincers in pristine host molecules as well as in 20 host-guest complexes.
3.1. Dispersion and interaction energies of the host-guest complexes
For a non-bonded complex AB, where A and B are the two constituent subsystems of the complex, the counterpoise-corrected binding energy
is given by [Citation47]
(1)
(1) where
and
are respectively the energy of the complex, subsystem A and subsystem B, calculated using the basis set for the complex.
Dispersion forces play an important role in the the bonding of the host-guest complexes [Citation24]. From Table , where we report the counterpoise-corrected binding energy both with and without dispersion corrections in the exchange–correlation functional, it is clear that this also applies to our host-guest complexes. The binding energies have been calculated at the same level of theory as used for geometry optimisation, using the counterpoise method implemented in the Gaussian16 program package.
Table 2. Binding energies (in kCal/mol) of all the 20 host-guest complexes considered in this work. The first number in each cell represents the binding energy obtained after including dispersion correction in the calculation, whereas the second number represent the same without dispersion correction.
The data in Table show that without dispersion corrections, none of these complexes would be stable. We also note that the H1 and H2 molecules form the most stable complex with the G3 molecule, whereas H3 and H4 hosts form the most stable complex with G4. In general, the complex of any of the four host molecules with G3 are very stable. The most stable host-guest complex is H4G4 and the least stable one is H1G2
. H4G3 is the second most stable complex
.
3.2. One-Photon absorption in host, guest, and host-guest molecules
Theoretically, one-photon absorption (OPA) is characterised by the unitless oscillator strength (), given as [Citation48]
(2)
(2) where
and
are, respectively, the excitation energies and transition dipole moment vector for a transition between states
and
. In addition to this, useful insights about an OPA process in a compound can also be obtained from the contributions of different orbital transitions. The numerical data for OPA parameters (
,
, and respective orbital contributions) of all systems studied here are presented in the supporting information.
OPA data for the brightest OPA state of the four lowest singlet-excited states for each host and guest molecule are presented in Tables –, respectively.
Table 3. One-photon absorption parameters for the brightest state in four host molecules, calculated at the CAM-B3LYP/cc-pVDZ level of theory.
Table 4. One-photon absorption parameters for the brightest state in five guest molecules, calculated at the CAM-B3LYP/cc-pVDZ level of theory.
Table 5. One-photon absorption parameters for the brightest state in 20 host-guest molecules, calculated at the CAM-B3LYP/cc-pVDZ level of theory.
The data in the supporting information suggest that among the four host molecules, the fourth singlet-excited state of H3 is the most OPA active state. It has a single strong peak at 254 nm with . This peak is in fact a combination of two peaks – one at 254 nm (
) and another one at 259 nm (
). H1 has three distinct peaks at around 342 nm, 302 nm, and 280 nm, among which the first one has the largest
value. The other two hosts, i.e. H2 and H4, has two peaks each – H2 (285 nm, 308 nm) and H4 (250 nm, 257 nm). It is interesting to note that the brightest peak in both H3 and H4 appears at almost the same wavelength, but their
differ significantly, whereas H1 and H2 have a set of equally intense peaks close to each other.
A further analysis of the absorption peaks and the corresponding orbital contributions shows that the intense peaks in H1 arise from transfer of charge density from HOMO (H) and HOMO-1 (H-1) to LUMO (L) and LUMO+1 (L+1). These pictures clearly reflect that the orbital transitions are local (π-electron reorganisation) in nature. The electron density in all the four involved orbitals are either accumulated on the two pincers of the molecules or on the bridge connecting the two pincers. The most intense peak in H1 has the largest contribution from the H-1L orbital transition, which is basically a charge-transfer excitation from the two pincers to the bridge. The most intense peak in H3 have major contributions from two orbital transitions viz. H-1
L and H
L+1. Similar to the H1 case, here also all the transitions are local in nature. The two peaks for the remaining two host molecules (H2 and H4) also arise from more than one local transition. The orbital transitions involved in the most intense one-photon peaks in different host molecules are shown in the supporting information. The absence of any distinct donor/acceptor part in these host molecules explains the local nature of these transitions.
Among the five guest molecules, G1 and G4 are the two showing the strongest one-photon activity, with values of 1.18 (at 336 nm) and 1.13 (at 390 nm) respectively. The other three guest molecules, G2, G3 and G5 have the brightest peak with
values of 0.39 (at 256 nm), 0.12 (at 273 nm), and 0.29 (at 212 nm), respectively. G3 has another bright peak at 332 nm with
. Due to the symmetric structure of the G5 molecule, its brightest peak is two-fold degenerate. An orbital analysis of these peaks in the guest molecules indicate that the brightest peaks in G1 and G4 have the largest contribution from the respective H
L orbital transitions and in both these molecules the transitions involve
electron density reorganisation. In G2, the brightest peak results from the H
L+3 and H
L+5 orbital transitions, which are also local in nature. Similarly, in G3, the brightest peak has major contributions from the local H-2
L and H
L+1 orbital transitions. Finally, the brightest peaks in G5 have contributions from both H
L and H-1
L+1 orbital transitions.
The OPA parameters of the brightest state in all the 20 host-guest molecules are presented in Table . The data reveals that, among different H-G complexes only those having either G1 or G4 as guest, show the strongest one-photon activity. The H1G1 complex is, however, an exception. This complex has a much smaller (=0.03) value, as compared to the other H1Gn (n = 2−5) complexes. In contrast to this, except H1G2, all the other unions of the G2, G3 and G5 molecules with any of the host molecules gives weak one-photon active host-guest complexes. The through-space charge-transfer nature i.e. transfer of electron density from host to guest or vice-versa) in all the host-guest complexes are visible from the pictures of the contributing orbital transitions. However, not all complexes involve through-space charge-transfer for their brightest OPA state. For example, in the H1G2, H2G1, H2G4, H3G5, H4G2 complexes, the brightest OPA involves a local transition, i.e. a π-electron reorganisation either within the host molecule or within the guest molecule.
3.3. Two-photon absorption in hosts, guests and host-guest systems
Within the framework of time-dependent density functional theory, the probability of a two-photon transition from the ground state to a final excited state
by a single beam of linearly polarised monochromatic light is given by [Citation41,Citation49,Citation50]
(3)
(3) where S is a tensor of rank 2 and is called the two-photon transition moment tensor. The
element
of this tensor is given as [Citation49,Citation51]
(4)
(4) where
,
is the
component of the one-photon transition moment integral for transition
and
is the corresponding excitation energy. The calculated two-photon transition probabilities
for the brightest TP active state in all hosts, guests and host-guest molecules are presented in Table . A complete table for all the four excited states considered in this work are given in the supporting information.
Table 6. Two-photon transition probability of the brightest two-photon active state in all host, guest and host-guest molecules, calculated at the CAM-B3LYP/cc-pVDZ level of theory. The digits in parenthesis represents the corresponding excited state. All the values are reported in units of  a.u.
a.u.
We note that the host-guest complexes, in general, display larger TP activity than their respective constituents, i.e. the pristine host and guest molecules, as have also been observed previously [Citation27,Citation28]. This is, however, not true for the H2G5 and H4G2 complexes. The TP cross sections of these complexes are smaller than either both or one of the two constituents. Among the four host molecules, H2 has the largest value for . Similarly, among the five guest molecules, G4 is the most TP active molecule with
. When H2 and G4 combine, they result in a complex having a large TP activity with
However, it is interesting to note that H2G4 is only the second most TP active complex. The H1G1 complex, obtained by combining the less TP active guest G1
with the least TP active host H1
, gives rise to the most TP active complex with
. In general, TP activity of the pristine host or guest molecules does not aid in the prediction of the TP activity of the resultant H-G complexes. The first three most TP active H-G complexes are H1G1, H2G4, and H2G1 with
values of
a.u.,
a.u., and
a.u. respectively.
In order to understand in more detail the TP activity of different H-G complexes, we have analysed the orbitals involved. The orbital information for the brightest TP active state in each complex is presented in Table and the orbital pictures are shown in Figures –. The true through-space charge transfer nature of the brightest TP state in all these complexes are revealed by the corresponding orbital transitions. In general, in H-G complexes, either the host molecule behaves as a donor and the guest molecule as acceptor or vice versa. The donor/acceptor nature of the host/guest molecules may vary in different H-G complexes. We note that the orbital pictures reveal this information. One can observe that in all HnG1, and HnG2 (n = 1−4) complexes, the electronic density transfers from the guest to the host molecule. Therefore, in all these complexes, the guests behave as electron donor. In contrast, in all the HnG3, HnG4 and HnG5 (n = 1−4) complexes, electronic transitions take place from the host to the guest molecule and hence in all these complexes, the guests act as electron acceptor. This can be understood by considering the atomic composition of the guest molecules. In contrast to the G1 and G2 molecules, G3, G4, and G5 have strong electron-attracting (nitro- and cyano) groups. Interestingly, the highest TPA transition probability among the 20 complexes is obtained for the complex where the guest acts as electron donor. Three of the five strongest TP-active H-G complexes have the guest as donor. Although the donor/acceptor character of the host/guest molecules and the orbital analysis shed important light on the TP activity of the H-G complexes, these do not reveal anything about the corresponding variation of . To fill this gap, we have performed an in-depth few-state model analysis for the brightest TP active state in all the 20 H-G complexes, as will be discussed in the next subsection.
Figure 3. Contributing orbitals to the brightest TPA transition in the H1Gn (n = 1–5) H-G complex.
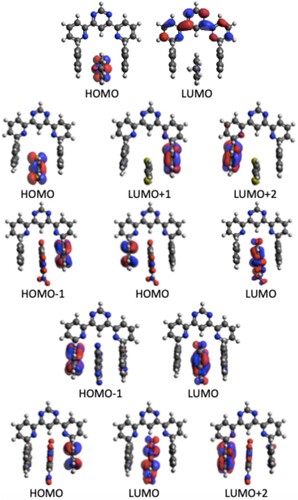
Figure 4. Contributing orbitals to the brightest TPA transition in the H2Gn (n = 1–5) H-G complex.
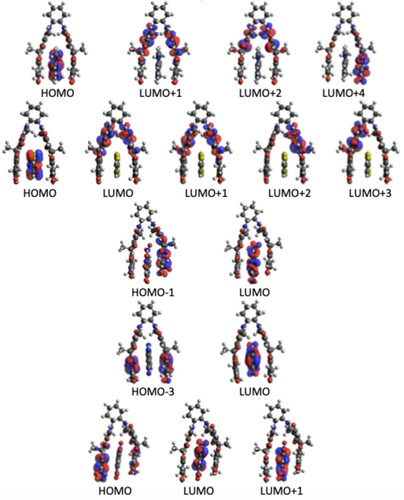
Figure 5. Contributing orbitals to the brightest TPA transition in the H3Gn (n = 1–5) H-G complex.
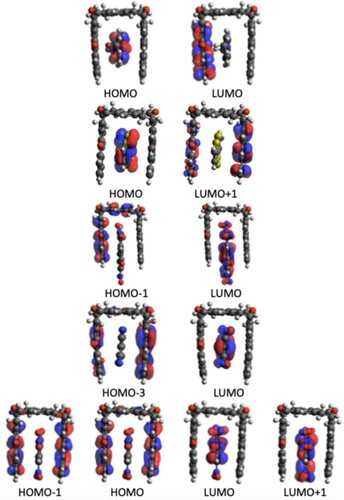
Figure 6. Contributing orbitals to the brightest TPA transition in the H4Gn (n = 1–5) H-G complex.
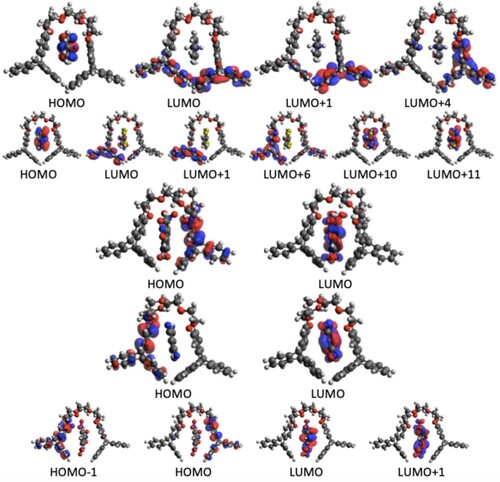
Table 7. Contribution of different orbital transitions in the brightest TPA in all the complexes. In each cell, the orbital transitions are arranged in decreasing order of their contributions.
3.4. Few-state model analysis of TPA in the H-G complexes
Equations (Equation3(3)
(3) ) and (Equation4
(4)
(4) ) describe TPA as a sum-over-states process. In principle, all the states should be considered in the summation in Equation (Equation4
(4)
(4) ). However, in real molecular systems, this is impractical. In reality, particularly in case of charge-transfer transitions, only a few states contribute significantly to the overall two-photon activity of the system. Therefore, it is reasonable to consider only those essential states in the summation. This is the main spirit of the well-known few-state model approach [Citation35,Citation52–55]. In addition to bring simplicity to the calculations, few-state models have an additional advantage, enabling the study of the effect of dipole alignment on TPA, i.e. the effect of relative orientations of different transition dipole moment vectors. Since different transition dipole moment vectors are directly related to the structure of the molecule, this additional information allows few-state models to reveal important structure-property relationships [Citation35,Citation56–64]. Recently, a generalised few-state model formula (GFSM) has been developed by the present authors [Citation59,Citation65]. According to the GFSM, the TP transition probability within the framework of TD-DFT is given as [Citation54,Citation55,Citation59,Citation65]
(5)
(5) where
(6)
(6) where
and
is the angle between transition dipole moment vectors
and
. Other terms have their usual meanings.
Equations (Equation5(5)
(5) ) and (Equation6
(6)
(6) ) have been employed to re-evaluate the TP transition probability of the brightest TP active state in all the 20 complexes using two to eleven states in the sum-over-states expression. In most of the cases we have observed that only a few terms within the 2–3 state models are sufficient for getting a qualitatively satisfactory agreement with the response theory results. Other terms are either very small or are cancelled by some other term. The result for different
(within the three-state model) for the brightest TP-active state in all the 20 H-G complexes are presented in Table and the corresponding transition dipole moments, excitation energies, and angle terms (the term in parenthesis in Equation (Equation6
(6)
(6) )) are presented in Table . One can notice that in all cases, the intermediate state in the three-state model (3SM) is either the next higher excited state or the previous lower excited state to the final two-photon active state.
Table 8. Different (in a.u.) involved in three-state model for the brightest TP active state in all the 20 host-guest complexes. The three-state model is constructed by taking ground state , one intermediate state , and brightest TP active state . The numbers in parenthesis in column 1 represent the intermediate and final states respectively. is the sum of all the δ-components given in a row.
Table 9. (Transition) Dipole moments, excitation energies, and angle term (the term in curly braces in Equation (Equation6(6) (6) )) corresponding to each δ-component presented in Table . All the dipole moments and excitation energies are in atomic units.
The 3SM results are in excellent agreement with the response theory results, with relative error for the first three strongest two-photon active complexes (H1G1, H2G4, and H2G1) being about respectively. In the H1G1 complex, the components
and
, contributes
to
. The data in Table clearly indicates that this is due to a very large value of
and
. The angle terms for these three δ-components are also very close to the maximum value of +3. The second most two-photon active complex, H2G4, has the largest contribution from
, which is due to large values of
. Interestingly, this complex has a very large value for the ground-state dipole moment and also the
terms, but still the corresponding
component has a very small value. This is due to a very small value for
. This complex has large negative contributions from the
and
components. This is also the reason for it not being the strongest two-photon active complex. In the third strongest two-photon active complex H2G1, the large contributions come from the
and
components, which is because of large values of
and
. The angle terms are not large. For the
component, the angle term is negative. Owing to the negative energy term, the overall value of
becomes positive. This complex has a negative contribution from
. The negative contribution does not come from the relative orientations of the transition dipole moment vectors, rather it comes from the negative energy term.
The data in Table indicate that the common feature among the first few highest TP active complexes is that all of them have very large values for and
. Usually, the contributions of the other two transition dipole moments viz.
and
are much smaller, although there are exceptions. Usually, H-G complexes, irrespective of the host molecule, having guest molecules with the N-atom as the only hetero atom possess large TP activity. However, the validity of this point should be confirmed by carrying out similar study on more H-G complexes.
4. Conclusions
We have studied the structure, binding energies and one- and two-photon absorption properties in 29 molecules, including 20 host-guest complexes consisting of one host and one guest molecule from a set of 4 host and 5 guest molecules. For this purpose, we have employed DFT and linear and quadratic response theory within the framework of TD-DFT. For explaining the variation of two-photon absorption properties in the host-guest complexes, we have further employed a generalised few-state model. Our results for the structure of all these molecules indicate that the distance between the two pincers in host molecules in H2Gn and H3G complexes are significantly larger than those in pristine host molecules, which is due to larger number of heteroatoms in the hosts. We have shown that dispersion corrections are essential in order to make these complexes stable minima, confirming that dispersion plays a crucial role in stability of these host-guest complexes. We have found that among the different guest molecules, G1 and G4 are the most one-photon active molecules and this property is also transferred to their host-guest complexes. Thus, except in the case of H1G1, all the HnG1 and HnG4 complexes are the most one-photon active complexes of their respective group. However, this property is not transferred in case of host molecules. That is, the most one-photon active host molecule (H3) does not form the most one-photon active complex. The relative two-photon activity of the host- and guest- molecules are also not transferred to their respective host-guest complexes. The most TP active host-guest complex is obtained when the least TP active host combines with a moderately TP active guest molecule. The orbitals involved in the TP transition of the host-guest complexes reflect that the complex having the host molecule as electron acceptor and guest as electron donor have the maximum TP activity. We have noticed that the complexes having the host as a donor and guest as acceptor show relatively poor TP activity. The TP activity of all the host-guest complexes have been revisited by using a three-state model, which is found to reproduce the response theory results quantitatively.
Disclosure statement
No potential conflict of interest was reported by the author(s).
Additional information
Funding
References
- P.A. Kollman, in Computational Approaches in Supramolecular Chemistry, edited by G. Wipff (Springer, Netherlands, Dordrecht, 1994), Chap. The Nature of Molecular Recognition: Examples from Host/Guest Chemistry, pp. 175–181.
- F. Guo, Y. Sun, B. Xi, and G. Diao, Supramol. Chem. 30 (2), 81–92 (2018).
- G. Yu and X. Chen, Theranostics 9, 3041–3074 (2019).
- S. van Dun, C. Ottmann, L.G. Milroy, and L. Brunsveld, J. Am. Chem. Soc. 139 (40), 13960–13968 (2017).
- X.Y. Ling, D.N. Reinhoudt, and J. Huskens, Pure Appl. Chem. 81 (12), 2225–2233 (2009).
- C.J. Hastings, in Handbook of Green Chemistry, edited by P. Anastas (Wiley-VCH Verlag GmbH & Co. KGaA, Weinheim, Germany, 2018), Chap. 7, pp. 139–168.
- D.K. Smith, J. Chem. Edu. 82 (3), 393 (2005).
- C.J. Pedersen, J. Am. Chem. Soc. 89 (26), 7017–7036 (1967).
- C.J. Pedersen, J. Am. Chem. Soc. 89 (10), 2495–2496 (1967).
- M. Kato, K. Kon, J. Hirayama, and I. Yagi, New J. Chem. 43, 10087–10092 (2019).
- Q.D. Hu, G.P. Tang, and P.K. Chu, Acc. Chem. Res. 47 (7), 2017–2025 (2014).
- E.S. Espaol and M. Maldonado, Crit. Rev. Anal. Chem. 49 (5), 383–394 (2019).
- E.S. Español and M.M. Villamil, Biomolecules 9, 90 (2019).
- W.L. Mock and N.Y. Shih, J. Org. Chem. 48 (20), 3618–3619 (1983).
- D. Das, A.I. Khaleel, and W.M. Nau, Front. Chem. 7, 1–23 (2019).
- S.M. Bachrach, J. Phys. Chem. A 117 (35), 8484–8491 (2013).
- E.J. Dale, N.A. Vermeulen, M. Juríček, J.C. Barnes, R.M. Young, M.R. Wasielewski, and J.F. Stoddart, Acc. Chem. Res. 49 (2), 262–273 (2016).
- R. Das and P.K. Chattaraj, Chem. Phys. Chem. 15 (18), 4108–4116 (2014).
- T. Ogoshi, T.a. Yamagishi, and Y. Nakamoto, Chem. Rev. 116 (14), 7937–8002 (2016).
- C.W. Chen and H.W. Whitlock, J. Am. Chem. Soc. 100 (15), 4921–4922 (1978).
- J. Leblond and A. Petitjean, Chem. Phys. Chem. 12 (6), 1043–1051 (2011).
- T. Schrader, G. Bitan, and F.G. Klrner, Chem. Commun. 52, 11318–11334 (2016).
- M.A M. G and C.J. L., Molecules 24 (9), 1803 (2019).
- J. Graton, J.Y.L. Questel, B. Legouin, P. Uriac, P. van de Weghe, and D. Jacquemin, Chem. Phys. Lett. 522, 11–16 (2012).
- J. Antony, R. Sure, and S. Grimme, Chem. Commun. 51, 1764–1774 (2015).
- M. Parac, M. Etinski, M. Peric, and S. Grimme, J. Chem. Theory Comput. 1 (6), 1110–1118 (2005).
- S. Chakrabarti and K. Ruud, Phys. Chem. Chem. Phys. 11, 2592–2596 (2009).
- S. Chakrabarti and K. Ruud, J. Phys. Chem. A 113 (19), 5485–5488 (2009).
- M. Takeda, S. Hiroto, H. Yokoi, S. Lee, D. Kim, and H. Shinokubo, J. Am. Chem. Soc. 140, 6336–6342 (2018).
- D.H. Friese, C. Hättig, and K. Ruud, Phys. Chem. Chem. Phys. 14, 1175–1184 (2012).
- H. Li, Y. Zhang, Z. Jia, and X. Wang, J. Phys. Org. Chem. 32 (8), e3963 (2019).
- H. Li, X. Zheng, Z. Jia, and X. Wang, J. Mol. Model 26 (2), 39 (2020).
- J.M. Hermida-Ramón and A.M. Graña, Struct. Chem. (2020). doi:10.1007/s11224-020-01502-2.
- A. Petitjean, R.G. Khoury, N. Kyritsakas, and J.M. Lehn, J. Am. Chem. Soc. 126 (21), 6637–6647 (2004).
- M.M. Alam, M. Chattopadhyaya, S. Chakrabarti, and K. Ruud, J. Phys. Chem. Lett. 3 (8), 961–966 (2012).
- X.X. Peng, H.Y. Lu, T. Han, and C.F. Chen, Org. Lett. 9 (5), 895–898 (2007).
- B. Legouin, P. Uriac, S. Tomasi, L. Toupet, A. Bondon, and P. van de Weghe, Org. Lett. 11 (3), 745–748 (2009).
- M. Harmata and C.L. Barnes, J. Am. Chem. Soc. 112 (14), 5655–5657 (1990).
- S. Grimme, S. Ehrlich, and L. Goerigk, J. Comp. Chem. 32 (7), 1456–1465 (2011).
- M.J. Frisch, G.W. Trucks, H.B. Schlegel, G.E. Scuseria, M.A. Robb, J.R. Cheeseman, G. Scalmani, V. Barone, G.A. Petersson, H. Nakatsuji, X. Li, M. Caricato, A.V. Marenich, J. Bloino, B.G. Janesko, R. Gomperts, B. Mennucci, H.P. Hratchian, J.V. Ortiz, A.F. Izmaylov, J.L. Sonnenberg, D. Williams-Young, F. Ding, F. Lipparini, F. Egidi, J. Goings, B. Peng, A. Petrone, T. Henderson, D. Ranasinghe, V.G. Zakrzewski, J. Gao, N. Rega, G. Zheng, W. Liang, M. Hada, M. Ehara, K. Toyota, R. Fukuda, J. Hasegawa, M. Ishida, T. Nakajima, Y. Honda, O. Kitao, H. Nakai, T. Vreven, K. Throssell, J.A. Montgomery Jr., J.E. Peralta, F. Ogliaro, M.J. Bearpark, J.J. Heyd, E.N. Brothers, K.N. Kudin, V.N. Staroverov, T.A. Keith, R. Kobayashi, J. Normand, K. Raghavachari, A.P. Rendell, J.C. Burant, S.S. Iyengar, J. Tomasi, M. Cossi, J.M. Millam, M. Klene, C. Adamo, R. Cammi, J.W. Ochterski, R.L. Martin, K. Morokuma, O. Farkas, J.B. Foresman, and D.J. Fox, Gaussian16 Revision C (Gaussian Inc, Wallingford, CT, 2016).
- J. Olsen and P. Jørgensen, J. Chem. Phys. 82 (7), 3235–3264 (1985).
- LSDalton: a linear scaling molecular electronic structure program 2018, Release v2018.0 (2018), see <http://daltonprogram.org>.
- K. Aidas, C. Angeli, K.L. Bak, V. Bakken, R. Bast, L. Boman, O. Christiansen, R. Cimiraglia, S. Coriani, P. Dahle, E.K. Dalskov, U. Ekström, T. Enevoldsen, J.J. Eriksen, P. Ettenhuber, B. Fernández, L. Ferrighi, H. Fliegl, L. Frediani, K. Hald, A. Halkier, C. Hättig, H. Heiberg, T. Helgaker, A.C. Hennum, H. Hettema, E. Hjertenæs, S. Høst, I.M. Høyvik, M.F. Iozzi, B. Jansík, H.J.A. Jensen, D. Jonsson, P. Jørgensen, J. Kauczor, S. Kirpekar, T. Kjærgaard, W. Klopper, S. Knecht, R. Kobayashi, H. Koch, J. Kongsted, A. Krapp, K. Kristensen, A. Ligabue, O.B. Lutnæs, J.I. Melo, K.V. Mikkelsen, R.H. Myhre, C. Neiss, C.B. Nielsen, P. Norman, J. Olsen, J.M.H. Olsen, A. Osted, M.J. Packer, F. Pawlowski, T.B. Pedersen, P.F. Provasi, S. Reine, Z. Rinkevicius, T.A. Ruden, K. Ruud, V.V. Rybkin, P. Sałek, C.C.M. Samson, A.S. de Mers, T. Saue, S.P.A. Sauer, B. Schimmelpfennig, K. Sneskov, A.H. Steindal, K.O. Sylvester-Hvid, P.R. Taylor, A.M. Teale, E.I. Tellgren, D.P. Tew, A.J. Thorvaldsen, L. Thøgersen, O. Vahtras, M.A. Watson, D.J.D. Wilson, M. Ziolkowski, and H. Ågren, WIREs Computational Molecular Science 4 (3), 269–284 (2014).
- M.J.G. Peach, P. Benfield, T. Helgaker, and D.J. Tozer, J. Chem. Phys. 128, 044118 (2008).
- M.J.G. Peach, C.R. Le Sueur, K. Ruud, M. Guillaume, and D.J. Tozer, Phys. Chem. Chem. Phys. 11, 4465–4470 (2009).
- M.T.P. Beerepoot, D.H. Friese, N.H. List, J. Kongsted, and K. Ruud, Phys. Chem. Chem. Phys. 17, 19306–19314 (2015).
- S. Boys and F. Bernardi, Mol. Phys. 19 (4), 553–566 (1970).
- R.C. Hilborn, Am. J. Phys. 50 (11), 982–986 (1982).
- A.J. Thorvaldsen, K. Ruud, K. Kristensen, P. Jørgensen, and S. Coriani, J. Chem. Phys. 129 (21), 214108 (2008).
- D.L. Andrews and T. Thirunamachandran, J. Chem. Phys. 67 (11), 5026–5033 (1977).
- D.H. Friese, M.T.P. Beerepoot, and K. Ruud, J. Chem. Phys. 141 (20), 204103 (2014).
- P. Cronstrand, Y. Luo, and H. Ågren, Chem. Phys. Lett. 352 (3), 262–269 (2002).
- P. Cronstrand, Y. Luo, and H. Ågren, J. Chem. Phys. 117 (24), 11102–11106 (2002).
- M.M. Alam, M. Chattopadhyaya, and S. Chakrabarti, Phys. Chem. Chem. Phys. 14, 1156–1165 (2012).
- M.M. Alam, M. Chattopadhyaya, S. Chakrabarti, and K. Ruud, Acc. Chem. Res. 47 (5), 1604–1612 (2014).
- R. Zaleśny, N.A. Murugan, G. Tian, M. Medved, and H. Ågren, J. Phys. Chem. B 120 (9), 2323–2332 (2016).
- J. Bednarska, R. Zaleśny, N. Arul Murugan, W. Bartkowiak, H. Ågren, and M. Odelius, J. Phys. Chem. B 120 (34), 9067–9075 (2016).
- M.M. Alam, M. Chattopadhyaya, and S. Chakrabarti, J. Phys. Chem. A 116 (30), 8067–8073 (2012).
- M.T.P. Beerepoot, M.M. Alam, J. Bednarska, W. Bartkowiak, K. Ruud, and R. Zaleśny, J. Chem. Theory Comput. 14 (7), 3677–3685 (2018).
- N.A. Murugan, R. Zaleśny, J. Kongsted, A. Nordberg, and H. Ågren, Chem. Commun. 50, 11694–11697 (2014).
- N.H. List, J.M.H. Olsen, H.J.A. Jensen, A.H. Steindal, and J. Kongsted, J. Phys. Chem. Lett. 3 (23), 3513–3521 (2012).
- N.H. List, R. Zaleśny, N.A. Murugan, J. Kongsted, W. Bartkowiak, and H. Ågren, J. Chem. Theory Comput. 11 (9), 4182–4188 (2015).
- M. Wielgus, R. Zaleśny, N.A. Murugan, J. Kongsted, H. Ågren, M. Samoc, and W. Bartkowiak, ChemPhysChem 14 (16), 3731–3739 (2013).
- M. Drobizhev, F. Meng, A. Rebane, Y. Stepanenko, E. Nickel, and C.W. Spangler, J. Phys. Chem. B110 (20), 9802–9814 (2006).
- M.M. Alam, M.T.P. Beerepoot, and K. Ruud, J. Chem. Phys. 146 (24), 244116 (2017).