
 ?Mathematical formulae have been encoded as MathML and are displayed in this HTML version using MathJax in order to improve their display. Uncheck the box to turn MathJax off. This feature requires Javascript. Click on a formula to zoom.
Abstract
Non-covalent interactions are rapidly gaining interest as they are often crucial in determining the properties of materials, and key to supramolecular chemistry and to biochemistry. Non-covalent Polycyclic Aromatic Hydrocarbon (PAH) complexes are in particular relevant to astrochemistry and combustion chemistry where they are involved in the initial steps of condensation and soot formation, respectively. Here, we investigated non-covalent π-π stacking and CH-π interactions in naphthalene and acenaphthene clusters using high-resolution IR-UV spectroscopy in combination with quantum chemical calculations. We identified spectral shifts that occur upon complexation and thereby evaluated predicted potential energy surfaces. Although theory predicts a blueshift, a redshift is observed for the aliphatic CH-π interactions in the experimental spectrum of acenaphthene upon dimerization, indicating that CH-π interaction indeed affects the aliphatic bonds, while a blueshift is predicted, consequently theory deserves attention here. The results provide strong indications for a prevalent parallel naphthalene dimer, showing that π-π stacking interactions become significant for bicyclic and larger PAHs.
GRAPHICAL ABSTRACT

1. Introduction
The interactions governing cluster formation of small PAH molecules are receiving significant interest from both theoreticians and experimentalists [Citation1–7]. The π-π stacking and/or CH-π interactions that may be present in these archetypal complexes can have important contributions to the structure of molecules or molecular complexes of interest in astrochemistry [Citation8–13], biochemistry [Citation14–16] as well as in material sciences [Citation17,Citation18]. Understanding and modelling these interactions is therefore crucial to get a grip on the structure of such molecular complexes, and thereby understand their function in biology and how they determine the characteristics of materials. Moreover, the PAH clusters studied here are of considerable interest to the combustion community [Citation19,Citation20] since they are key players in the initial steps of soot formation, and to the astrochemistry community because they form a link between isolated molecules and carbonaceous grains [Citation8–13].
The geometry of PAH dimers shows two different structural preferences depending on their size. Large PAHs and even graphene favour a parallel geometry [Citation3]. Alternatively, the significant body of experimental and theoretical work on the benzene dimer and its derivatives indicate a T-shaped geometry as the global minimum [Citation21–23] with the parallel-displaced isomer being slightly higher in energy. Grimme [Citation24], and later Martinez and Iverson [Citation14], concluded that π-π stacking interactions are strongly size-dependent and become significant only for parallel complexes containing more than 10–15 carbon atoms, i.e. from naphthalene or anthracene onwards. At a certain PAH size, a turning point from a T-shaped geometry, as observed in the benzene dimer, to a parallel geometry is expected, which is accompanied by a smooth change in character of the noncovalent interactions [Citation25]. Insight into the geometry of naphthalene(-like) dimers would contribute to finding this turning point and validate the existing theory of interactions between aromatic moieties.
A number of studies have been performed on the structure of the naphthalene dimer. In most theoretical studies the (C2 crossed) parallel geometry was found to be more stable than the T-shaped geometry [Citation26–33] (see Figure ). Interestingly, in larger clusters such as the trimer [Citation34] or the crystal structure of smaller PAHs [Citation8,Citation25] a non-parallel structure, clearly differing from the parallel geometry of PAH dimers, is found. Experimental studies using electronic spectroscopy or IR matrix isolation spectroscopy have so far not provided a conclusive picture. Fluorescence spectroscopy suggests a parallel geometry as it is favoured by the singlet excimers [Citation35]. The excimer formation appears to be a barrierless process, from which it has been concluded that the change in geometry from the ground to the excited state is minimal. Further support for a parallel geometry is provided by the Resonance Enhanced MultiPhoton Ionisation (REMPI) excitation spectrum of the non-parallel trimer -for which excimer formation is less expected- which is much sharper than that of the dimer [Citation36]. In contrast, Gilliéron et al. concluded using REMPI spectroscopy that the naphthalene dimer-argonn complex contained a T-shaped configuration [Citation37]. A similar geometry was deduced from matrix isolation IR spectroscopy [Citation38]. However, in a later theoretical evaluation by Bauschlicher and Ricca it was shown that argon stabilises the T-shaped geometry relative to the parallel geometries [Citation39]. A definitive conclusion on the geometry of the pure naphthalene dimer can therefore still not be drawn.
Figure 1. (a–e) Five lowest energy-minimized structures of the acenaphthene dimer and (f–h) three lowest energy-minimized structures of the naphthalene dimer. The corresponding interaction energies are given below the structures.
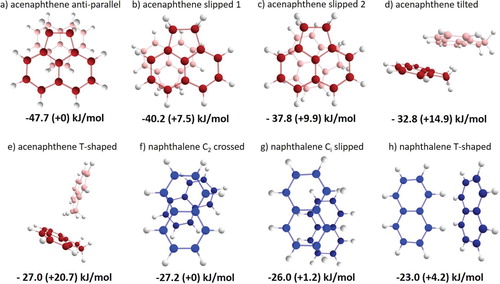
In the same theoretical study, the authors suggested that IR vibrational spectroscopy in the CH out-of-plane and CH stretch regions could be a useful diagnostic tool to come to a conclusive determination of the ground-state structure of the naphthalene dimer. In this work, we therefore present IR absorption spectra of mass-selected naphthalene clusters obtained by ion-dip spectroscopy and discuss the implications of these spectra for the geometry of the naphthalene dimer. Besides the naphthalene dimer, IR ion-dip spectra of acenaphthene monomer and dimer in the 3 µm region are presented. In contrast to the naphthalene dimer, the structural preference of the acenaphthene dimer appears to be more straightforward due to the influence of the aliphatic groups as is supported by the theoretical calculations (see Figure ). It can, therefore, serve as a reference system in this study. At the same time, it should be remarked that experimentally it has not been possible to come to a definite conclusion. Nevertheless, it is noteworthy that in microwave spectroscopy studies by Steber et al. the dimer was not observed, which suggests that this dimer preferably adopts a parallel structure [Citation40]. An additional interesting aspect of this dimer is that it not only displays π-π interactions but also CH-π interactions, which are evaluated here as well.
2. Methods
2.1. Experimental
Experiments on acenaphthene and naphthalene were performed on samples that were heated to 80 °C in a glass sample compartment located just upstream of a Series 9 pulsed valve from General Valve. The valve was operated at 20 Hz using a backing pressure of 2.5 bar of argon. The mixed gas was expanded into a vacuum chamber, after which it passed through a skimmer. The molecular beam was excited by an IR beam in the 3 μm region, provided by a Nd:YAG laser pumped OPO laser (Laser Vision) with a bandwidth of about 0.1 cm−1 and operating at 10 Hz. Mid-IR experiments were performed using radiation provided by the Free Electron Laser FELIX operating at 10 Hz [Citation41]. After a delay of 200 ns the molecular beam was probed via REMPI with a counterpropagating UV laser beam produced by a Nd:YAG laser pumped dye laser (LiopTec) running at 20 Hz to acquire alternating IR-on and IR-off shots. The UV photon energy was set to 31,175 cm−1 for acenaphthene and 32,299 cm−1 for the naphthalene dimer corresponding to the maximised infrared ion gain signal and the transition, respectively. The ionised molecules were detected in a reflectron time-of-flight mass spectrometer (R. M. Jordan Co.). The idler frequency of the OPO laser was calibrated continuously during measurements using a High Finesse WS-7 wavelength meter.
2.2. Theoretical
DFT calculations were performed with the Gaussian16 suite of programs [Citation42] using a superfine grid and very tight optimisation criteria. The energy minima of the naphthalene and acenaphthene dimer structures depicted in Figure were calculated at the B3LYP-D3/Jun-cc-pVDZ level of theory, interaction energies being calculated by subtracting two times the ZPE-corrected monomer energy from the ZPE-corrected energy of the dimer. A small survey using the lowest-energy, antiparallel structure was carried out to validate predicted spectra with the experimental spectra of the acenaphthene dimer employing the B3LYP-D3BJ, B97-D3BJ, APFD, wB97XD, M062X-D3, LC-wPBE-D3BJ functional in combination with the Jun-cc-pVDZ basis set. The B3LYP functional was used with and without dispersion (and damping) corrections to evaluate the effects of these corrections. To check the effect of a larger or slightly different basis set, the B3LYP-D3 functional was also tested with the 6-311++G** basis set. Since the survey did not produce qualitatively different results (see Supplementary Figures 1 and 2), the calculations used for analysis of both the acenaphthene and naphthalene spectra were performed at the B3LYP/Jun-cc-pVDZ level of theory. To account for the dispersion interactions, the D3 empirical dispersion correction was applied [Citation3]. Frequency calculations have been performed in the harmonic approximation as well as anharmonically using GVPT2 [Citation43]. For a better comparison with the experiment, predicted spectra have been convoluted with a 1 cm−1 FWHM Gaussian unless stated otherwise.
3. Results and discussion
In the following, we will first evaluate the experimental and theoretical IR spectra of acenaphthene as the structure of the dimer is more straightforward and its non-observation with microwave spectroscopy would suggest a parallel geometry. Spectral characteristics in the aromatic CH stretch region that reflect the geometry of the complex can subsequently be used in the second part of the results section where the infrared spectrum of the naphthalene dimer is discussed.
3.1 Acenaphthene
The acenaphthene monomer contains four out-of-plane hydrogens and two aromatic rings. Intuitively, one expects complexes that enable both CH-π and π-π stacking interactions to show the largest stabilisation energies. This is indeed reflected by the DFT energy-minimised structures in Figure (a–e). In structures a–c, both of these interactions can be present, whereas in the higher-energy structures, d and e, only CH-π interactions are present. Microwave spectroscopic studies, which provide an accurate structure of the monomer, have as yet not been able to observe signals from the acenaphthene dimer, which would be in line with the computational prediction that the non-polar anti-parallel structure is the lowest-energy structure. In this anti-parallel configuration, the out-of-plane hydrogen atoms are oriented towards the aromatic rings of the opposite but equivalent monomer unit (see Figure (a)). Additionally, in a broadband microwave spectroscopic study, the parallel conformation was also found for the fluorene dimer, a PAH of comparable size as acenaphthene and naphthalene [Citation7]. Compared to the naphthalene dimer structures, the acenaphthene dimer shows a significantly higher interaction energy for acenaphthene (47.7 kJ/mol) compared to a maximum of 27.2 kJ/mol for naphthalene (Figure (f)). We ascribe the higher binding energy of the acenaphthene dimer to the presence of CH-π interactions that are lacking in the parallel structure of the naphthalene dimer. The T-shaped naphthalene dimer could potentially have CH-π interactions, but in such geometries, the π-π stacking interactions would be absent and they would thus be at much higher energies.
The experimental 3 µm IR spectra of the acenaphthene monomer and dimer are shown in Figure together with the calculated IR spectra of the anti-parallel geometry. The trimer spectrum is presented in Supplementary Figure 3 and calculated IR spectra of slipped and T-shaped dimers are displayed in Supplementary Figure 4.
Figure 2. High-resolution experimental IR spectra of the acenaphthene monomer and dimer (black) in the 3 µm region in combination with calculated IR spectra (red) at the B3LYP-D3/Jun-cc-pVDZ level using a scaling factor for the harmonic frequencies of 0.96.
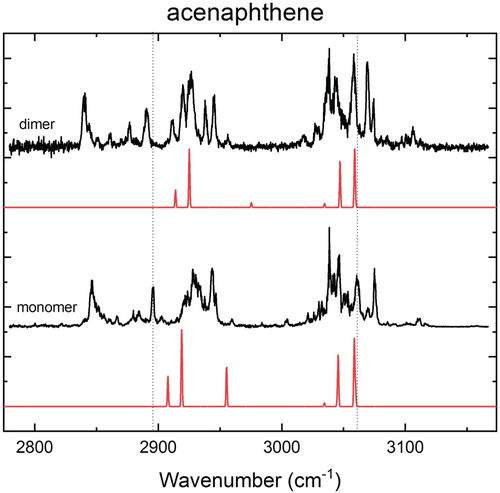
At first sight, the experimental spectra of the monomer, dimer and trimer are quite similar. The effect of complexation is very subtle and manifests itself mostly in the aliphatic region (2800–3000 cm−1) as a redshift of typically 5–6 cm−1 going from the monomer to the dimer. Compared to the dimer, the trimer peak positions do not change significantly (see Supplementary Figure 3). The aromatic region (3000–3150 cm−1) also shows a redshift, although the difference here is smaller (about 2 cm−1) than in the aliphatic region. A more detailed analysis is provided in Supplementary Figures 5 and 6. Considering the lowest-energy structure of the dimer in Figure (a), the larger redshift in the aliphatic region compared to shift in the aromatic region is in line with a priori expectations since the aliphatic region is more susceptible to CH-π interactions. The observed redshift thus shows that such interactions are non-negligible and important for assessing the driving forces of complex formation. A similar conclusion is drawn from the observation that the strong band at 2944 cm−1 of the monomer is split in the dimer and trimer spectrum, which is consistent with an induced non-equivalence of the aliphatic CH groups upon complex formation.
The harmonic theory does not include combination bands and resonances and, as a result, it does not predict the appropriate number of bands in the monomer or dimer spectrum [Citation44]. Although anharmonic theory includes these effects, the prediction is not sufficiently accurate to come to a definitive assignment. In addition, the experimental, small change is not predicted at the anharmonic level (see Supplementary Figure 3). A poorly predicted intermolecular potential can be the cause of the incorrectly calculated additional bands and resonances. For this reason, the harmonic calculations, which do show a small change upon complexation, are used in the structural analysis.
The harmonic calculated IR spectra of the monomer and anti-parallel dimer are qualitatively very similar. An analogous analysis for the anharmonic calculations is reported in Supplementary Figure 3. In the aromatic region, a very small blueshift is predicted, whereas the experiment shows a redshift of about 2 cm−1. In the aliphatic region, the calculations predict a significant blueshift upon complexation with the most intense band being shifted by 6 cm−1 upon complexation. This blueshift is predicted in almost all the calculations that we performed in a survey with a broad range of functionals (see theoretical section and Supplementary Figure 1), the M062X-D3 functional being the only one that shows a small redshift. Such a blueshift is at odds with the experimentally observed redshift, but might be related to the so-called improper hydrogen bonds [Citation45,Citation46] that are not properly described at the employed levels of theory. Although not of direct importance for the present study, the predicted blueshift nevertheless requires further attention from theoretical studies, not only because of the present observations but also because similar observations were made in studies by Erlekam et al. on the benzene dimer [Citation22]. In the aromatic region, the intermolecular interactions in the (displaced) parallel configuration cause a small decrease in the bond strength of the aromatic CHs resulting in the observed redshift of about 2 cm−1.
3.2 Naphthalene
Since the different configurations of the naphthalene dimer are close in energy, its geometry is still under heavy debate. IR spectroscopy can contribute to the elucidation of its structure [Citation39] since both the CH stretch and CH out-of-plane modes are expected to be affected differently in the possible configurations of the naphthalene dimer. Figure shows the experimental infrared spectrum in the 3 µm region of the naphthalene dimer presented with the IR spectrum of the naphthalene monomer recorded by Maltseva et al. [Citation47]. The experimental spectrum of the monomer and dimer are again qualitatively very similar but with a redshift of about 3 cm−1 upon dimerisation (see Supplementary Figure 7), similar to what was observed in the aromatic region of acenaphthene. The two main bands in the dimer spectrum at 3061 and 3077 cm−1 most likely correspond to the two strong bands in the monomer spectrum at 3065 and 3079 cm−1, their shape appearing to be slightly changed with a shoulder on the red and blue side, respectively. Figure also displays calculated IR spectra in the 3 µm region for the monomer, the T-shaped dimer, the C2 crossed parallel dimer and the Ci slipped parallel dimer at the B3LYP-D3/Jun-cc-pVDZlevel of theory (see Figure (f–h) for geometries and relative energies). The IR spectrum of the monomer calculated at the harmonic level of theory matches qualitatively with the experimental spectrum, i.e. two strong bands are predicted to be separated by approximately the experimentally observed energy. Even though anharmonic calculations are necessary to make a full prediction of the spectrum (see Supplementary Figure 8), we will use these harmonic spectra in the further discussion as a main guide to interpret the effects of complexation in order to avoid unnecessary complications of such a discussion.
Figure 3. High-resolution IR spectra of the naphthalene monomer (obtained by Maltseva et al. [Citation47]) and dimer (black) in combination with predicted spectra of the configurations presented in Figure (T-shaped (purple), C2 crossed parallel (dark blue) and Ci slipped parallel (light blue)) at the B3LYP-D3/Jun-cc-pVDZ level of theory using the harmonic approximation and a frequency scaling factor of 0.96.
![Figure 3. High-resolution IR spectra of the naphthalene monomer (obtained by Maltseva et al. [Citation47]) and dimer (black) in combination with predicted spectra of the configurations presented in Figure 1 (T-shaped (purple), C2 crossed parallel (dark blue) and Ci slipped parallel (light blue)) at the B3LYP-D3/Jun-cc-pVDZ level of theory using the harmonic approximation and a frequency scaling factor of 0.96.](/cms/asset/3583d2ab-4ded-401e-b3d0-63a667f8f89e/tmph_a_1811908_f0003_oc.jpg)
The calculated harmonic IR spectra of the dimer can be divided into two groups. The two parallel geometries, C2 crossed and Ci slipped, contain equivalent monomer units and lead to infrared spectra that are similar to the monomer spectrum with the main peaks being split as a result of the dimer formation. In contrast, the T-shaped geometry exhibits two non-equivalent monomer units of which one is significantly affected by dimer formation. This results in the activation of previously IR-inactive modes and leads to an IR spectrum that is quite different from the spectra of the parallel geometries and that shows a larger number of bands. The similarity between the experimentally observed IR spectra of the monomer and dimer thus strongly suggests that the dimer adopts a parallel structure and not a T-shaped geometry. Further support for this conclusion is found in the shoulders on the main bands in the experimental spectrum, which can be explained by the splitting of the two main peaks as predicted by theory for the parallel geometries.
The main features in the harmonic calculations of the naphthalene monomer coincide with the features that are predicted in the aromatic region of the acenaphthene monomer. This is not surprising since the aromatic parts of the two molecules are similar. From our studies on acenaphthene we concluded that the dimer predominantly adopts a parallel conformation, and we concluded above for naphthalene that the 3 µm region also suggests a parallel dimer. One might, therefore, expect both molecules to show similar spectral shifts upon dimerisation. Since such shifts are small, the effect of dimerisation is better visualised in difference spectra constructed by subtracting the IR spectrum of the dimer from that of the monomer, which are depicted in Figure . Figure (a) shows that for both molecules overall a similar redshift is observed in the main features, which manifests itself in the difference spectrum as a negative going to positive signal from low to high wavenumbers. The features observed for acenaphthene between 3020 and 3040 cm−1, which are not present in the difference spectrum of naphthalene, result from the coupling between aliphatic and aromatic groups [Citation44,Citation48]. Our calculations indicate that the two main bands pointed out by an asterisk in both the spectrum of acenaphthene (3060 and 3072 cm−1 at highest slope) and naphthalene (3063 and 3078 cm−1 at highest slope) are associated with normal modes that are very similar in the two molecules. Our experiments show that both modes undergo a similar shift upon complex formation. This is in line with what would be expected if both molecules would have a similar (parallel) geometric arrangement of the monomer units.
Figure 4. (a) Difference spectra (monomer-dimer) of acenaphthene and naphthalene in the aromatic CH stretch region and (b) of naphthalene in the aromatic CH out-of-plane region. In the monomer-dimer difference plot, a redshift manifests itself as a negative going to positive signal from low to high wavenumbers. The CH stretch and the CH out-of-plane region show a redshift of 2–3 and 4 cm−1, respectively, as a result of complex formation.
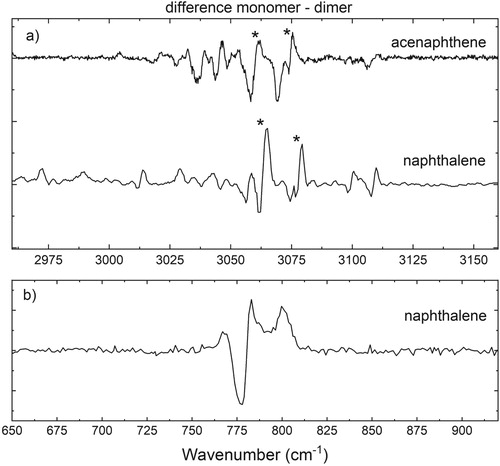
Stronger support for the conclusion that the naphthalene dimer adopts a parallel geometry comes from the difference spectrum in the mid-IR region (Figure (b)) where an overall redshift is observed upon complexation. The major advantage of this region is that it is much less affected by Fermi-resonances, since the density of vibrational states is lower and resonances are thus less likely to occur. Therefore, the harmonic calculations here are more reliable than in the 3 µm region [Citation49]. Theoretical studies of Bauschlicher and coworkers have shown that a parallel configuration of the monomer units would lead to a redshift [Citation39]. Our calculations (Supplementary Figure 2) also predict a redshift of 5 cm−1 for a parallel orientation, which compares well with the experimentally observed redshift of 4 cm−1. For the T-shaped orientation, in contrast, a nonsignificant blueshift is predicted. We recall that for the aliphatic region of the acenaphthene dimer only the M062X-D3 functional correctly predicted the experimentally observed redshift. In order to ensure that the signs and magnitudes of the shifts calculated here at the B3LYP level for the mid-IR region are not dependent on the level of theory, we have performed similar calculations with the M062X-D3 functional. These calculations qualitatively give the same results as the B3LYP-D3 calculations (see Supplementary Figure 2) and do not lead to different conclusions.
4. Conclusions
We have presented high-resolution mass-selected IR ion-dip spectra of monomers and clusters of acenaphthene and naphthalene. In combination with quantum chemical calculations, these studies have allowed us to elucidate and evaluate the effects of cluster formation on the infrared signatures and vibrational modes of these molecules. In the case of acenaphthene we have found that the aliphatic CH-π interactions result in a redshift and possible splitting of the corresponding vibrational bands upon dimerisation. Such a redshift in general indicates a weaker bond, and we can thus conclude that the CH-π interaction affects the aliphatic bonds as expected. Interestingly, DFT calculations predict a blueshift, and this is certainly an aspect that deserves further theoretical attention. In the aromatic region of both naphthalene and acenaphthene dimers a similar, small redshift is observed.
Together with the diagnostic features for a particular geometry that the studies on acenaphthene provided, the experimental and theoretical results obtained for the naphthalene dimer provide strong indications that this dimer predominantly adopts a parallel configuration. Firstly, the naphthalene dimer high-resolution IR spectrum shows a large resemblance with the parallel acenaphthene dimer IR spectrum in the aromatic CH stretch region. Secondly, the CH out-of-plane band is redshifted, which is a strong diagnostic feature of a parallel configuration. Our experiments thus support the theoretical prediction of a prevalent parallel configuration of the naphthalene dimer in which π-π stacking interactions are enabled. This is in line with the general idea that π-π stacking interactions become significant for stacked monomers with more than 10–15 carbon atoms.
TMPH-2020-0394-File002.doc
Download MS Word (458 KB)Acknowledgements
This work was supported by The Netherlands Organization for Scientific Research (NWO) and is part of the Dutch Astrochemistry Network (DAN) II (Project No. 648.000.029). The authors thank the FELIX laboratory team for their experimental assistance and scientific support and also acknowledge the Nederlandse Organisatie voor Wetenschappelijk Onderzoek (NWO) for the support of the FELIX Laboratory and SURFsara for their computational resources. This work was also supported by the ERC Starting grant ‘ASTROROT’, grant number 638027, and the Deutsche Forschungsgemeinschaft (SCHN1280/4-2, grant number 271359857) in the context of the priority program SPP 1807 ‘Control of London dispersion interactions in molecular chemistry’.
Disclosure statement
No potential conflict of interest was reported by the author(s).
Additional information
Funding
References
- P.M. Felker, P.M. Maxton, and M.W. Schaeffer, Chem. Rev. 94, 1787 (1994). doi:10.1021/cr00031a003.
- S. Speiser, Chem. Rev. 96, 1953 (1996). doi:10.1021/cr941193+. doi: 10.1021/cr941193+
- S. Grimme, J. Antony, S. Ehrlich, and H. Krieg, J. Chem. Phys. 132, 154104 (2010). doi:10.1063/1.3382344.
- J. Moellmann and S. Grimme, J. Phys. Chem. C. 118, 7615 (2014). doi:10.1021/jp501237c.
- S. Grimme, C. Mück-Lichtenfeld, and J. Antony, J. Phys. Chem. C. 111, 11199 (2007). doi:10.1021/jp0720791.
- A. Potapov, Mol. Astrophys. 6, 16 (2017). doi:10.1016/j.molap.2017.01.001.
- M. Fatima, A.L. Steber, A. Poblotzki, C. Pérez, S. Zinn, and M. Schnell, Angew. Chemie - Int. Ed. 58, 3108 (2019). doi:10.1002/anie.201812556.
- M. Rapacioli, F. Calvo, F. Spiegelman, C. Joblin, and D.J. Wales, J. Phys. Chem. A. 109, 2487 (2005). doi:10.1021/jp046745z.
- F. Salama, Proc. Int. Astron. Union. 4, 357 (2008). doi:10.1017/S1743921308021960.
- C. Jäger, F. Huisken, H. Mutschke, I.L. Jansa, and T. Henning, Astrophys. J. 696, 706 (2009). doi:10.1088/0004-637X/696/1/706.
- A.G.G.M. Tielens, Annu. Rev. Astron. Astrophys. 46, 289 (2008). doi:10.1146/annurev.astro.46.060407.145211.
- A.K. Lemmens, D.B. Rap, J.M.M. Thunnissen, B. Willemsen, and A.M. Rijs, Nat. Commun. 11, 1 (2020). doi:10.1038/s41467-019-14092-3.
- A.K. Lemmens, S. Gruet, A.L. Steber, J. Antony, S. Grimme, M. Schnell, and A.M. Rijs, Phys. Chem. Chem. Phys (2018).
- C.R. Martinez and B.L. Iverson, Chem. Sci. 3, 2191 (2012). doi:10.1039/c2sc20045g.
- K. Schwing and M. Gerhards, Int. Rev. Phys. Chem. 35, 569 (2016). doi:10.1080/0144235X.2016.1229331.
- S. Bakels, E.M. Meijer, M. Greuell, S.B.A. Porskamp, G. Rouwhorst, J. Mahé, M.P. Gaigeot, and A.M. Rijs, Faraday Discuss. 217, 322 (2019). doi:10.1039/C8FD00208H.
- X. Feng, M. Liu, W. Pisula, M. Takase, J. Li, and K. Müllen, Adv. Mater. 20, 2684 (2008). doi:10.1002/adma.200800642.
- R. Fitzner, C. Elschner, M. Weil, C. Uhrich, C. Körner, M. Riede, K. Leo, M. Pfeiffer, E. Reinold, E. Mena-Osteritz, and P. Bäuerle, Adv. Mater. 24, 675 (2012). doi:10.1002/adma.201104439.
- K.O. Johansson, M.P. Head-Gordon, P.E. Schrader, K.R. Wilson, and H.A. Michelsen, Science. 361, 997 (2018). doi:10.1126/science.aat3417.
- M. Thomson and T. Mitra, Science. 361, 978 (2018). doi:10.1126/science.aau5941.
- R.H. Page, Y.R. Shen and Y.T. Lee, J. Chem. Phys. 88, 4621 (1988). doi:10.1063/1.453775.
- U. Erlekam, M. Frankowski, G. Meijer, and G. von Helden, J. Chem. Phys 124 (2006). doi:10.1063/1.2198828.
- M. Schnell, U. Erlekam, P.R. Bunker, G. von Helden, J.-U. Grabow, G. Meijer, and A. van der Avoird, Angew. Chemie - Int. Ed 52, 5180 (2013). doi:10.1002/anie.201300653.
- S. Grimme, Angew. Chemie - Int. Ed. 47, 3430 (2008). doi:10.1002/anie.200705157.
- S.M. Ryno, C. Risko, and J.L. Brédas, Chem. Mater. 28, 3990 (2016). doi:10.1021/acs.chemmater.6b01340.
- C. Gonzalez and E.C. Lim, J. Phys. Chem. A. 104, 2953 (2000). doi:10.1021/jp993642l.
- S. Tsuzuki, K. Honda, T. Uchimaru, and M. Mikami, J. Chem. Phys. 120, 647 (2004). doi:10.1063/1.1630953.
- T.R. Walsh, Chem. Phys. Lett. 363, 45 (2002). doi:10.1016/S0009-2614(02)01147-8.
- N.K. Lee, S. Park and S.K. Kim, J. Chem. Phys. 116, 7910 (2002). doi:10.1063/1.1468642.
- M. Saeki, H. Akagi, and M. Fujii, J. Chem. Theory Comput. 2, 1176 (2006). doi:10.1021/ct050278n.
- C. Gonzalez and E.C. Lim, J. Phys. Chem. A. 107, 10105 (2003). doi:10.1021/jp030587e.
- T. Sato, T. Tsuneda, and K. Hirao, J. Chem. Phys 123 (2005). doi:10.1063/1.2011396.
- R. Podeszwa and K. Szalewicz, Phys. Chem. Chem. Phys. 10, 2581 (2008). doi:10.1039/b719725j.
- P. Benharash, M.J. Gleason, and P.M. Felker, J. Phys. Chem. A. 103, 1442 (1999). doi:10.1021/jp984636c.
- H. Saigusa and E.C. Lim, Acc. Chem. Res. 29, 171 (1996). doi:10.1021/ar950169v.
- T. Fujiwara and E.C. Lim, J. Phys. Chem. A 107 (22), 4381–4386 (2003). doi:10.1021/jp022605i.
- C. Gilliéron, N. Sharma, K. Nauta, and T.W. Schmidt, J. Phys. Chem. A. 111, 4211 (2007). doi:10.1021/jp0687504.
- J.E. Roser and L.J. Allamandola, Astrophys. J. 722, 1932 (2010). doi:10.1088/0004-637X/722/2/1932.
- C.W. Bauschlicher and A. Ricca, Theor. Chem. Acc. 132, 1 (2013). doi:10.1007/s00214-013-1395-z.
- A.L. Steber, C. Pérez, B. Temelso, G.C. Shields, A.M. Rijs, B.H. Pate, Z. Kisiel, and M. Schnell, J. Phys. Chem. Lett. 8, 5744 (2017). doi:10.1021/acs.jpclett.7b02695.
- D. Oepts, A.F.G. Van, D. Meer and P.W. Van Amersfoort, Infrared Phys. Technol. 36, 297 (1995). doi:10.1016/1350-4495(94)00074-U.
- M.J. Frisch, G.W. Trucks, H.B. Schlegel, G.E. Scuseria, M.A. Robb, J.R. Cheeseman, G. Scalmani, V. Barone, G.A. Petersson, H. Nakatsuji, X. Li, M. Caricato, A.V. Marenich, J Bloino, B.G. Janesko, R. Gomperts, B. Mennucci, H.P. Hratchian, J.V. Ortiz, A.F. Izmaylov, J.L. Sonnenberg, D. Williams-Young, F. Ding, F. Lipparini, F. Egidi, J. Goings, B. Peng, A. Petrone, T. Henderson, D. Ranasinghe, V.G. Zakrzewski, J. Gao, N. Rega, G. Zheng, W. Liang, M. Hada, M. Ehara, K. Toyota, R. Fukuda, J. Hasegawa, M. Ishida, T. Nakajima, Y. Honda, O. Kitao, H. Nakai, T. Vreven, K. Throssell, J.A., Jr. Montgomery, J.E. Peralta, F. Ogliaro, M.J. Bearpark, J.J. Heyd, E.N. Brothers, K.N. Kudin, V.N. Staroverov, T.A. Ketih, R. Kobayashi, J. Normand, K. Raghavachari, A.P. Rendell, J.C. Burant, S.S. Iyengar, J. Tomasi, M. Cossi, J.M. Millam, M. Klene, C. Adamo, R. Cammi, J.W. Ochterski, R.L. Martin, K. Morokuma, O. Farkas, J.B. Foresman, and D.J. Fox, 2016, Gaussian 16, Rev. A.03, Gaussian, Inc., Wallingford CT.
- J. Bloino, J. Phys. Chem. A. 119, 5269 (2015). doi:10.1021/jp509985u.
- E. Maltseva, C.J. Mackie, A. Candian, A. Petrignani, X. Huang, T.J. Lee, A.G.G.M. Tielens, J. Oomens, and W.J. Buma, Astron. Astrophys. 610, A65 (2018). doi:10.1051/0004-6361/201732102.
- J. Joseph and E.D. Jemmis, J. Am. Chem. Soc. 129, 4620 (2007). doi:10.1021/ja067545z.
- P. Hobza and Z. Havlas, Theor. Chem. Acc 108, 325–334 (2002). doi:10.1007/s00214-002-0367-5.
- E. Maltseva, A. Petrignani, A. Candian, C.J. Mackie, X. Huang, T.J. Lee, A.G.G.M. Tielens, J. Oomens, and W.J. Buma, Astrophys. J 814 (23), 1 (2016). doi:10.1088/0004-637X/814/1/23.
- P.R. Franke, D.P. Tabor, C.P. Moradi, G.E. Douberly, J. Agarwal, H.F. Schaefer, and E.L. Sibert, J. Chem. Phys. 145, 224304 (2016). doi:10.1063/1.4971239.
- A.K. Lemmens, D.B. Rap, J.M.M. Thunnissen, C.J. Mackie, A. Candian, A.G.G.M. Tielens, A.M. Rijs, and W.J. Buma, Astron. Astrophys. 628, A130 (2019). doi:10.1051/0004-6361/201935631.