
 ?Mathematical formulae have been encoded as MathML and are displayed in this HTML version using MathJax in order to improve their display. Uncheck the box to turn MathJax off. This feature requires Javascript. Click on a formula to zoom.
ABSTRACT
Methyl cinnamate (MC) is an ester within the cinnamate family. Recent time-resolved gas-phase studies have suggested that upon excitation to its first singlet ππ* (11ππ*) state, there is initial decay to the lowest lying singlet 1nπ* (11nπ*) state within 10 ps, en route to trans–cis isomerisation. In the present study, we have implemented time-resolved ion yield (TR-IY) and time-resolved photoelectron spectroscopy (TR-PES) experiments in the gas-phase to precisely determine the lifetime of the 11ππ* state. We found this lifetime to be ∼ 4.5 ps using both TR-IY and TR-PES. MC was also studied in a more complex cyclohexane solution environment, using transient electronic absorption spectroscopy. Along with complementary steady-state irradiation and 1H NMR studies, these studies demonstrate that trans–cis isomerisation is preserved in the more complex, cyclohexane solution environment.
GRAPHICAL ABSTRACT
Introduction
The portion of solar ultraviolet (UV) radiation that reaches the Earth surface as UV-A (315–400 nm) and UV-B (280–315 nm) can be both beneficial and harmful to living organisms [Citation1,Citation2]. For instance, while it contributes to vitamin D synthesis and prevention of disease such as osteoporosis [Citation3,Citation4] overexposure to UV radiation is linked to several eye and skin disorders; for example cataracts, melanoma, and non-melanoma skin cancers as well as skin aging [Citation5,Citation6]. The UK alone recorded 17,852 cases of melanoma skin cancer in 2018 [Citation7], as a consequence of exposure to UV-A and UV-B [Citation8,Citation9].
In order to combat the harmful effects of UV radiation, chemical UV-filters are included within commercial sunscreen formulations [Citation10–13], providing a front-line defence to excessive UV exposure. UV-filters are molecules that protect epidermal cells by absorbing UV-A and UV-B radiation before it can reach, and cause damage to, their DNA. An ideal UV-filter used in such formulations should therefore exhibit photodynamic processes which, upon UV absorption, lead to effective dissipation of the excess energy. This energy dissipation should be in the form of harmless heat and without the production of detrimental reactive photoproducts [Citation14]. However, a number of the most well-known UV-filters used widely in commercial sunscreen formulations, such as oxybenzone and avobenzone, have been found to degrade following prolonged exposure to UV radiation [Citation15,Citation16]. Oxybenzone, among other UV-filters, is additionally known to disrupt the endocrine system [Citation17,Citation18]. Moreover, several studies have reported photoallergic reactions as a result of using sunscreen formulations containing chemical UV-filters [Citation19–23]. Consequently, there is an ever-increasing demand for next generation sunscreen formulations which utilise more efficient and, importantly, safer UV-filters. This underscores the necessity to better understand the photochemistry and photophysics that govern current and prospective UV-filters.
Amongst the main synthetic and organic UV-filters currently used in commercially available products is the molecular family of cinnamates [Citation19,Citation24]. The photodynamics of cinnamate derivatives have been extensively studied in the gas- and solution-phase by numerous spectroscopic techniques [Citation25–29]. These studies revealed a trend for cinnamate molecules to have a photoisomerisation coordinate allowing for efficient, picosecond (ps, 1 ps = 10−12 s) dissipation of their excess energy.
Peperstraete et al. studied methyl-trans-4-methoxycinnamate (trans-MMC), a model UV chromophore of commercial sunscreens, in both gas- and solution-phase, by implementing time-resolved ion yield (TR-IY) and transient electronic absorption spectroscopy (TEAS) [Citation29]. These authors reported an efficient trans–cis isomerisation relaxation mechanism upon excitation to the first excited singlet 1ππ* (11ππ*) state in solution with sub-ps lifetime (depending on the solvent). However, the suggested gas-phase dynamics were significantly different involving a non-radiative decay route, from the 11ππ* state to 11nπ* state, mediated via internal conversion (IC) and succeeded by de-excitation from 11nπ* to the ground electronic state (S0).
Further studies, both computational and experimental, have examined the molecular photodynamics upon altering the position of various substituents on cinnamates [Citation30,Citation31]. Promkatkaew et al. [Citation30] used UV-Vis absorption and fluorescence emission measurements alongside theoretical calculations, to show how the preferable relaxation mechanisms were linked to the electronegativity of the substituent (i.e. electron-withdrawing or electron-donating group) and its position (i.e. ortho-, para- or meta- position).
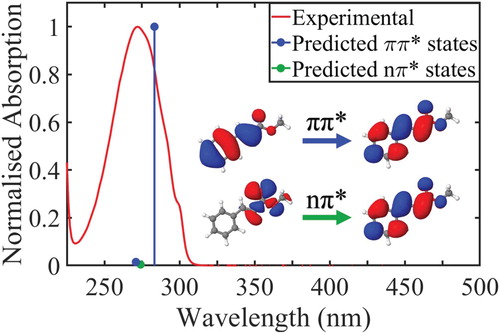
Methyl cinnamate (MC) is the simplest-structured cinnamate ester. Due to its low complexity, MC is a very good model for a systematic approach study involving experiments in both the gas- and solution-phase. Thus, MC’s photodynamics can be investigated in depth resulting in a more complete understanding of overall cinnamate photodynamics. Figure depicts the normalised UV-Vis spectrum of trans-MC in cyclohexane along with the calculated vertical excitation energies of the 11ππ* and 11nπ* states, see ‘Computational Methods’ section for further details. In 1988, Lewis et al. studied MC’s dynamics upon UV excitation in solution [Citation32]. The authors measured a fluorescence decay time of <3 ps with an estimated fluorescence quantum yield of 0.001. They proposed that this fast fluorescence decay time upon excitation to MC’s 11ππ* state, was a result of the population of two competing fluorescent states: (1) originally the 11ππ* singlet state and (2) the 11nπ* singlet state that is populated via a rapid IC. In this study, the trans–cis isomerisation efficiency was also determined and the isomerisation was suggested to occur via either a ππ* or nπ* singlet state.
Figure 1. Experimentally observed (red) and theoretically predicted (blue, green) spectrum of trans-MC in cyclohexane. Both the highest observed experimental absorption and highest predicted oscillator strength were normalised to 1. Blue lines denote two excitations with ππ* character and the green line denotes a darker excitation with nπ* character. The orbitals that are primarily involved in the lowest energy ππ* and nπ* transitions are displayed inset.
Ebata et al. performed gas-phase studies on jet-cooled MC using laser-induced fluorescence and hole-burning spectroscopy to identify electronic transitions for two conformers of MC [Citation33]. Kinoshita et al. extended this approach by combining resonance two-photon ionisation and theoretical calculations to investigate the electronic states and the non-radiative decay route of MC and the MC-MeOH complex [Citation34]. In this study, it was suggested that the trans–cis isomerisation of MC upon UV radiation is mediated by a triplet state (13ππ*), via the pathway: 11ππ* → 11nπ* → 13ππ* → S0(trans or cis); similar to other para-substituted cinnamates [Citation35,Citation36]. Additionally, using ps pump–probe spectroscopy, the authors determined the 11ππ* → 11nπ* decay time constant to be less than 10 ps. The authors note that the 12 ps time resolution of their experiment limited the accuracy to which they could quote the lifetime of the 11ππ* state.
In the present work, we seek to obtain a more accurate measure of this 11ππ* state lifetime, by using femtosecond (1 fs = 10−15 s) TR-IY and time-resolved photoelectron spectroscopy (TR-PES). We also extend this study from vacuum to the more complex environment of cyclohexane, to examine how this may impact the dynamics. Delineating the initial (i.e. on the order of fs to ps) stages of MC dynamics upon UV absorption will provide a deeper insight into the photoprotective properties of cinnamates determined by the excited state lifetime. These properties are crucial in gleaning information regarding the mechanisms that establish UV-absorber molecules as powerful photoprotectants.
Materials and methods
Ultrafast laser spectroscopy set up
A fundamental laser beam centred at 800 nm with ∼ 40 fs laser pulses of ∼ 3 mJ per pulse, was produced by a commercial femtosecond (fs) Ti:Sapphire oscillator and regenerative amplifier (Spectra-Physics Spitfire XP) system. The 1 kHz, 800 nm beam was subsequently split into three equal parts of ∼ 1 mJ per pulse, which were then used to generate the pump and probe pulses; details are provided below.
Gas-phase techniques
Trans-MC (Sigma-Aldrich, 99%) was vaporised via heating to 50 °C and subsequently seeded into helium buffer gas (∼ 3 bar). The gaseous mixture was then expanded into vacuum (∼ 10−7 mbar) via an Even-Lavie pulsed solenoid valve [Citation37] to form the sample molecular beam. The pump and probe beams intersected the molecular beam, while the pump–probe time delay (at predefined time intervals Δt) was controlled by a hollow corner gold retroreflector mounted on a motorised delay stage along the 800 nm fundamental beam path used to generate the pump beam. The maximum temporal window provided by the delay stage was 1.3 ns; however, the longest Δt reported here is 75 ps (given the absence of notable changes beyond this time). At the laser-molecular beam intersection point, the pump photoexcited the sample and the probe ionised the excited species. Τhe pump beam was generated by one of the ∼ 1 mJ per pulse fundamental 800 nm beams (see above) through optical parametric amplification (Light Conversion, TOPAS-C); the wavelength selected for the pump in the gas-phase experiments (λpump = 294 nm) was chosen in order to excite around the origin band of the 11ππ* [Citation34]. The probe beam used to photoionise any excited species was centred at 200 nm and generated by successive frequency conversion of the second ∼ 1 mJ per pulse fundamental 800 nm beams using barium borate (BBO) crystals in the following sequence: type I, type II, type I.
Time-resolved ion yield (TR-IY)
The time-resolved ion yield (TR-IY) apparatus used for the present experiments has been previously described in detail [Citation38]; only details relevant to the present work are reported herein. The pump–probe ion signal was monitored with a time-of-flight (TOF) mass spectrometer apparatus, equipped with a detector which consists of two microchannel plates (MCPs) and coupled to a metal anode. The output from the MCP was measured by a digital oscilloscope (LeCroy LT372 Waverunner) and gated in ion flight time over the mass channel of the parent (MC+) ion. The parent TOF signal was then monitored as a function of Δt, resulting in the TR-IY transients. Additionally, power dependence studies were conducted to ensure single-photon initiated dynamics under the current experimental conditions [Citation39].
Velocity map ion imaging (VMI)
The pump–probe photoelectron signal was detected by a velocity map ion imaging (VMI) apparatus, which follows the design proposed by Eppink and Parker [Citation40]. The photoelectrons emitted upon probing were focused via ion-optics onto a temporally gated detector, consisting of two MCPs and coupled to a phosphor screen (Photek VID-240). The images produced were recorded as a function of Δt and analysed by a polar onion peeling algorithm [Citation41]. As a result, the time-resolved VMI (TR-VMI) or photoelectron spectroscopy (TR-PES) transients along with the total kinetic energy released (TKER) spectra were generated. Importantly, to reduce the background ion signal caused by the 200 nm probe, this beam was loosely focused.
For consistency, all gas-phase experiments, TR-IY, TR-PES and TR-VMI were performed under the same experimental conditions (i.e. same laser powers, focussing conditions, parallel pump and probe electric fields etc.).
Gas-phase kinetic fit
The quoted time-constants were extracted from the TR-IY and TR-PES transients by a non-linear curve fitting algorithm consisting of a sum of exponential decay functions convoluted with the IRF. To present a more accurate description of this model, it is essential to introduce the variable t as the time difference of the pump–probe time delay (Δt) and the time zero (t0). As such, the fitting function can be described by the following equation:
(1)
(1) where
, Δt is the experimental time delay, t0 the time zero, g(t) a Gaussian function, Ai the amplitude of the i-decay, τi the lifetime of the i-decay and H(t) a step function.
We use of the step function in the fitting formula in order to define time zero as the starting point of all observed dynamics (i.e. parallel dynamics).
The standard errors provided by the kinetic fits have been reported here as estimated errors.
Solution-phase techniques
Transient electronic absorption spectroscopy (TEAS)
The UV-Vis transient electronic absorption spectroscopy (TEAS) setup has been described elsewhere [Citation42] and thus only details pertaining to the current experiments are provided below. A solution of trans-MC dissolved in cyclohexane (Fisher Scientific, > 99.9%) was prepared to a concentration of ∼ 5 mM. In order to avert any photodegradation of the sample over time, we used a diaphragm pump (Simdos K2) to recirculate the solutions via a flow through sample cell (Harrick Scientific) between two CaF2 windows (thickness 1–2, 25 mm diameter). PTFE spacers maintained a sample path length of 500 µm. The wavelength of the pump pulses was chosen to be at 280 nm, which corresponds to approximately the peak maximum in trans-MC’s UV-Vis spectrum in cyclohexane as well as the calculated vertical excitation energy of the 11ππ* state; see Figure . The probe pulses were broadband white light pulses (320–720 nm), generated by focusing a 5% portion of the third ∼ 1 mJ per pulse fundamental 800 nm beam onto a CaF2 crystal (2 mm thick). The pump–probe time delays in our TEAS setup were controlled by a gold retroreflector (in the 800 nm beam path prior to white light generation) mounted on a motorised delay stage. The maximum Δt was ∼ 1.9 ns. The fluence of the probe pulse was changed post-sample by a neutral density filter as required to avoid saturating the spectrometer (Avantes, AvaSpec-ULS1650F).
The TEAS data collected with this setup was quantitatively analysed via global analysis fitting using Glotaran, a graphical user interface for the R package TIMP [Citation43], which convolutes exponential decay functions with the Gaussian IRF to extract the fitted time-constants. Moreover, the algorithm used by Glotaran software includes a third-order polynomial to account for chirp effects (i.e. Δt = 0 is different for each probe wavelength) caused by group velocity artefacts [Citation44].
In line with the kinetic fit used in the analysis of the gas-phase experiments, the kinetic fit applied here assumes parallel dynamics. Moreover, similar to our experiments in vacuum, TEAS power dependence studies were carried out to ensure single-photon initiated dynamics for our experiments in solution (see section S2.4 at the SM).
Steady-state spectroscopy
UV-Visible spectroscopy measurements were performed on an Agilent Cary60 spectrophotometer with sample concentrations of 10 μM using a quartz cuvette of 10 mm path length. Steady-state irradiation measurements were also taken with the same sample concentration (10 μM) using a Horiba FluroLog-3 at the TEAS excitation wavelength (280 nm) and bandwidth of 5 nm. 1H NMR studies were conducted using a Bruker Avance III HD 500 MHz NMR spectrometer on samples of trans-MC in deuterated cyclohexane with a concentration of 0.5 mM. Spectra were recorded pre- and post- 30 mins of constant irradiation (at 280 nm) in a 1 mm pathlength cuvette using the Horiba FluroLog-3. A concentration of 0.5 mM was chosen for the 1H NMR studies to improve the signal-to-noise ratio and provide the same absorption spectrum as a 50 μM solution in a 10 mm pathlength cuvette.
Computational Methods
All calculations were conducted with the NWChem software package [Citation45]. The structure for trans-MC was optimised in density functional theory (DFT) at the PBE/ aug-pVTZ level [Citation46,Citation47] of theory in both vacuum and implicit cyclohexane solvent. For this, we utilised the inbuilt COSMO solvent model present in NWChem [Citation48–50]. Time-dependent DFT calculations were conducted upon this structure at the PBE0/ aug-pVTZ level of theory to calculate vertical excitation energies for both singlet and triplet excited states and are presented in section S3 of SM. This level of theory has been used successfully in the literature in previous studies on other organic chromophores [Citation51–53].
Results and discussion
Gas-phase
Figure (top) presents ΤR-ΙΥ and TR-PES transients of trans-MC respectively along with the extracted time-constants. For this, the pump beam was centred at 294 nm to excite trans-MC to the 11ππ* state, as had previously determined by the work of Kinoshita et.al. [Citation34], and the probe beam was 200 nm. Both transients were fitted with two exponential decay functions at positive time delays (Δt > 0, forward dynamics) τ1 and τ2. We note, there are probe initiated (Δt < 0) reverse dynamics but these are out of the scope of the present work and are thus not discussed below. The TKER spectra at selected Δt and associated VMI (at Δt = 0) are also shown in Figure (bottom). In what follows, the time-constant assignments for TR-PES and TR-IY transients are discussed together.
Figure 2. top: TR-IY and TR-PES transients for trans-MC photoexcited at 294 nm (around the 11ππ* origin), and probed with 200 nm. The polarisations of the pump and probe beams were parallel with respect to each other in both TR-IY and TR-PES experiments so that the results were comparable. bottom: TKER spectra obtained following photoexcitation of trans-MC at 294 nm and at a pump–probe delay of Δt = −5, 0 and 10 ps. Inset: PES-VMI at Δt = 0. Black arrow shows the value for TKERmax.
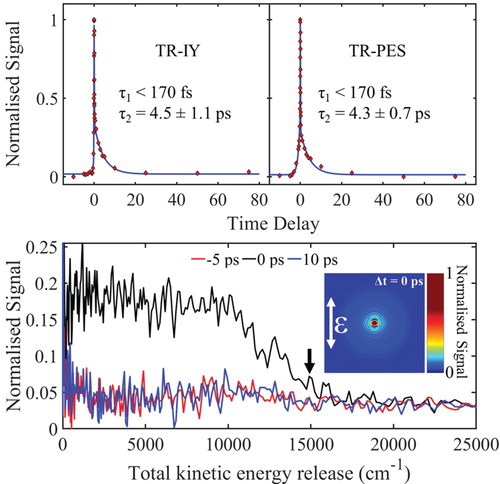
We start our discussion by addressing the first time-constant, τ1, which is defined in both cases within the time limits of our instrument response function ∼ 170 fs (see section S1.1 of SM) and corresponds to a time zero artefact. This is confirmed through pump-power dependence studies which revealed in a nonlinear relationship between photon density and signal (data not shown) [Citation54]. Τhe assignment of the second time-constant, τ2, is discussed with reference to the study of Kinoshita et al. [Citation34]. As mentioned supra, Kinoshita et al. proposed that the non-radiative relaxation mechanisms of trans-MC upon photoexcitation to 11ππ* follows the scheme: 11ππ* → 11nπ* → 13ππ* → S0(trans- or cis-) and estimated the 11ππ* → 11nπ* decay time-constant via IC to be <10 ps. In line with this work, the second time-constant (τ2) of 4.5 ± 1.1 ps and 4.3 ± 0.7 ps as revealed by our TR-IY and TR-PES measurements respectively [shown in Figure (top)], is assigned to the 11ππ* → 11nπ* non-radiative decay via IC. The long lifetime of the 11nπ* (up to 8.5 ns) combined with the very weak ionisation cross-sections of this state, obtained by Kinoshita et al. [Citation34], could potentially prevent its experimental observation; especially under the current experimental conditions (i.e. low probe power). Consequently, the fact that the ion signal in both TR-IY and TR-PES returns to baseline after ∼ 10 ps and thus only the 11ππ* → 11nπ* decay is observed is unsurprising. Indeed, TR-IY transients performed at higher probe powers verified this assumption: a clear baseline offset at Δt > 0 was recorded, resulting in an additional time-constant which extends out of our experimental time window (see more details at section S1.2 of the SM).
The 200 nm probe provided the system with enough energy to ionise the excited state population from the 11ππ* state. Kinoshita et al. [Citation34] have determined the ionisation potential to be 69090 cm−1. From this, we can estimate the maximum TKER (TKERmax) we would anticipate following ionisation from this state, using energy conservation:
(2)
(2)
Given the reported IP value, Equation (2) returns a TKERmax at 14950 cm−1 (see black arrow, Figure (bottom)) in excellent accord with our TKER spectrum recorded at Δt = 0 shown in Figure (bottom). From our measurements, we are unable to interpret any vibronic features from our TKER spectra, only noting that these spectra uniformly drop in intensity as the system evolves from the 11ππ* to the 11nπ* state.
In summary, we accurately measured the 11ππ* lifetime of MC upon photoexcitation at 294 nm in vacuum by employing TR-IY and TR-PES experiments. Both techniques yielded very similar time-constant of ∼ 4.5 ps, attributed to IC of trans-MC following 11ππ* → 11nπ* in agreement with previous literature [Citation34].
Solution-phase
To gain a more complete understanding of MC photodynamics, we increased the complexity with the addition of a solvent bath. Through this, we expanded our study to observe and interpret the effect that the non-polar and weakly perturbing environment of cyclohexane might have on MC’s relaxation pathways upon excitation to the 11ππ* state with λpump = 280 nm. As mentioned supra, in order to estimate MC’s excited state energies in cyclohexane, theoretical calculations were undertaken using time-dependent DFT. The vertical excitations with both singlet and triplet multiplicity along with their state characters are presented in Figure and in section S3 of the SM; which are in good agreement with previous literature [Citation32,Citation34,Citation35].
We start this discussion by firstly evaluating the steady-state UV-Vis and pre- and post-irradiation 1H NMR studies conducted for MC in cyclohexane and deuterated cyclohexane respectively, as presented in Figure (top) and (bottom) respectively. The steady-state measurements (excitation wavelength: 280 nm), discussed in detail in section S2.5 of the SM, have revealed a clear drop in absorption of the trans-isomer, followed by emergence of a new feature absorbing approximately at the region between 300–350 nm. The equilibrium between these features was found to be established at approximately 30 min of constant irradiation (see Figure S7 (b) in the SM). Thus, only the initial (no irradiation) and the UV-Vis spectrum recorded after 30 mins irradiation time are shown here [Figure (top)]. The UV-Vis spectrum recorded after equilibrium was established, exhibits a broad absorbance towards the longer wavelengths and a small red-shift with respect to the initial UV-Vis spectrum of trans-MC. Both, broadening of the spectral lines and red-shift in the peak absorption, have been previously reported for the cis-isomer absorbance in similar systems [Citation55,Citation56]. This proposed red-shifting was also explored theoretically. Computational calculations conducted on both trans- and cis- forms of MC support the assumption of the cis-isomer formation by predicting a red-shift of 0.02 eV (∼2 nm) for the max cis-MC absorbance with respect to that of trans-MC (see at section S3 in the SM). Whilst this is close to the shift observed experimentally, TDDFT is not sufficiently accurate to differentiate such small energy differences. Furthermore, it is not the shifting maximum peak intensity that leads to the visibility of the cis-form, more the change in peak broadness. To properly reproduce this one would need to accurately represent both homogeneous and inhomogeneous broadening effects theoretically, which is beyond the scope of this work.
Figure 3. top: Steady-state UV-Vis absorption spectra corresponding to the non-irradiated (red curve) and after 30 min of constant irradiation (blue curve) of trans-MC at 280 nm. bottom: 1H NMR spectra of trans-MC in deuterated cyclohexane before (blue curve) and after 30 min (red curve) of irradiation at 280 nm.
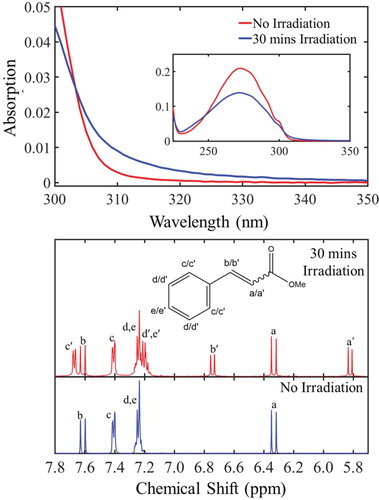
By comparing the 1H NMR spectra between non-irradiated and irradiated samples of MC in deuterated cyclohexane, the emergence of new resonances associated with the cis-isomer became clear. As shown in Figure (bottom), a pair of doublets arises at 5.82 and 6.75 ppm. The chemical shifts of these resonances, along with the corresponding coupling constant (J = 13 Hz), agree with literature values for cis-vicinal protons in an alkene [Citation57]. Furthermore, the ratio of the cis- compared to the trans-isomer was approximately 2:3, as shown by the integration of each of the peaks [Citation58], revealing, once again, that the equilibrium between trans- and cis-isomers had already been established at 30 min irradiation time. This is clear evidence that trans-cis isomerisation is an active relaxation mechanism of MC upon UV absorption. Therefore, we conclude that the UV-Vis spectrum of MC, recorded after 30 mins of constant irradiation [Figure (top)], contains cis-MC, in agreement with previous reports in similar molecules [Citation28–30].
Bearing the above observations in mind, we now move to discuss our ultrafast TEAS measurements of trans-MC in cyclohexane and attempt to assess whether isomerisation is an active pathway on an ultrafast timescale (as compared to steady-state irradiation). Figure (top) depicts transient absorption spectra (TAS) of MC in the form of a false colour map, following excitation to 11ππ* state with λpump = 280 nm. Trans-MC displays two strong excited state absorption (ESA) features at early time delays (Δt ∼ 1–5 ps); centred at 330 and 390 nm respectively and one more feature at ∼ 330 nm that is still present at 15 ps. To reveal the time-constants corresponding to all dynamical processes in operation, the TAS were fitted using a global model, as discussed in detail in the section ‘Materials and Methods’. The extracted time-constants, τ1-3, are presented in Figure (bottom), along with their decay-associated spectra (abbreviated as DAS: DAS1, DAS2 and DAS3). Positive amplitudes in DAS correspond to decay in the TAS signal and negative to growth.
Figure 4. top: False colour map showing TAS of trans-MC in cyclohexane with λpump = 280 nm bottom: (a) Decay associated spectra (DAS) extracted from global fit. The DAS amplitude corresponding to τ3 (DAS3) is multiplied by 5 to achieve a better illustration. (b) TAS at selected pump-probe time delays. These plots correspond to vertical slices through the false colour heat map at the selected time delays.
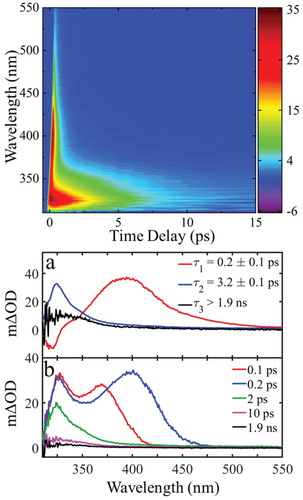
We start our TEAS results discussion with the third time-constant, τ3, which corresponds to the long-lived ESA feature centred at ∼ 330 nm on the false colour map [Figure (top)]. This feature appears within 3 ps, as indicated by the DAS shown in Figure (bottom (a)) and has a lifetime longer than our experimental time window (∼ 1.9 ns). By combining these results with our steady-state studies, we note that trans-MC exhibits no absorbance above 330 nm, as shown in Figure (top). Therefore, the TAS peak, corresponding to the maximum available pump–probe time delay (∼ 1.9 ns), that is centered at ∼ 330 nm cannot be explicitly attributed to the trans-isomer. On the other hand, cis-MC is very likely to contribute to some degree to this TAS, since its overall weak absorbance remains non-zero until approximately 350 nm. This is plausible evidence of cis-MC observed within the TEAS experimental time window, which further indicates an ultrafast trans–cis isomerisation mechanism taking place for MC in cyclohexane. This is, however, not fully conclusive as there could be another effect that gives rise to a feature in the same region as where the cis- form is expected to absorb. In contrast, MC’s gas-phase photodynamics have revealed trans–cis isomerisation mechanism via a triplet state with ∼ 20 ns lifetime [Citation34–36]. However, previous studies on similar structure molecules had reported faster (at a ps to sub-ps timescale) trans-11ππ* → cis-S0 transition via a nearby CI in solution [Citation29,Citation59,Citation60] which lends further support to our observation.
We conclude our τ3 narrative by noting one final interesting outcome. The TAS peak at the maximum pump–probe time delay (1.9 ns), as well as DAS3, appears to exhibit a ‘tail’ in the absorption beyond towards the high wavelengths; this is not visible in the irradiated steady-state UV-Vis. This ‘tail’ is a common characteristic of triplet-state absorption [Citation61], already reported for similar molecules [Citation60]. Moreover, Wang et al. observed phosphorescence emission of MC in ethanol and through this revealed triplet energy levels of this molecule [Citation62]. Therefore, the formation of a triplet state cannot be excluded. As discussed earlier in this work, the triplet state was found to play a significant role by mediating photoisomerisation in well-established MC dynamics in the gas-phase [Citation34,Citation35]. As also discussed in our gas-phase narrative, it is possible for an 1nπ* state to be accessed, this could also give rise to the observed ‘tail’ feature. Our theoretical calculations further support these hypotheses by elucidating the existence of nearby potentially accessible triplet states as well as an 1nπ* state (see section S3 at SM).
Given this, we finally assign τ3 as follows: the lifetime of cis-MC, potentially convoluted with both a triplet state and the long-lived trans-11nπ* dark state. In fact, trans-MC undergoes numerous processes convoluted together and described by the lifetimes τ1, τ2 and τ3 and thus a distinct assignment of any process with a lifetime is difficult.
Taking the above observations into account, we now move to interpret trans-MC’s short time behaviour in cyclohexane upon excitation to the 11ππ* state as described by τ1 and τ2. We discuss the first time-constant, τ1 = 0.2 ± 0.1 ps by comparing the TAS time slices at 0.1 and 0.2 ps. It is evident that the first peak appears to narrow slightly, indicating the evolution of the initial excited state population towards a 11ππ* minimum [Citation63,Citation64]. Moreover, as the excited state population evolves towards the 11ππ* minimum, the transitions to higher lying states will change and this manifest as changes in the TAS, as expressed with the second TAS peak (i.e. the peak appeared at ∼ 360 nm at Δt = 0.1 ps) which moves towards longer wavelengths. Thus, τ1 is herein attributed to the lifetime of the vibrationally hot 11ππ* state.
Moving our discussion to the assignment of τ2 (3.2 ± 0.1 ps), we first note that, as shown in Figure bottom (b), the TAS peak at ∼ 330 nm becomes narrower and blue shifted over time. This is likely due to further vibrational cooling and solvent rearrangement along the 11ππ* state within the timescale of τ2 [Citation59,Citation65]. Also observed is a rapid drop in intensity of this peak. This indicates the 11ππ* state is being depleted, likely through both evolution to the 11nπ* state via IC, similarly to what was observed in the gas-phase, and through evolution directly to the S0 (these processes are shown in Figure ).
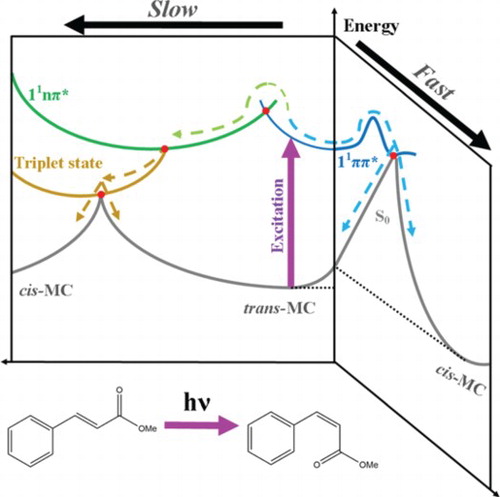
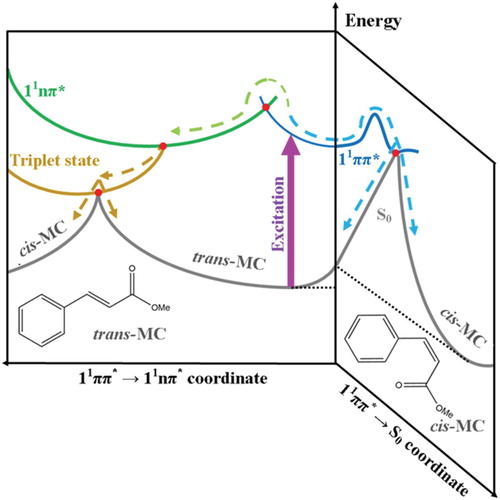
Figure 5. Qualitive illustration of the potential energy surfaces showing the proposed non-radiative relaxation mechanisms of trans-MC with respect to two trans-cis isomerisation reaction coordinates. This figure is adapted from ref. 29.
There is compelling evidence both processes are occurring concurrently. Firstly, there is evidence, as stated above, that cis-MC is being produced as early by as 3 ps. As discussed by Kinoshita et al., the process of generating cis-MC via the 11ππ* → 11nπ* → 13ππ* → S0(trans or cis) route occurs on the scale of ∼ 20 ns. Therefore, the fact the cis-MC is being formed within the first 3 ps implies that the trans-11ππ* → cis-S0 route must also be being utilised. Secondly, τ2 is very similar to the time-constant corresponding to the 11ππ* → 11nπ* transition that we observed in gas-phase (cf. ∼ 4 ps in vacuum versus ∼ 3 ps in cyclohexane), this implies that a similar process is happening in both cases, albeit with the lifetime being shorter in the solution phase owing to the competitive trans-11ππ* → cis-S0 route. The timescale of these processes is in agreement with previous studies in related molecular systems [Citation29,Citation59,Citation60].
Taking everything into account, we propose that the relaxation mechanism in trans-MC likely follows two competing decay routes, as illustrated in Figure . Upon excitation of trans-MC to its 11ππ* state (blue curve), trans-MC is likely to undergo (1) photoisomerisation via the trans-11ππ* → cis-S0 transition and (2) a concurrent ultrafast IC to the long-lived 11nπ* state (green curve) via the appropriate 11ππ*/11nπ* CI (red dot). These mechanisms are similar to trans-MMC [Citation29]. However, for MC, it is additionally plausible that while some excited state population remains trapped into its 11nπ* state, a parallel population of a nearby triplet state (gold curve) takes place via intersystem crossing. From this triplet state the molecule either finally returns to the trans-isomer ground state, or trans–cis isomerisation occurs, and MC alternatively relaxes to the cis-isomer ground state. We note that photoisomerisation via the trans-11ππ* → cis-S0 transition (i.e. the route illustrated at the right hand side of Figure ) is achieved in a sub ns timescale and therefore is likely what gives rise to observation of the cis-isomer in our TEAS time-window.
Conclusions
In the work presented here we investigated the excited state dynamics of trans-MC in the gas-phase and in cyclohexane upon excitation at 11ππ*. We established the decay time-constants for the relaxation of MC from the first singlet ππ* (11ππ*) state to the first singlet nπ* (11nπ*) state, as well as the effect of adding a non-polar and weakly perturbing solvent (cyclohexane) on the relaxation dynamics. Furthermore, our steady-state irradiation studies coupled with 1H NMR evaluated the photostability of MC and provided evidence of the trans–cis photoisomerisation following UV irradiation. It was found that under irradiation time longer than 30 min, MC undergoes further dissociation. This observation combined with the formation of a triplet state raises some concerns regarding the photoprotective properties of MC. Overall, our systematic study has shown that the relaxation mechanism of the UV-filter MC upon UV absorption is preserved as you move from vacuum to the non-polar solvent cyclohexane. That being said, there is evidence to suggest that there is a competing relaxation pathway for trans-MC in cyclohexane that involves MC’s direct photoisomerisation via the trans-11ππ* → cis-S0 transition.
Supplemental Material
Download Zip (4.8 MB)Acknowledgements
The authors would like to thank the Warwick Centre for Ultrafast Spectroscopy (WCUS) for the use of the Cary 60 and Fluorolog-3. Computing facilities were provided by the Scientific Computing Research Technology Platform of the University of Warwick. We acknowledge the use of Athena at HPC Midlands+, which was funded by the Engineering and Physical Sciences Research Council (EPSRC) by Grant EP/P020232/1, in this research, as part of the HPC Midlands+ consortium. K.M.K. thanks the EPSRC for doctoral funding. M.A.P.T. thanks the EPSRC for a PhD studentship through the EPSRC Centre for Doctoral Training in Molecular Analytical Science, grant number EP/L015307/1. Finally, V.G.S. thanks the HO2020 FET-OPEN Grant BoostCrop for financial support.
Disclosure statement
No potential conflict of interest was reported by the author(s).
Additional information
Funding
References
- J. D’Orazio, S. Jarrett, A. Amaro-Ortiz, and T. Scott, Int. J. Mol. Sci. 14, 12222 (2013). doi: 10.3390/ijms140612222
- M. Brenner and V.J. Hearing, Photochem. Photobiol. 84, 539 (2008). doi: 10.1111/j.1751-1097.2007.00226.x
- C. Trummer, M. Pandis, N. Verheyen, M. Grübler, M. Gaksch, B. Obermayer-Pietsch, A. Tomaschitz, T. Pieber, S. Pilz and V. Schwetz, Int. J. Environ. Res. Public Health. 13, 1028 (2016). doi: 10.3390/ijerph13101028
- M.F. Holick, South. Med. J. 98, 1024 (2005). doi: 10.1097/01.SMJ.0000140865.32054.DB
- J. Mark Elwood and J. Jopson, Int. J. Cancer. 73, 198 (1997). doi: 10.1002/(SICI)1097-0215(19971009)73:2<198::AID-IJC6>3.0.CO;2-R
- N.J. Lowe, Dermatol. Clin. 24, 9 (2006). doi: 10.1016/j.det.2005.08.001
- 2020 MELANOMA SKIN CANCER REPORT | Melanoma UK (n.d.).
- C. Battie, S. Jitsukawa, F. Bernerd, S. Del Bino, C. Marionnet and M. Verschoore, Exp. Dermatol. 23, 7 (2014). doi: 10.1111/exd.12388
- F. Poon, S. Kang and A.L. Chien, Photodermatol. Photoimmunol. Photomed. 31, 65 (2015). doi: 10.1111/phpp.12145
- N.A. Shaath, Photochem. Photobiol. Sci. 9, 464 (2010). doi: 10.1039/b9pp00174c
- N. Serpone, D. Dondi and A. Albini, Inorganica Chim. Acta. 360, 794 (2007). doi: 10.1016/j.ica.2005.12.057
- A. Salvador and A. Chisvert, Anal. Chim. Acta. 537, 1 (2005). doi: 10.1016/j.aca.2005.01.055
- S.C. Rastogi, Contact Dermatitis. 46, 348 (2002). doi: 10.1034/j.1600-0536.2002.460605.x
- N.D.N. Rodrigues, M. Staniforth and V.G. Stavros, Proc. R. Soc. A Math. Phys. Eng. Sci. 472, 20160677 (2016). doi: 10.1098/rspa.2016.0677
- A.D. Dunkelberger, R.D. Kieda, B.M. Marsh and F.F. Crim, J. Phys. Chem. A. 119, 6155 (2015). doi: 10.1021/acs.jpca.5b01641
- H. Gonzalez, N. Tarras-Wahlberg, B. Strömdahl, A. Juzeniene, J. Moan, O. Larkö, A. Rosén and A.M. Wennberg, BMC Dermatol. 7, 1 (2007). doi: 10.1186/1471-5945-7-1
- V. Baker, Toxicol. Vitr. 15, 413 (2001). doi: 10.1016/S0887-2333(01)00045-5
- R.H. Waring and R.M. Harris, Mol. Cell. Endocrinol. 244, 2 (2005). doi: 10.1016/j.mce.2005.02.007
- S.Q. Wang, Y. Balagula and U. Osterwalder, Dermatol. Ther. 23, 31 (2010). doi: 10.1111/j.1529-8019.2009.01289.x
- D. Delplace and A. Blondeel, Contact Dermatitis. 54, 295 (2006). doi: 10.1111/j.0105-1873.2006.0698a.x
- I. Carrotte-Lefebvre, A. Bonnevalle, M. Segard, E. Delaporte and P. Thomas, Contact Dermatitis. 48, 45 (2003). doi: 10.1034/j.1600-0536.2003.480108_2.x
- M. Avenel-Audran, H. Dutartre, A. Goossens, M. Jeanmougin, C. Comte, C. Bernier, L. Benkalfate, M. Michel, M.C. Ferrier-Lebouëdec, M. Vigan, J.L. Bourrain, O. Outtas, J.L. Peyron and L. Martin, Arch. Dermatol. 146, 753 (2010). doi: 10.1001/archdermatol.2010.132
- N. Cook and S. Freeman, Australas. J. Dermatol. 42, 257 (2001). doi: 10.1046/j.1440-0960.2001.00531.x
- A.R. Nunes, ÍGP Vieira, D.B. Queiroz, A.L.A.B. Leal, S. Maia Morais, D.F. Muniz, J.T. Calixto-Junior and H.D.M. Coutinho, Adv. Pharmacol. Sci. 2018, 9 (2018).
- E.M.M. Tan, M. Hilbers and W.J. Buma, J. Phys. Chem. Lett. 5, 2464 (2014). doi: 10.1021/jz501140b
- E.M.M. Tan, S. Amirjalayer, B.H. Bakker and W.J. Buma, Faraday Discuss. 163, 321 (2013). doi: 10.1039/c2fd20139a
- Y. Imamoto, M. Kataoka and F. Tokunaga, Biochemistry. 35, 14047 (1996). doi: 10.1021/bi961342d
- Y. Miyazaki, Y. Inokuchi, N. Akai and T. Ebata, J. Phys. Chem. Lett. 6, 1134 (2015). doi: 10.1021/acs.jpclett.5b00203
- Y. Peperstraete, M. Staniforth, L.A. Baker, N.D.N. Rodrigues, N.C. Cole-Filipiak, W.D. Quan and V.G. Stavros, Phys. Chem. Chem. Phys. 18, 28140 (2016). doi: 10.1039/C6CP05205C
- M. Promkatkaew, S. Suramitr, T. Karpkird, S. Wanichwecharungruang, M. Ehara and S. Hannongbua, Photochem. Photobiol. Sci. 13, 583 (2014). doi: 10.1039/c3pp50319d
- T.M. Karpkird, S. Wanichweacharungruang and B. Albinsson, Photochem. Photobiol. Sci. 8, 1455 (2009). doi: 10.1039/b909695g
- F.D. Lewis, S.L. Quillen, J.E. Elbert, S. Schneider and P. Geiselhart, J. Photochem. Photobiol. A Chem. 47, 173 (1989). doi: 10.1016/1010-6030(89)87063-7
- T. Ebata, K. Saito, H. Ishikawa and N. Mikami, Res. Chem. Intermed. 24, 803 (1998). doi: 10.1163/156856798X00302
- S.N. Kinoshita, Y. Inokuchi, Y. Onitsuka, H. Kohguchi, N. Akai, T. Shiraogawa, M. Ehara, K. Yamazaki, Y. Harabuchi, S. Maeda and T. Ebata, Phys. Chem. Chem. Phys. 21, 19755 (2019). doi: 10.1039/C9CP02914A
- K. Yamazaki, Y. Miyazaki, Y. Harabuchi, T. Taketsugu, S. Maeda, Y. Inokuchi, S.N. Kinoshita, M. Sumida, Y. Onitsuka, H. Kohguchi, M. Ehara and T. Ebata, J. Phys. Chem. Lett. 7, 4001 (2016). doi: 10.1021/acs.jpclett.6b01643
- S.N. Kinoshita, Y. Miyazaki, M. Sumida, Y. Onitsuka, H. Kohguchi, Y. Inokuchi, N. Akai, T. Shiraogawa, M. Ehara, K. Yamazaki, Y. Harabuchi, S. Maeda, T. Taketsugu and T. Ebata, Phys. Chem. Chem. Phys. 20, 17583 (2018). doi: 10.1039/C8CP00414E
- U. Even, J. Jortner, D. Noy, N. Lavie and C. Cossart-Magos, J. Chem. Phys. 112, 8068 (2000). doi: 10.1063/1.481405
- A. Iqbal, L.J. Pegg and V.G. Stavros, J. Phys. Chem. A. 112, 9531 (2008). doi: 10.1021/jp802155b
- S.R. Gandhi and R.B. Bernstein, Chem. Phys. 105, 423 (1986). doi: 10.1016/0301-0104(86)80129-X
- A.T.J.B.J.B. Eppink and D.H. Parker, Rev. Sci. Instrum. 68, 3477 (1997). doi: 10.1063/1.1148310
- G.M. Roberts, J.L. Nixon, J. Lecointre, E. Wrede and J.R.R. Verlet, Rev. Sci. Instrum. 80 (2009). doi: 10.1063/1.3126527
- S.E. Greenough, G.M. Roberts, N.A. Smith, M.D. Horbury, R.G. McKinlay, J.M. Żurek, M.J. Paterson, P.J. Sadler and V.G. Stavros, Phys. Chem. Chem. Phys. 16, 19141 (2014). doi: 10.1039/C4CP02359E
- J. Snellenburg, S. Laptenok, R. Seger, K. Mullen, I. Van Stokkum, J.J. Snellenburg, S.P. Laptenok, K.M. Mullen and I.H.M. Van Stokkum, J. Stat. Softw. 49, 1 (2012). doi: 10.18637/jss.v049.i03
- I. Walmsley, L. Waxer and C. Dorrer, Rev. Sci. Instrum. 72, 1 (2001). doi: 10.1063/1.1330575
- M. Valiev, E.J. Bylaska, N. Govind, K. Kowalski, T.P. Straatsma, H.J.J. Van Dam, D. Wang, J. Nieplocha, E. Apra, T.L. Windus and W.A. de Jong, Comput. Phys. Commun. 181, 1477 (2010). doi: 10.1016/j.cpc.2010.04.018
- J.P. Perdew, K. Burke, and M. Ernzerhof, Phys. Rev. Lett. 77, 3865 (1996). doi: 10.1103/PhysRevLett.77.3865
- E.R. Davidson, Chem. Phys. Lett. 260, 514 (1996). doi: 10.1016/0009-2614(96)00917-7
- A. Klamt and G. Schüürmann, J. Chem. Soc. Perkin Trans. 2 (2), 799 (1993). doi: 10.1039/P29930000799
- D.M. York and M. Karplus, J. Phys. Chem. A. 103, 11060 (1999). doi: 10.1021/jp992097l
- P. Winget, D.M. Dolney, D.J. Giesen, C.J. Cramer, and D.G. Truhlar, … … Of Minnesota (2010).
- M.A.P. Turner, M.D. Horbury, V.G. Stavros and N.D.M. Hine, J. Phys. Chem. A. 123 (2019). doi: 10.1021/acs.jpca.8b11013
- J.M. Woolley, J.S. Peters, M.A.P. Turner, G.J. Clarkson, M.D. Horbury and V.G. Stavros, Phys. Chem. Chem. Phys. 21 (2019). doi: 10.1039/C8CP06536E
- E.L. Holt, K.M. Krokidi, M.A.P. Turner, P. Mishra, T.S. Zwier, N.d.N. Rodrigues and V.G. Stavros, Phys. Chem. Chem. Phys. 22 (27, (2020). doi: 10.1039/D0CP02610G
- C.W. Luo, Y.T. Wang, F.W. Chen, H.C. Shih and T. Kobayashi, Opt. Express. 17, 11321 (2009). doi: 10.1364/OE.17.011321
- X. Zhao, F. Ji, Y. Liang, P. Li, Y. Jia, X. Feng, Y. Sun, Y. Shi, L. Zhu and G. Zhao, J. Lumin. 223, 117228 (2020). doi: 10.1016/j.jlumin.2020.117228
- M.D. Horbury, A.L. Flourat, S.E. Greenough, F. Allais and V.G. Stavros, Chem. Commun. 54, 936 (2018). doi: 10.1039/C7CC09061G
- M.B. Hocking, Can. J. Chem. 47, 4567 (1969). doi: 10.1139/v69-757
- Htbtps//Www.Acdlabs.Com/Products/Adh/Spectrusprocessor/ (Accessed Jul. 21, 2020). (n.d.).
- M.D. Horbury, L.A. Baker, N.D.N. Rodrigues, W.D. Quan and V.G. Stavros, Chem. Phys. Lett. 673, 62 (2017). doi: 10.1016/j.cplett.2017.02.004
- L.A. Baker, M.D. Horbury, S.E. Greenough, F. Allais, P.S. Walsh, S. Habershon and V.G. Stavros, J. Phys. Chem. Lett. 7, 56 (2016). doi: 10.1021/acs.jpclett.5b02474
- M.D. Horbury, L.A. Baker, W.D. Quan, J.D. Young, M. Staniforth, S.E. Greenough and V.G. Stavros, J. Phys. Chem. A. 119, 11989 (2015). doi: 10.1021/acs.jpca.5b03621
- H.B. Wang, B.C. Zhai, W.J. Tang, J.Y. Yu and Q.H. Song, Chem. Phys. 333, 229 (2007). doi: 10.1016/j.chemphys.2007.02.003
- H. Kuramochi, S. Takeuchi and T. Tahara, J. Phys. Chem. Lett. 3, 2025 (2012). doi: 10.1021/jz300542f
- A. Espagne, D.H. Paik, P. Changenet-Barret, M.M. Martin and A.H. Zewail, ChemPhysChem. 7, 1717 (2006). doi: 10.1002/cphc.200600137
- J. Aßmann, M. Kling and B. Abel, Angew. Chemie Int. Ed. 42, 2226 (2003). doi: 10.1002/anie.200200541