
 ?Mathematical formulae have been encoded as MathML and are displayed in this HTML version using MathJax in order to improve their display. Uncheck the box to turn MathJax off. This feature requires Javascript. Click on a formula to zoom.
Abstract
Adsorption-induced deformation of monolithic, hierarchically organised porous carbon materials exhibiting non-convex mesoporosity between hexagonally arranged carbon nanorods was investigated with adsorption dilatometry and small-angle neutron scattering (SANS). n-pentane with zeroscattering length density was used as an adsorbate for SANS. To assess the influence of micropores on deformation, three samples with different degrees of CO2 activation were investigated. The measured strain isotherms show distinct differences as compared to strain isotherms from systems with convex cylindrical mesopores. Strain isotherms deduced from SANS exhibit three different regimes, which are ascribed to a film phase at low-, a bridged phase at intermediate-, and a filled phase at high relative pressures. Evaluating the pore load moduli from SANS and dilatometry, we find an apparent stiffening of the samples on the mesoscale upon activation. We assume that the stiffness of the linkers between the nanorods increases with activation, whereas the elastic modulus of the carbon nanorods is reduced. The results demonstrate that adsorption-induced deformation in these materials with non-convex, interconnected mesopore space strongly depends on structural disorder within and in between the carbon nanorods, and emphasise the importance of strain isotherms as a source of complementary information to classical adsorption analysis.
GRAPHICAL ABSTRACT

1. Introduction
In recent years, the fundamental understanding of adsorption-induced deformation [Citation1] (AID) has seen considerable advancement due to significant progress in the modelling of adsorption. This was mainly a consequence of the development of atomistic approaches using Non-Local Density Functional Theory (NLDFT) [Citation2] and Quenched-Solid Density Functional Theory (QSDFT) [Citation3]. Similarly, the advancement of experimental techniques [Citation4] and the synthesis of ordered, monolithic silica [Citation5,Citation6] and carbon [Citation6] model materials has allowed to investigate AID experimentally with high precision. In addition to the fundamental interest in understanding this complex phenomenon, AID is pivotal for numerous natural and engineering processes, such as drying of building materials [Citation7], swelling of minerals and rocks of interest in gas storage [Citation8] or the swelling of organic tissue [Citation9]. Generally, AID is intimately related to the coverage of pore walls with molecules followed by the filling of the pore space on a mesopore level, or the density and arrangement of adsorbing molecules in the strong confinement present in micropores. Although several theoretical models were able to quantitatively predict film formation and capillary condensation in mesoporous materials below the saturation pressure of the adsorbing vapour since the 1960s [Citation10–12], their assumption of cylindrical pore geometry is often quite different from the true pore geometry [Citation13]. With the advancement of well-structured mesoporous materials, such as MCM-41 [Citation14] or SBA-15 [Citation15], it was possible to study the distribution of adsorbed liquid in cylindrical mesopores [Citation16–18], essentially confirming theoretical predictions. Today, state-of-the-art methods, such as QSDFT [Citation3], NLDFT [Citation2] or Grand Canonical Monte Carlo (GCMC) simulations [Citation19,Citation20], are used to extract pore size distributions from experimental adsorption isotherms. Alternatively, for materials with sufficiently large mesopores, analytical models still describe adsorption accurately enough [Citation21] as density fluctuations in the adsorbed phase exert less influence. Recently a series of dilatometric experiments using nitrogen adsorption in hierarchically porous silica with ordered cylindrical mesopores was performed by Balzer et al. [Citation22,Citation23]. To interpret their data, they have further developed the solvation pressure approach from Neimark et al. [Citation24–26], based on the Derjaguin-Broekhoff-de Boer theory [Citation10,Citation11], allowing to quantitatively describe AID over the full relative pressure range of the adsorption isotherm. Studies of deformation induced by water adsorption using SANS and dilatometry on similar materials by Ludescher et al. [Citation27] have shown that this theoretical approach can be extended to more complex adsorbates as long as no other effects, such as absorption, are dominant. Deformation due to adsorption in micropores, where the overlap of the pore wall potentials makes the situation more complex, has also been described by appropriate molecular models [Citation23,Citation27]. An analytical approximation to access AID in micropores was presented in [Citation23,Citation28], where the adsorption was modelled with a Langmuir isotherm [Citation29]. It was shown that for micro- and mesoporous silica materials, the careful modelling of the micropore contribution is crucial as it contributes dominantly to the overall deformation even up to gas pressures approaching saturation pressure [Citation23,Citation27].
So far, studies of AID were essentially conducted on materials that exhibit either convex pores, such as cylindrical or spherical mesopores, or pores which can be approximated by a (planar) slit-like geometry. To the best of our knowledge, no in-depth experimental investigations of AID are known for systems with non-convex pore geometries, such as the negative replica of SBA-15 silica, known as CMK-3 carbon [Citation30]. In these systems, the hexagonally arranged cylindrical pores of SBA-15 are replaced by the solid carbon material in the form of cylindrical nanorods, creating a complex, interconnected mesopore space which is characterised by concave pore-solid interfaces.
In this work, we present and qualitatively interpret experimental results of deformation induced by n-pentane adsorption on monolithic, hierarchical macro-, meso- and microporous carbons [Citation31] exhibiting a non-convex mesoporosity similar to CMK-3. The deformation is determined by in-situ adsorption small-angle neutron scattering (SANS) and in-situ adsorption dilatometry. The latter method can easily be applied because of the monolithic nature of the hierarchically organised material [Citation22,Citation32]. In addition, the ordered mesostructure allows to determine the mean distance between the carbon nanorods as a function of relative gas pressure with in-situ adsorption SANS [Citation27,Citation33]. While in-situ SANS is exclusively sensitive to AID perpendicular to the nanorod axis, dilatometry measures the macroscopic length change of the sample, therefore being sensitive to both, axial and radial deformation of the mesopore space. The choice of using neutrons instead of X-rays allows masking so-called apparent strains [Citation34,Citation35] by applying an adsorbate with net zero scattering length density.
2. Materials and methods
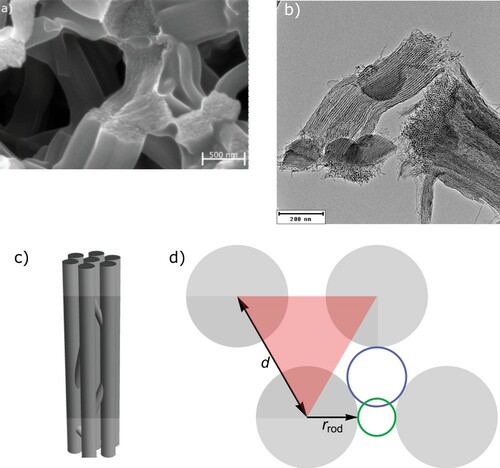
The investigated samples are monolithic carbon samples, containing hierarchically organised micro-, meso- and macropores [Citation36]. A disordered, macroporous network of struts (see Figure (a)) with a length of approximately 1 µm and a diameter of approximately 0.3 µm constitutes the sample monoliths [Citation36], with the mesoporosity being situated inside these struts (Figure (b)). Since the carbon materials are obtained via a negative templating procedure from silica monoliths [Citation31] with hierarchical porosity consisting of 2D- hexagonally ordered cylindrical mesopores, the resulting mesopore structure is a negative replica of the silica sample mesoporosity. Hence, on the mesoscale, the pore space in the carbon materials is a continuous, open void space in between 2-D hexagonally ordered carbon nanorods as sketched in Figure (c,d), similar to the well known CMK-3 materials [Citation30,Citation37]. The details of the synthesis were already described by Koczwara et al. [Citation31] and Putz et al. [Citation38] and are not repeated here in detail. In short, the silica monoliths were infiltrated with a carbon precursor (resorcinol/ formaldehyde), carbonised in argon atmosphere at 850°C, followed by template removal using HF. Three samples were prepared for in-situ adsorption SANS and dilatometry experiments using n-pentane as adsorbate. One sample was the carbon monolith (CN) as received after carbonisation and HF etching, and two other samples were prepared by subjecting the as prepared material to an activation treatment under CO2 flow at 925°C for 30 min (C30) and 120 min (C120), respectively.
Figure 1. (a) SEM image of the macroporous scaffold, constituted by individual struts which exhibit 2D-hexagonally ordered carbon nanowires. (b) TEM image of a strut, where the hexagonally ordered carbon nanorods are visible. In (c) a sketch of 2D-hexagonally ordered carbon nanorods, with interconnections stabilising their regular arrangement is shown. (d) Top-view of a unit-cell of the 2D-hexagonally ordered carbon nanorods, with the lattice constant,
the carbon nanorods radius and the blue and green circles signifying the smallest and largest inscribed radius in the denoted mesopore void space.
To avoid contrast effects leading to so-called apparent strains [Citation34,Citation35] in SANS, the adsorbate was tuned to zero scattering length density (Z-SLD) by mixing regular, high-purity n-pentane with fully deuterated n-pentane in a mass ratio. The measurement set-up for SANS was identical to the one applied in Ludescher et al. [Citation27], where the sample cell was connected to a custom-made vapour dosing system. The sample holder was constructed in such a way that it could host all three samples simultaneously. The sample temperature was kept constant at 290.15 K using a thermostat connected to the sample cell body. The relative pressure of the adsorbate in the sample cell was adjusted incrementally until equilibrium was reached for each chosen pressure step and was kept constant during SANS data collection. Due to the high volatility of n-pentane, only the adsorption branch was measured in the in-situ SANS experiment.
Prior to the SANS experiments, the samples were heated to 50 °C inside the sample cell and evacuated at this temperature for 2 h at a gas pressure smaller than 10−2 mbar. Then, the samples were cooled down to 290.15 K. After an (unperturbed) equilibration time of 600 s for each relative n-pentane vapour pressure step, SANS patterns and sample transmission values were collected at distances of 1.111 and 5 m to cover absolute values of the scattering vector length ranging from 0.1 to 5.4 nm-1. The data collection time for the 5 m sample-detector distance was 1800 and 300 s for SANS and transmission measurements, respectively. At 1.111 m sample-detector distance the SANS measurement time was 900 s. The neutron wavelength was λ = 0.55 nm and the collimation length used was 6 m. The thickness of the finally prepared samples was 0.381 mm for samples CN and C30, and 0.389 mm for sample C120, their diameter being 6 mm. The reduction of the SANS data was performed with the BerSANS software [Citation39]. Background correction was performed by subtracting a transmission corrected empty cell measurement from the data. Corrected 2D SANS patterns were azimuthally averaged and scattering cross sections dσ/dΩ(q) were obtained from absolute intensity calibration using the incoherent scattering of a pure H2O sample of 1 mm thickness.
In-situ dilatometry was performed on samples from the same batch but separately prepared discs of about 3 mm thickness in the follow-up of the SANS measurement. The setup used for dilatometry was made up of the identical gas dosing system but a different sample cell. This special cell was also thermostated but additionally equipped with a system for length measurement, consisting of an iron core connected to the top of the specimen by means of an aluminium pushrod. The position of the iron core and thus the specimen’s dilatation was detected by a linear variable differential transformer (LVDT). Nitrogen adsorption isotherms at 77 K, as well as the pentane adsorption isotherms (@ 290.15 K) were measured using a volumetric adsorption instrument (ASAP2020, Micromeritics). For the isothermes ordinary non-Z-SLD pentane was used.
3. Results
3.1 Sample structure characterisation via gas-adsorption and SANS
In Figure , the nitrogen (77 K) and n-pentane (290.15 K) adsorption isotherms collected from all three samples are shown. The N2 isotherms (Figure (a)) were evaluated to quantify the specific volumes of micro- and mesopores by NLDFT (see SI) and the samples specific surface area by the
-plot method [Citation40] (see Table ). The n-pentane
isotherms (Figure (b)) will be discussed further below. Generally, the shape of the adsorption isotherms fit the classification of type IV [Citation41] for micro- and (cylindrical) mesopores. The increase in specific loading seen at
for nitrogen and
for n-pentane is typically associated in literature with capillary condensation and filling of the entire void space [Citation3,Citation42]. Yet, in the model introduced in our previous work [Citation43], it was shown that these steps could indicate one of two distinct phase transitions in the materials investigated. These transitions take place between a separated ‘film phase’ to a so-called ‘bridged phase’, and a second capillary condensation event occurring at higher relative pressures from the ‘bridged’ to the completely ‘filled phase'. Although there is no distinct second step indicating this second transition at larger relative pressures in Figure (a,b), there are at least some signs of a discontinuity at
for nitrogen and
for n-pentane, in agreement with theoretical predictions [Citation43]. The broad relative pressure interval associated with the ‘film-to-bridged’ transition and the rather faint indication for the ‘bridged-to-filled’ transition for both adsorbates implies strong disorder and/or broadly distributed pore sizes on the mesopore scale. Comparing the maximum specific loading of nitrogen and n-pentane in all three samples, the CN sample fails to reach the same value for n-pentane as for nitrogen at
. Approximately 0.2 cm3(liquid)/g of the volume remains unoccupied for n-pentane as compared to nitrogen, which agrees well with the amount of micropores listed in Table . Generally, n-pentane seems to enter micropores at clearly higher relative pressures compared to nitrogen adsorption, as indicated by the shallow slope of the isotherms for relative pressures
for all three samples. Employing the Dubinin-Radushkevich [Citation44] (D-R) plot for both adsorbates in Figure allows us to compare the accessibility of micropores for n-pentane of all samples. If the D-R plots (see Figure S2) for n-pentane and nitrogen align at low relative pressures, we can assume that both adsorbates enter the same volumes. Interestingly, the plots for both n-pentane and nitrogen align well for the C30 and C120 samples, whereas a significant discrepancy in the D-R plots is found for the CN sample. We suspect that this is related to the fact that the CN sample was analysed as-prepared and that residuals from synthesis block n-pentane from entering its micropores, as the corresponding micropore size and distribution using nitrogen is not significantly different between all three samples.
Figure 2. (a) Nitrogen at 77 K and (b) n-pentane at 290.15 K adsorption isotherms for the three samples.
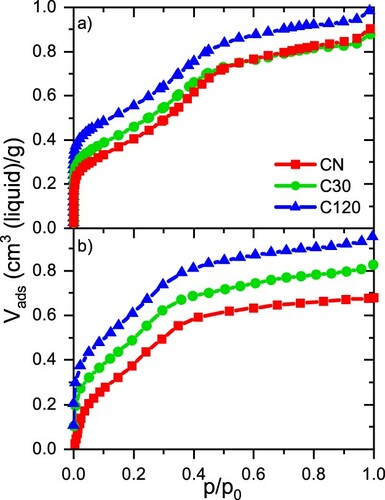
Table 1. Parameters obtained from nitrogen adsorption.
Sample activation increases specific micropore volume, whereas the specific mesopore volume decreases slightly (see Table ). The mesopore- and micropore volume fractions were determined via and
, respectively, using the value
for the skeletal density [Citation36], and the specific volumes listed in Table . As found by Koczwara et al. for samples synthesised with the same approach [Citation36], the skeletal density does not change by more than
with activation. The micropore volume fraction
with respect to the strut volume as defined by
is also listed in Table to emphasise the effect of activation on the carbon nanorods. The total pore volume fractions of the struts composed of micro- and mesopores (
) seems roughly independent on activation time with a value of
. A rough estimate of the mesopore size can be defined by the largest inscribed cylinder in-between three nanorods [Citation42] (see Figure (d)). With the distance
between nanorods derived from SANS (see Table ), the mesopore size
is given by [Citation3]:
(1)
(1) with
being a constant characteristic of 2D-hexagonally arranged cylindrical geometry. The results obtained are all well within the range of typical pore sizes reported for CMK-3 [Citation3]. The values resulting from this basic analysis are compiled in Table . A crucial parameter determining the adsorption-induced deformation of solids containing significant microporosity is the amount and pore size distribution of micropores [Citation45,Citation46] (Figure S1). Activation increases the amount of small micropores
and leads to a pronounced increase of micropores of mean size
and
. This circumstance is well reflected if we take the first moment of the micropores pore size distribution (hence for
in Figure SI, listed in Table ), where activation decreases the mean micropore size. However, the mean micropore size does not change significantly between the samples C30 and C120.
Table 2. Structural parameters obtained from SANS: lattice parameter , nanorod radius
, largest inscribed radius between adjacent nanorods
, specific mesoporosity from SANS
, mean chord length ℓ, correlation length
, specific surface area from the GRF-model
, void fraction in the carbon nanorods
as well as void fraction in the non-convex mesopore space
, specific mesopore surface
and specific micropore area
(see SI for details).
The SANS patterns of the three samples, CN, C30 and C120 in their empty state (i.e. at , Figure ) were used for further sample characterisation. The hexagonal order of the carbon nanorods is evident from the positions of the (10),(11) and (20) peaks, but due to the low resolution of SANS experiments, the latter two peaks are not resolved and merge into a single peak-like feature. However, they can be safely separated from each other since the peak positions are well defined (see Figure S5 in the SI). The lattice parameter
(see Table ), was calculated from the (10) peak position
(2)
(2) Contrary to observations on a similar material [Citation36] with identical synthesis, the lattice parameter increases with longer activation times. We attribute this difference to the heterogeneous structure of the monolithic sample along the axis of the macroscopic cylinders: whereas Koczwara et al. [Citation36] used ground monoliths, thin, cylindrical pieces, cut normal to the monoliths long axis, were used in this study. Therefore, we expect our samples to show greater variance between individual samples used for the different activations, but also greater homogeneity of structures per sample at a given activation time. Similarly, we can expect the significant sample heterogeneity to influence the porosities measured in nitrogen adsorption.
Figure 3. SANS profiles of the three evacuated carbon samples after correction of the incoherent background. The positions of the (10), (11) and (20) peaks from the 2D hexagonal arrangement of the carbon nanorods are indicated by arrows.
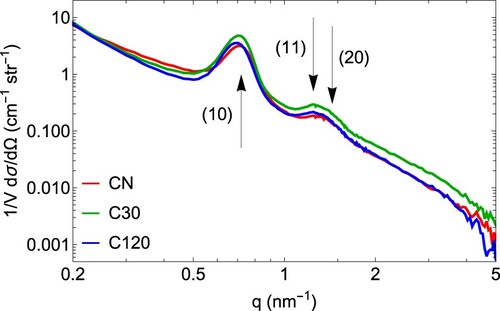
To extract the carbon nanorods radius from the SANS data, the integrated peak intensities were determined for all three peaks [Citation16,Citation47,Citation48]. The (10) peak was fit with a Pseudo-Voigt function (Equation S.33). Although the (11) and (20) peaks overlap, they can be separated by fitting two peak functions to obtain their individual integrated intensities. To limit the total number of fit-parameters while retaining good quality of fit, two Gaussians were used to fit the
and
peaks. With the integrated intensities of the three peaks an estimate of the diameter of the carbon nanorods is derived by two different methods: once the step-density formfactor model described in Zickler et al. [Citation16], as well as an adapted version of a clipped Gaussian Random Field model (GRF) [Citation48] (details are given in the sections S4 and S5 of the SI). As the GRF model could introduce porosity in the carbon nanorods and carbon phase in the empty void space, respectively, we will refer to the latter as the ‘designated mesopore space’ at later points in the discussion. Although the resulting nanorod radius
(see Table ) is the same for the two approaches, the latter method, although dependent on additional input from nitrogen adsorption, is able to give deeper insight into the structure of the materials studied. For instance, the GRF model reveals that there is a considerable amount of mesopore void fraction present within the carbon nanorods and a significant amount of carbon phase present in the void space wedged in between adjacent carbon nanorods, listed as
and
respectively, in Table . The existence of a significant amount of carbon phase present in the void space may be traced back to the complementary mesoporosity (hence, not associated with the cylindrical mesopores) present in the silica template and is thought to stabilise the carbon mesostructure [Citation49]. Estimations for SBA-15 were conducted based on in-situ adsorption SAXS data with values close to
of this so-called complementary porosity in the silica template [Citation18]. However, different synthesis parameters of the template and in the casting process could lead to significant variations. From the parameters
and
, the largest inscribed pore radius
is calculated which agrees satisfactorily with the value obtained from nitrogen adsorption. The detailed analysis reveals that the material is quite disordered on the mesoscale for lengths up to half the nanorods diameter, yet remains well ordered for sizes
, as indicated by the existence of well-pronounced Bragg peaks (see Figure ).
3.2 In-situ adsorption SANS and dilatometry
SANS patterns were measured during adsorption of n-pentane with zero scattering length density for 10 different relative pressures in the range While the coherent scattering is almost unchanged due to the use of Z-SLD pentane, the incoherent scattering increases with increasing adsorbed amount due to the strong incoherent scattering of the hydrogen atoms in the n-pentane molecules (Figure S6). The change in incoherent scattering as a function of relative pressure can be directly related to the adsorption isotherm [Citation33]. Because the sample density was not explicitly determined, the incoherent background scattering was only interpreted in terms of relative filling fractions. This was done by separating the incoherent scattering contribution by using Porods law at large values of
[Citation50]
(3)
(3) Since the incoherent scattering is independent of
, the part from the empty carbon samples
was determined from the SANS profiles at
. Subsequently, for each relative pressure the scattering contributions that are filling dependent, i.e.
and
were determined by fitting the SANS curves with Equation (3) at large
. The agreement between the incoherent scattering (Figure ) and the n-pentane adsorption isotherm (Figure (b)) is rather poor. Yet, similar to the adsorption isotherm, two step-like discontinuities are observed at relative pressures
and
which may be attributed to the two separate transitions. In particular, the step-like feature at
is more pronounced as compared to the adsorption isotherm. The differences may be attributed to sample heterogeneity and strongly different sample amounts used for the SANS and the adsorption experiments, respectively. If one assumes a macroscopic sample density of roughly
, around 6 mg of sample are illuminated by the neutron beam. In contrast, in the dedicated ex-situ adsorption measurements, around 100 mg of material was used. Consequently, the incoherent scattering in Figure may represent the filling of a more homogeneous sample due to the reduced sample volume. In addition, the relative pressures of the two step-like features in the sample loading (Figure (b) and Figure ) align quite well with the changes of deformation behaviour observed in the SANS strain isotherms in Figure (a), as discussed further below.
Figure 4. Incoherent backgrounds for n-pentane on all three samples investigated as a function of relative pressure given with the respective errors. The data were derived from SANS by fitting the respective scattering patterns.
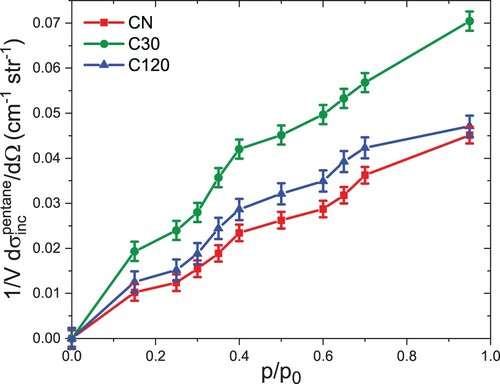
Figure 5. In-situ n-pentane adsorption strain isotherms at 290.15 K collected with SANS (a) and dilatometry (b) for the three samples with different states of activation.
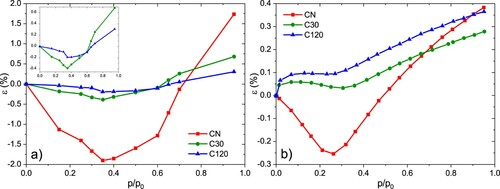
Adsorption-induced deformation was determined from the SANS profiles by fitting the (10) diffraction peak with a Pseudo-Voigt function including a linear background function to also consider the diffuse scattering [Citation33]. The strains of the individual samples were determined from the relative shift of the (10) peak position as a function of relative pressure. As shown in Figure (a), all three carbon samples exhibit qualitatively similar deformation behaviour with increasing n-pentane adsorption in SANS. At low relative pressures all samples contract until maximum contraction is reached at . For higher relative pressures the samples start to expand slightly until
, where a second distinct change with a higher slope in the expansion is observed. In the strain isotherms presented here, clear contraction of the samples is observed in the relative pressure interval previously associated with film formation and expansion [Citation43] is found with increasing relative pressure in the bridged and filled regime. For the almost completely filled samples at
the previous compression is not only compensated, but net tensile strains are reached for all three samples. Generally, the sample CN shows the largest deformation. With increasing activation the magnitude of both, contraction and final expansion of the samples decreases. We point out that this behaviour is counterintuitive, as activation and the accompanying increase in microporosity should lead to higher compliance.
Figure (b) shows the strain isotherms obtained from in-situ dilatometry during adsorption of n-pentane. Although they show a qualitatively similar shape as the isotherms obtained from SANS on first sight, there are obviously several differences. First, the CN sample is the only one showing compressive strains in dilatometry, with a maximum contraction strain of at
, while it reaches a maximum tensile strain of
at
. These strains are about an order of magnitude smaller than the SANS strains for the same sample. Second, also the position of the maximum in compression is slightly shifted compared to the SANS results. The samples C30 and C120 exhibit exclusively expansive dilatometric deformation, with a sharp increase in strain already at small relative pressures
. For all three samples, a local minimum in the strain isotherm was observed in the relative pressure range
. For relative pressures beyond this minimum a steady increase in strain occurs, until similar final tensile strains
are reached for all three samples. These strains at
are approximately 4 and 2 times smaller for the CN and C30 samples as compared to the appropriate SANS strains, whereas similar strains were observed for the C120 sample.
It is important to note that the strain isotherms shown in Figure from both, SANS and dilatometry, share very little resemblance to strain isotherms found for silica materials with cylindrical mesopores [Citation27,Citation32,Citation33]. This is certainly a consequence of the non-convex pore space and the smaller pore width at the limit of classical mesopore description, i.e. while the mesopores are isolated cylinders in the silica samples, the pore space is continuous, non-convex and therefore of more complex geometry for the carbon samples analysed here. Additionally, the carbon materials analysed here exhibit significantly higher specific microporosity, even in the as-prepared state, than the silica materials analysed in previous studies [Citation27,Citation51]. In this regard, we also cannot assign the microporosity purely to the carbon nanorods, but should also consider that the spacers in the designated mesopore space could contain micropores and are not necessarily turbostratically ordered, but rather amorphous. We also note that the strains obtained from SANS purely reflect the radial strain in the system, as they are derived from the change of the lattice spacing defined by 2D-hexagonally ordered nanorods. In contrast, the dilatometric strains originate from the transfer of strains on the mesoscopic scale to macroscopic changes of samples dimensions and thus constitute both, axial and radial strain contributions [Citation22,Citation23] of the struts comprising the nanorods.
4. Discussion
In the following, the strain data shown in Figure (a,b) are discussed. To do so, we consider three distinct fluid phases in the mesopores [Citation43]: a ‘separated phase’ with wetting films covering the nanorods at low pressure, a ‘bridged phase’ with liquid bridges between neighbouring nanorods at intermediate pressures, and a completely ‘filled phase’ at high pressures. Concurrently, we need to consider the influence of micropores on the deformation measured with SANS and dilatometry, which is most likely not tied to the existence of any of the above phases as we expect them to fill at comparatively low relative pressures.
Adsorption at small relative pressures we have previously associated with a ‘separated phase’ where a liquid film covers the nanorods. In this region, exclusively compressive strains are observed in SANS (Figure (a)). In recent theoretical considerations of adsorption-induced deformation in non-convex pores by Kolesnikov et al. [Citation52] no significant contraction was observed as a result of the separated phase. Additionally, analytical calculations (see section S2 in the SI, as well as Figure S3 and S4) which determine the stress and strain induced by the separated phase show that these should be exclusively expansive in nature. Micropores present in the carbon phase may in principle lead to contraction of the sample upon their filling with adsorbate at very low relative pressures [Citation45,Citation46]. This could play a significant role in the deformation of the C30 and C120 samples, but not for the CN sample as its micropores are not entered by n-pentane upon adsorption, as we deduce from the comparison of nitrogen and n-pentane adsorption data. Hence, the shape of the SANS and dilatometry strain isotherm of the CNsample should be the result of mesoporous effects alone. The compressive nature of the strains observed for the separated phase are likely the result of significant disorder on the mesopore scale, which could lead to small filling events in local constrictions possibly leading to distributions of liquid similar to a ‘bridged phase’. Kolesnikov et al. [Citation52] have recently demonstrated that a bridged phase leads to significant compressive strain, as observed also experimentally in the present work. However, the deformation amplitude of the sample CN shows the larger (SANS) or similar (dilatometry) strain at as compared to the two activated samples. This is astonishing since this sample exhibits the lowest microporosity which does even not contribute actively to the adsorption-induced deformation. Previous studies have clearly demonstrated the significance of micropores to the amplitude of strain in experimental isotherms [Citation23]. In this context, we note that in contrast to the sample CN, the samples C30 and C120 show a strong expansive increase in dilatometric strain at very low relative pressures
. We attribute this feature to the expansion of micropores and thus respective expansion of the microporous carbon rods and interconnections in the C30 and C120 samples due to n-pentane adsorption. Such an effect is obviously not present in sample CN.
For the designated ‘bridged phase’ the strain recorded in SANS for all three samples increases slightly with relative pressure, but stays in the compressive regime in SANS until relative pressures associated with the filled phase are reached. The slight increase in strain contradicts the recent theoretical results from Kolesnikov et al. [Citation52], where the bridged phase leads to increasingly compressive strains only. Although the measured strain is generally compressive in the bridged regime, the clear deviation from the predicted behaviour of SANS strain isotherm demonstrates the necessity to consider other contributions, such as expansive strains originating from microporosity. However, as the CN sample should not be influenced by micropore filling, we point out that constrictions in the mesopore space could lead to pockets of adsorbed liquid resembling a filled phase, which should exhibit expansive behaviour due to the Kelvin-Laplace equation [Citation53]. Hence, even for the CN sample an increase in strain could be reasonable with increasing relative pressure in the bridged phase regime. Still, we note that for the C30 and C120 samples additional microporous contributions could influence the shape of the strain isotherm in the bridged phase regime. In dilatometry, no clear interval in relative pressure associated with a bridged phase is observed for any of the samples, although a pronounced, local minimum in strain is visible at relative pressures corresponding roughly to the minimum in strain observed in SANS. Because dilatometry is also sensitive to axial strains [Citation22], we can expect the dilatometric strain isotherm to be influenced by both, the axial expansion of the carbon nanorods due to the ‘Bangham effect’ [Citation54] and the micropore strain contribution. Therefore, depending on the contribution of axial and radial strains superimposed by micropore contributions, the measured dilatometry strain isotherm must not necessarily mirror the SANS strain isotherm in shape and magnitude.
The filled phase regime on the other hand exhibits a linear dependence of the strain on the logarithm of the relative pressure for both, the SANS and dilatometry data. Both, mesopore and micropore strains are proportional to the Kelvin-Laplace equation [Citation53] and therefore such dependence is to be expected. For mesopores, we can assume that an approximately hemispherical meniscus spans the void space between three adjacent nanorods at their respective ends and the following relationship for the Laplace pressure holds [Citation53]
(4)
(4) Radial mesoporous stresses between adjacent nanorods due to the Laplace pressure can be used to calculate radial strains [Citation53]
(5)
(5) where the ‘pore load modulus’
is a mechanical parameter defined as the ratio of the Laplace pressure and radial strains probed by SANS. Influences of axial stresses would have to be taken into account as a pre-factor in
when applying an explicit mechanical model [Citation22]. In samples exhibiting convex pore spaces, such as SBA-15 or MCM-41,
is dependent on the pore walls Young’s modulus
, the mesoporosity
, the Poisson’s ratio
as well as the pore geometry [Citation22,Citation23,Citation53]. Additionally, also micropore strain contributions follow the Kelvin-Laplace regime at pressures close to saturation, which further complicates the interpretation of
. In the case of the open void space present in the samples investigated here, it is not obvious which structures deform upon adsorption. For instance, it is not clear whether micropores are present in both, the carbon nanorods and the interconnections, and whether their structure is different. We may consider the effect of activation on different parts of the structure, which is known to remove preferentially amorphous carbon as compared to more ordered carbon.
We will address the effective elastic moduli determined from SANS and dilatometry with Equation (5) by and
, respectively. On the mesopore scale, we assume that interconnections between adjacent carbon nanorods are most likely to deform predominately in conjunction with recent considerations [Citation52]. But since the density and geometric arrangement of these interconnections is completely unknown, we initially refrain from assuming any detailed mechanism and consider the values of
and
as representative values of the system stiffness under the given mechanical ‘pore load’. As shown in Figure , all SANS strain isotherms can be fitted well with Equation (5) for
. The resulting pore-load moduli
are listed in Table . An increase in the system’s stiffness is observed with increasing activation time, which seems counterintuitive since the considerable increase in microporosity (see Table ) is assumed to reduce the carbon materials Young modulus according to
[Citation55]. The large increase of the measured stiffness upon activation, approximately by a factor of 4 between CN and C30 and a factor of 2 between C30 and C120, could be either a true increase in the materials stiffness, or an apparent increase due to a deformation mechanisms not considered sofar.
Figure 6. The SANS strain isotherms are shown for all three samples in (a–c). The blue line in all sub-plots is the fit with Equation (5) in the filled pore regime, with the respective effective moduli being listed in Table .
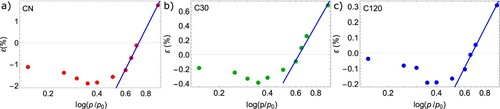
Table 3. Pore load moduli and
(Equation (5)) for the CN, C30 and C120 carbon materials.
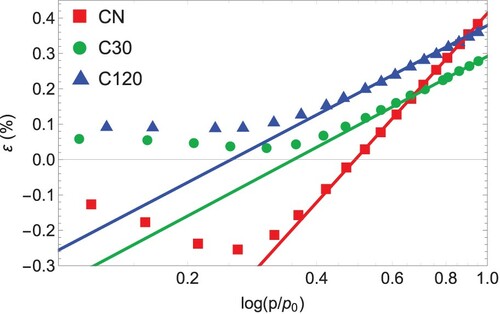
The strains measured by in-situ dilatometry were also analysed with the Kelvin-Laplace equation (Equation (5)) for relative pressures . We note again that in contrast to strains measured by SANS, the dilatometric strains are influenced by both, radial and axial stresses due to the anisotropic mesostructure, as well as the mechanics of the disordered strut network on a higher hierarchical level. Yet, because strains measured with in-situ dilatometry should also be related to capillary pressure in the filled pore regime, Equation (5) was used to fit the dilatometric strain isotherms of all samples for
. Again, a linear relationship was found between capillary pressure and strains in the filled pore regime (Figure ). The corresponding pore load moduli (Table ) are considerably larger than
, but also show the trend to increase upon activation, i.e.
approximately doubles between CN and C30, but remains practically constant for the two different activation times C30 and C120.
Figure 7. Dilatometric strain from in-situ n-pentane adsorption of CN (red), C30 (green) and C120 (blue). The straight, dashed lines are the fits with Equation (5) which determines the pore load modulus from dilatometry.
One reason for the measured increase of could be due to the transfer of strains on the mesoscale to the macroscale. As the struts constituted by 2D-hexagonally ordered carbon nanorods form a disordered network, the joints where they meet are crucial to the macroscopic deformation. Previously, Balzer et al. [Citation22] have successfully approximated the deformation of the macroporous scaffold by simply adding radial and axial strain contributions with weights associated with the strut geometry [Citation22]. Within their model, they implicitly assumed that joints transfer the strain as if they were ideally stiff. This results in radial and axial strains being necessarily the same at saturation pressure [Citation56], substantiating the approach chosen by Balzer et al. [Citation22]. In contrast, in the present experimental study, we observe that for the CN and C30 sample this is definitely not the case (see Figure (a,b)). Only for the C120 sample similar strains close to saturation pressure are found for SANS and dilatometry. The result that both, SANS and dilatometric strains should be of the same numerical value close to saturation pressure also contains the assumption that adsorption-induced stresses act on materials with the same elastic properties, and that bending or torsion of struts/joints are negligible.
From these considerations, we conclude that the pore load moduli obtained from SANS are mostly dominated by the interconnections between the carbon nanorods, which seem to be quite compliant for the CN sample and apparently stiffen considerably upon activation. The carbon nanorods on the other hand should exhibit decreasing stiffness with increasing activation time due to the higher specific microporosity [Citation55]. Hence, assuming that the linear scaling of radial and axial strains contributing to the measured deformation in dilatometry is valid for the small deformations encountered in experiment, the tradeoff of the stiffening of interconnections and the increased compliance of carbon nanorods due to microporosity could lead to macroscopically stiffer sample responses in dilatometry. Still, an important point of this discussion concerns the role of the interconnections between carbon nanorods in adsorption-induced deformation. Given that the deformational behaviour of micropores just below saturation pressures is expansive, one would expect a decrease in elastic modulus of the carbon material due to an increase in the volume fraction of micropores. Additionally, the effect of increased microporosity should decrease dilatometric pore-load moduli. However, the opposite seems to occur for the samples investigated (see Table ). SANS and nitrogen adsorption have shown that the mean mesopore size does not vary significantly between all three samples, which should rule out differences in adsorption-induced stresses leading to reduced pore load moduli. Consequently, we must attribute the differences in pore-load moduli in SANS and dilatometry mainly to the stiffening of interconnections between the carbon nanorods. An increase in a carbon stiffness due to activation has not been reported so far to the best of our knowledge. Yet, because activation has been carried out at high temperatures (950°C) with increasing activation times, we tentatively consider a ‘annealing effect’ on the carbon phase interconnecting the carbon nanorods, and a concurrent increase in the interstitials stiffness. However, due to the complex mesoscale structure, we cannot rule out more subtle differences in the deformational mechanism due to activation. A conclusive answer to this question must remain open for future investigations.
5. Conclusion
In conclusion, the adsorption-induced deformation of three hierarchical carbon materials with non-convex mesopore spaces was found to be qualitatively and quantitatively different as compared to materials containing convex mesopores of similar size and volume fraction [Citation22,Citation27]. The shape of the strain isotherms implies that some intermittent phase exists prior to the filling of the entire void space [Citation43,Citation52], as three relative pressure intervals with distinct behaviour can be distinguished. Recent theoretical work on the solvation pressure inside the void space in between 2D-hexagonally arranged carbon nanorods [Citation43,Citation52] confirms that the shape of strain isotherms observed with SANS could be due to some sort of ‘bridged-phase’, although the relative pressure interval where it should be stable might overlap significantly with the ‘filled phase’ due to the disordered nature of the mesopore space.
At high relative pressures, the 'filled phase' can be described with the Kelvin-Laplace equation [Citation53], which allowed us to determine effective pore-load moduli in SANS and dilatometry. For both methods, a stiffening of the samples with activation is found, which we attribute to stiffening of interconnections between carbon nanorods. Given the structural information from nitrogen adsorption and SANS, we cannot interpret the stiffening of the samples with structural changes. Therefore, we tentatively propose an annealing of the not removed carbon during activation. Even though the present work provides some first insights, we conclude that further investigations in conjunction with theoretical considerations are definitely needed to fully elucidate adsorption-induced deformation in these complex materials.
Supplementary Material
Download MS Word (634.2 KB)Disclosure statement
No potential conflict of interest was reported by the author(s).
Additional information
Funding
References
- G.Y. Gor, P. Huber and N. Bernstein, Appl. Phys. Rev. 4, 11303 (2017). doi:https://doi.org/10.1063/1.4975001
- P.I. Ravikovitch and A.V. Neimark, Langmuir. 22, 11171–11179 (2006). doi:https://doi.org/10.1021/la0616146
- G.Y. Gor, M. Thommes, K.A. Cychosz and A.V. Neimark, Carbon N. Y. 50, 1583–1590 (2012). doi:https://doi.org/10.1016/j.carbon.2011.11.037
- C. Balzer, T. Wildhage, S. Braxmeier, G. Reichenauer and J.P. Olivier, Langmuir. 27, 2553–2560 (2011). doi:https://doi.org/10.1021/la104469u
- D. Brandhuber, N. Huesing, C.K. Raab, V. Torma and H. Peterlik, J. Mater. Chem. 15, 1801 (2005). doi:https://doi.org/10.1039/b417675h
- K. Nakanishi and N. Tanaka, ChemInform. 38, 863-837 (2007). doi: https://doi.org/10.1021/ar600034p
- J.W. McBain and J. Ferguson, J. Phys. Chem. 31, 564–590 (1927). doi:https://doi.org/10.1021/j150274a010
- S. Hlushak, Phys. Chem. Chem. Phys. 20, 872–888 (2018). doi:https://doi.org/10.1039/C7CP06591D
- A. Masic, L. Bertinetti, R. Schuetz, S.-W. Chang, T.H. Metzger, M.J. Buehler and P. Fratzl, Nat. Commun. 6, 5942 (2015). doi:https://doi.org/10.1038/ncomms6942
- B. Derjaguin, Prog. Surf. Sci. 40, 46–61 (1992). doi:https://doi.org/10.1016/0079-6816(92)90032-D
- J. Broekhoff and J.H. de Boer, J. Catal. 9, 8–14 (1967). doi:https://doi.org/10.1016/0021-9517(67)90174-1
- W.F. Saam and M.W. Cole, Phys. Rev. B. 11, 1086–1105 (1975). doi:https://doi.org/10.1103/PhysRevB.11.1086
- Findenegg, G. H., Groß, S., Michalski, T., Stranski, I. N. Multilayer Adsorption and Pore Condensation in Controlled-Pore Glass: A Test of the Saam-Cole Theory of Mesopore Filling. In Fundamentals of Adsorption, Proceedings of the Fourth International Conference on Fundamentals of Adsorption; Elsevier, 1993; Vols. 80, pp. 161–168.
- C.T. Kresge, M.E. Leonowicz, W.J. Roth, J.C. Vartuli and J.S. Beck, Nature. 359, 710–712 (1992). doi:https://doi.org/10.1038/359710a0
- F. Zhao, M. Huo and C. Fredrickson, Science. 279, 548–552 (1998). doi:https://doi.org/10.1126/science.279.5350.548
- G.A. Zickler, S. Jähnert, W. Wagermaier, S.S. Funari, G.H. Findenegg, and O. Paris, Phys. Rev. B. 73, 17 (2006). doi: https://doi.org/10.1103/PhysRevB.73.184109
- G.H. Findenegg, S. Jähnert, D. Müter, J. Prass and O. Paris, Phys. Chem. Chem. Phys. 12, 7211–7220 (2010). doi:https://doi.org/10.1039/c001541p
- S. Jähnert, D. Müter, J. Prass, G.A. Zickler, O. Paris and G.H. Findenegg, J. Phys. Chem. C. 113, 15201–15210 (2009). doi:https://doi.org/10.1021/jp8100392
- Yun, J.-H., He, Y., Otero, M., Düren, T., Seaton, N. A, Adsorption equilibrium of polar/non-polar mixtures on MCM-41: experiments and Monte Carlo simulation. In Characterization of Porous Solids VI, Proceedings of the 6th International Symposium on the Characterization of Porous Solids (COPS-VI); Elsevier, 2002; Vols. 144, pp. 685–692.
- V. Yelpo, V. Cornette, J.P. Toso and R.H. López. Characterization of nanostructured carbon CMK-3 by means of Monte Carlo simulations, Carbon. N. Y. 121, 106–113 (2017). doi:https://doi.org/10.1016/j.carbon.2017.05.085
- Ravikovitch, P. I., Neimark, A. V. Calculations of pore size distributions in nanoporous materials from adsorption and desorption isotherms. In Nanoporous Materials II, Proceedings of the 2nd Conference on Access in Nanoporous Materials; Elsevier, 2000; Vols. 129, pp. 597–606.
- C. Balzer, A.M. Waag, S. Gehret, G. Reichenauer, F. Putz, N. Hüsing, O. Paris, N. Bernstein, G.Y. Gor and A.V. Neimark, Langmuir. 33, 5592–5602 (2017). doi:https://doi.org/10.1021/acs.langmuir.7b00468
- C. Balzer, A.M. Waag, F. Putz, N. Huesing, O. Paris, G.Y. Gor, A.V. Neimark and G. Reichenauer, Langmuir. 35, 2948–2956 (2019). doi:https://doi.org/10.1021/acs.langmuir.8b03242
- G.Y. Gor and A.V. Neimark, Langmuir. 26, 13021–13027 (2010). doi:https://doi.org/10.1021/la1019247
- G.Y. Gor and A.V. Neimark, Langmuir. 27, 6926–6931 (2011). doi:https://doi.org/10.1021/la201271p
- G.Y. Gor, O. Paris, J. Prass, P.A. Russo, M.M.L. Ribeiro Carrott and A.V. Neimark, Langmuir. 29, 8601–8608 (2013). doi:https://doi.org/10.1021/la401513n
- L. Ludescher, R. Morak, C. Balzer, A.M. Waag, S. Braxmeier, F. Putz, S. Busch, G.Y. Gor, A.V. Neimark, N. Huesing, G. Reichenauer, and O. Paris, Langmuir 35, 11590-11600 (2019). doi: https://doi.org/10.1021/acs.langmuir.9b01375
- A.V. Neimark, F.-X. Coudert, A. Boutin and A.H. Fuchs, J. Phys. Chem. 1, 445–449 (2010).
- I. Langmuir, J. Am. Chem. Soc. 40, 1361–1403 (1918). doi:https://doi.org/10.1021/ja02242a004
- S. Jun, S.H. Joo, R. Ryoo, M. Kruk, M. Jaroniec, Z. Liu, T. Ohsuna and O. Terasaki, J. Am. Chem. Soc. 122, 10712–10713 (2000). doi:https://doi.org/10.1021/ja002261e
- C. Koczwara, S. Rumswinkel, C. Prehal, N. Jäckel, M.S. Elsässer, H. Amenitsch, V. Presser, N. Hüsing and O. Paris, ACS Appl. Mater. Interfaces. 9, 23319–23324 (2017). doi:https://doi.org/10.1021/acsami.7b07058
- C. Balzer, R. Morak, M. Erko, C. Triantafillidis, N. Hüsing, G. Reichenauer, and O. Paris, Z. Phys. Chem. 229, 1189–1209 (2015). doi: https://doi.org/10.1515/zpch-2014-0542
- R. Morak, S. Braxmeier, L. Ludescher, F. Putz, S. Busch, N. Hüsing, G. Reichenauer and O. Paris, J. Appl. Crystallogr. 50, 1404–1410 (2017). doi:https://doi.org/10.1107/S1600576717012274
- J. Prass, D. Müter, M. Erko and O. Paris, J. Appl. Crystallogr. 45, 798–806 (2012). doi:https://doi.org/10.1107/S0021889812025058
- L. Ludescher, R. Morak, S. Braxmeier, F. Putz, N. Hüsing, G. Reichenauer and O. Paris, Phys. Chem. Chem. Phys. 22, 12713–12723 (2020). doi:https://doi.org/10.1039/D0CP01026J
- C. Koczwara, S. Rumswinkel, L. Hammerschmidt, M. Salihovic, M.S. Elsaesser, H. Amenitsch, O. Paris and N. Huesing. ACS Appl. Energy Mater. 2, 5279–5291 (2019). doi:https://doi.org/10.1021/acsaem.9b01035
- Ryoo, R., Joo, S. H., Jun, S., Tsubakiyama, T., Terasaki, O. 07-O-01 - Ordered mesoporous carbon molecular, sieves by templated synthesis: the structural varieties. In Zeolites and Mesoporous Materials at the Dawn of the 21st Century, Proceedings of the 13th International Zeolite Conference; Elsevier, 2001; Vols. 135, p. 150.
- F. Putz, L. Ludescher, M.S. Elsaesser, O. Paris and N. Hüsing, Chem. Mater. 32, 3944–3951 (2020). doi:https://doi.org/10.1021/acs.chemmater.0c00302
- U. Keiderling, Appl. Phys. A. 74, s1455–s1457 (2002). doi:https://doi.org/10.1007/s003390201561
- K. Kaneko, C. Ishii, M. Ruike and H. Kuwabara, Carbon. N. Y. 30, 1075–1088 (1992). doi:https://doi.org/10.1016/0008-6223(92)90139-N
- F. Rouquerol, Adsorption by powders and porous solids: principles, methodology and applications (Elsevier/Academic Press, Amsterrdam, 2014).
- S.H. Joo, S. Jun and R. Ryoo, Microporous Mesoporous Mater. 44-45, 153–158 (2001). doi:https://doi.org/10.1016/S1387-1811(01)00179-2
- L. Ludescher, S. Braxmeier, C. Balzer, G. Reichenauer, F. Putz, N. Hüsing, G.Y. Gor and O. Paris, Adsorption. 26, 563–578 (2020). doi:https://doi.org/10.1007/s10450-020-00215-6
- M.M. Dubinin, Chem. Rev. 60, 235–241 (1960). doi:https://doi.org/10.1021/cr60204a006
- P. Kowalczyk, A. Ciach and A.V. Neimark, Langmuir. 24, 6603–6608 (2008). doi:https://doi.org/10.1021/la800406c
- C. Balzer, R.T. Cimino, G.Y. Gor, A.V. Neimark and G. Reichenauer, Langmuir. 32, 8265–8274 (2016). doi:https://doi.org/10.1021/acs.langmuir.6b02036
- M. Impéror-Clerc, Interface. Focus. 2, 589–601 (2012). doi:https://doi.org/10.1098/rsfs.2011.0081
- C.J. Gommes and J.-P. Pirard, Phys. Rev. E. 80, 61401 (2009). doi:https://doi.org/10.1103/PhysRevE.80.061401
- S.H. Joo, R. Ryoo, M. Kruk and M. Jaroniec, J. Phys. Chem. B. 106, 4640–4646 (2002). doi:https://doi.org/10.1021/jp013583n
- Glatter O., Kratky O. Small angle x-ray scattering, edited by O. Glatter and O. Kratky, 2nd ed. (Academic Press, London, NY, 1983).
- F. Putz, A. Waag, C. Balzer, S. Braxmeier, M.S. Elsaesser, L. Ludescher, O. Paris, W.J. Malfait, G. Reichenauer, and N. Hüsing, Microporous Mesoporous Mater. 288, 109578, 1–10 (2019). doi:https://doi.org/10.1016/j.micromeso.2019.109578
- A.L. Kolesnikov, Y.A. Budkov, and G.Y. Gor, J. Phys. Chem. C 124, 20046–20054 (2020). doi:https://doi.org/10.1021/acs.jpcc.0c03963
- J. Prass, D. Müter, P. Fratzl and O. Paris, Appl. Phys. Lett. 95, 83121 (2009). doi:https://doi.org/10.1063/1.3213564
- D.H. Bangham and N. Fakhoury, Nature. 122, 681–682 (1928). doi:https://doi.org/10.1038/122681b0
- Gibson L. J., Ashby M. F. Cellular solids: structure and properties, 2nd ed. (Cambridge Univ. Press, Cambridge, 2001).
- G.Y. Gor, P. Huber, and J. Weissmüller, Phys. Rev. Mater. 2, 086002, 1–17 (2018). doi:https://doi.org/10.1103/PhysRevMaterials.2.086002