
 ?Mathematical formulae have been encoded as MathML and are displayed in this HTML version using MathJax in order to improve their display. Uncheck the box to turn MathJax off. This feature requires Javascript. Click on a formula to zoom.
Abstract
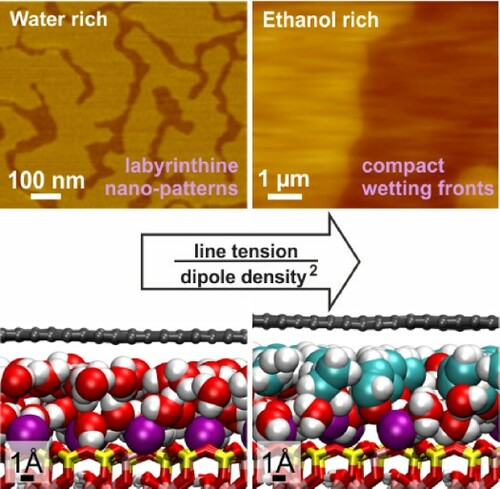
Interfaces between mica and graphene, as well as the transition metal dichalcogenides (TMDCs) MoS2 and WS2, were wetted with water and ethanol, and investigated employing scanning force microscopy and molecular dynamics (MD) simulations. Below 25% RH, water wets the graphene-mica interface with labyrinthine structures, exhibiting branch widths of about 50 nm for single layers of graphene, increasing to almost an order of magnitude more for four graphene layers. At mica-TMDC interfaces, water films exhibit a transition from labyrinthine to compact morphology upon going from single- to multi-layers of the TMDCs. Ethanol films show a compact morphology at all the interfaces, regardless of the number of 2D material layers on top. The film morphologies are attributed to an equilibrium between electrostatic repulsion of preferentially oriented molecular dipoles, and the line tension of the wetted areas, which is dominated by the deformation of the 2D materials at the edges of the wet areas. The compact front of the water wetting film under multilayers of TMDCs is attributed to a much larger bending stiffness of these materials than of graphene multilayers. The thickness dependent stiffness of the 2D materials may be employed to shape their surfaces from the nano- to the micrometer scale.
GRAPHICAL ABSTRACT
Introduction
Molecular films intercalating interfaces modify the interfacial properties and the functional performance of devices comprising the interfaces [Citation1,Citation2]. For instance, intercalating molecular films shift the energy level alignment at functional interfaces in electronic devices and consequently, the device performance [Citation1,Citation3,Citation4]. Additionally, insertion of merely molecularly thick films significantly alters the lubricity of interfaces [Citation5]. How the intercalant molecular films alter interfacial properties depends on the structure of the films [Citation6]. Acquiring experimental insight into the structure of films confined at solid–solid interfaces is challenging, particularly in case of thin films of small and ubiquitous solvent molecules such as water and ethanol.
Water films confined in nanopores exhibit unique phase transitions, which has been subject of a series of publications by Gerhard Findenegg et al. [Citation7–10]. The large Laplacian pressure of water condensing in nano capillaries leads to the deformation of capillary walls, trapping the liquid film inside [Citation8]. Three-dimensional imaging of capillary condensation at scales close to the size of the rather small water molecule is still rare.
Flexible interfaces between a mica substrate and 2D materials exfoliated thereon, are emerging as a model experimental system to investigate structure and properties of thin films of small molecules confined to interfaces [Citation11–16]. Muscovite mica is a naturally occurring hydrophilic layered crystal. It exhibits macroscopically large atomically flat cleavage planes. For this reason, it is widely used as a substrate for imaging single macromolecules or thin molecular films. Furthermore, for its structural and chemical homogeneity, mica has been widely used to investigate properties of liquids when squeezed between its surfaces [Citation15,Citation16]. 2D materials deposited onto a mica surface covered with a molecular liquid film prevent film disruption by a Scanning Force Microscopy (SFM) tip [Citation11]. Furthermore, 2D materials such as graphene and molybdenum disulfide (MoS2) when deposited on a substrate replicate the topography of molecular films and even single molecules residing on the substrate [Citation11,Citation12]. This allows to image the films confined at the mica-2D sheet interfaces with SFM.
When deposited on a clean mica substrate, 2D materials essentially create homogeneous ultra-flat interfaces [Citation17,Citation18]. Furthermore, graphene, MoS2, and WS2 are impermeable to small molecules like water [Citation19–21]. Consequently, intercalation of the molecules into the interfaces occurs only through the edges of the 2D sheets, thereby allowing to investigate interfacial wetting and dewetting phenomena [Citation13,Citation22,Citation23]. Moreover, comparison of the wetted and dry interfaces allows to investigate the influence of the films on the interfacial properties [Citation4].
Water is a particularly interesting molecule due to its prevalence and relevance in technology and biology. During wetting of the graphene-mica and MoS2-mica interfaces, a 2.8 ± 0.2 Å thick film of water exhibits a highly ramified labyrinthine morphology eventually forming a homogeneous monolayer [Citation22]. It has been hypothesised that the labyrinthine structure of the water wetting film is a consequence of counteracting electrostatic repulsion and line tension, similarly to modulated phases in thin layers of ferrofluids and Langmuir films [Citation22,Citation24]. The relative strengths of the dipole repulsion and the line tension interactions determine the emergent length scale of the modulated phases. The deformation of the 2D covers at edges of the labyrinthine structures was assumed to contribute to the line tension. Thereby, the flexibility of confining walls has been expected to control the width of the stripes. To test this prediction, we varied here the thickness and type of the covering 2D sheets and examined how this influences the structure of the wetting films. Using ethanol instead of water allows to test predictions on the morphology dependence on the dipole density of the wetting film.
Results and discussion
In the following, we first present and discuss results on water wetting mica interfaces with graphene, MoS2 and WS2 sheets of variable thickness. Then, we continue with the results and discussion of ethanol wetting the interfaces. The interpretation of experimental results and ensuing predictions on the properties of ethanol and water films will be assessed by MD simulations.
Flakes of graphene, MoS2 and WS2 deposited onto mica in a quite dry environment of less than 10 ppm of water exhibit atomically flat surfaces in SFM tapping mode (TM) height images. A water film intercalates at the 2D material-mica interfaces starting from the edges of the 2D materials upon increasing the humidity. Wetting of one-layer graphene (1LG) and one-layer MoS2-mica (1LMoS2) interfaces by water has been addressed in detail previously [Citation22]. We will focus in the following on the dependence of lateral shapes on the thickness of the covering 2D materials. Figure (a) shows typical height images of up to three layers thick graphene on mica, partially wetted by water. The water wetting film exhibits labyrinthine patterns for 1LG and up to a few layers thick graphenes. The heights of water wetting films are 2.8 ± 0.3 Å for all 2D covers we investigated. Imaging of several samples confirmed the labyrinthine shapes of wetting films with clearly identifiable labyrinthine bands for multilayer graphene with thicknesses up to at least 4 graphene layers. The channels, which separate the labyrinthine patterns, were also visible under graphene films thicker than 4 layers. That is, there is no evidence for a transition from a labyrinthine to any other shape for thicker graphene covers. The width of the bands has not been measured for graphenes thicker than 4 layers. The width of a band fluctuates strongly along the band. Nevertheless, the measured widths, as function of graphene thickness, are presented in Figure . The measured width of the bands grows with the thickness of graphene cover (Figure ); we will discuss the dependency further below.
Figure 1. Layer-dependent morphologies of ultrathin water wetting film in graphene-mica, WS2-mica, and MoS2-mica interfaces: SFM height images of (a) graphene-mica interface, (b) WS2-mica interface, (c and d) MoS2-mica interface. In (b), WS2 single and double layers are partially wetted. (c) shows early stage of wetting under double layer MoS2 and D shows later wetting stage in the same area of MoS2. Number of 2D material layers are shown in roman numerals. In (a), under 1–3 layers thick graphenes the water film exhibits a labyrinthine morphology. Image (b) shows WS2 single layer with structured and double layer with compact wetting film. Image (c) shows earlier stage of wetting where region II of MoS2-mica interface is partially wetted with water. D shows region II of MoS2 now fully wetted, and region I is partially wetted. In both WS2 and MoS2 only under single layers the wetting film is laterally structured. Under the two layers of WS2 and MoS2 a compact wetting film of water is observed. Bare mica in all images is replaced with a grey color (see Supporting Information for details). Images without the grey masks are shown in supporting information Figure S1.
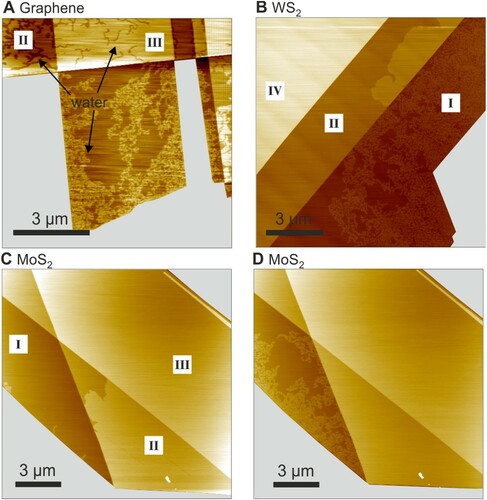
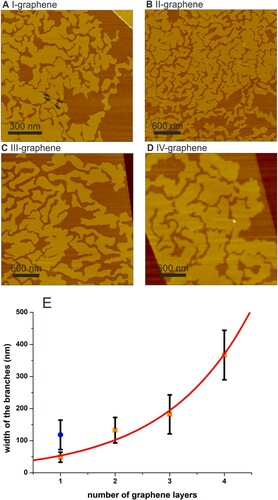
Figure 2. Graphene layer thickness dependent widths of structure. (a–d) height images of water wetting mica-graphene interfaces with graphene thicknesses ranging from 1 to 4 graphene layers. Black lines in (a) mark typical cross-sectional profiles used for measuring structure widths. (e) Structure width increases with graphene layer thickness; the squares show the data for water wetting graphene mica interfaces. The circle shows the band width for water wetting monolayer MoS2. The error bars show the standard deviations. The solidline is the fit of the experimental data for graphene with an exponential function .
In contrast to graphene, MoS2 and WS2 covered wetting films of water exhibit a transition from labyrinthine to compact shape as the thickness of the transition metal dichalcogenide (TMDC) sheets is increased from 1 to 2. Figure (b)–(d) show images of single and adjacent double layers of TMDCs covering the wetting water film. While under one layer TMDCs the water wetting film exhibits distinct labyrinthine morphology, under two layer TMDCs it appears compact. The absence of channels which delineate the labyrinthine structures in TMDC multilayers further, supports the observation. Hence, the wetting water film shape has undergone a transition labyrinthine-to-compact when the cover thickness is increased from single to double layer TMDCs. The wetting films exhibit compact morphology also under thicker than bilayer TMDC flakes.
We will discuss in the following the dramatic difference between the wetting patterns of TMDC and graphene bilayers, when undergoing wetting with water. To rationalise the difference we recall that the emergence of wetting morphology has been attributed to the interplay of electrostatic repulsion of water dipoles oriented normally to interface, and line tension. We define the line tension as the energy cost per unit length to create a line interface between the areas already intercalated and not yet intercalated with molecularly thin layers. The line tension is determined by the deformation of the 2D material sheets at the boundaries of the wetting patterns [Citation22]. The same interplay is known to give rise to periodic stripe patterns in Langmuir films [Citation24]. The parameters governing the stripe width in the stripe phase are the mean distance d between the molecular dipoles, their dipole moment p, and the line tension λ. The only dimensionless combination which can be built from these three quantities (and the dielectric constant , in the international system of units) is a combination
with
being the mean density of dipole moment in the system. Therefore, the natural form of the dependence of the stripes’ width on the parameters of the system must be:
The exponential form for the function f follows from the calculation of the interaction energy of dipoles within the stripe and stems from the sub-leading logarithmic term corresponding to the long-range interactions [Citation25].
(1)
(1)
The complex shape of the patterns in our case can be attributed to thermal excitations and/or inhomogeneous distribution of ions on the mica surface with the typical dimension still obeying Equation (1) [Citation26]. The larger electrostatic repulsion favours equidistant spacing between the water dipoles i.e. it favours the reduction of the labyrinthine band width. On the other hand, the larger line tension favours the unstructured wetting i.e. larger band width. The morphological transition of wetting film morphology from labyrinthine to compact under double-layer TMDCs can be attributed to diminished electrostatic repulsion, an increased line tension, or a combination of both. A full quantitative discussion of all contributing factors is non-trivial; we will provide a qualitative discussion in the following.
The orientation of water molecules at the interface is dominated by the ionic mica surface i.e. the structure of molecular layers is similar for TMDC and graphene covers, and it does not depend on the thickness of the covering sheets (see the MD simulations below). Nevertheless, the difference in contribution of the covering 2D sheets to electrostatics may result in the wetting pattern difference. Double layer graphene is expected to screen coulomb interactions more efficiently compared to a TMDC bilayer [Citation27,Citation28]. The screened coulomb repulsion should cause wider bands under bilayer graphene than MoS2. This contradicts, however, our experimental findings. Therefore, we conclude that the possible difference in the electrostatic repulsion of water dipoles induced by the 2D covers does not dominate the pattern formation. Thus, we focus our discussion in the following on the difference in contributions to line tension between the bilayers of TMDC and graphene. The 2D material sheets covering emerging wetting patterns must deform on the pattern edges. The deformation causes both local bending and stretching of the sheets. The in-plane stretching can be expected to be more localised for TMDC sheets due to their larger friction with the substrate to compare with graphene [Citation5]. On the other hand, TMDC bilayers are about two times softer compared to graphene [Citation29,Citation30]. Quantitative estimation of the in-plane strain contribution to line tension is difficult due to unknown strain delocalisation.
The bending stiffness of MoS2, contrary to graphene, increases by more than one order of magnitude from mono- to bi-layer [Citation31]. We assume the same for WS2 due to its structural similarity with MoS2. In graphene, it has been shown to grow only by a factor of two [Citation32]. We assume the 2D sheets to closely follow the substrate i.e. we assume their strong adhesion to the substrate. With these assumptions, line tension is expected to grow linearly with the bending stiffness of the sheets. The contribution of mechanical deformation of the 2D sheets to the line tension can be split into two components: in-plane stretching and bending deformations. The in-plane stretching is expected to grow proportionally to the thickness of the 2D sheets. On the other hand, the bending deformation for TMDCs is expected to grow with the cube of the sheets’ thickness i.e. much faster to compare with graphene [Citation31]. Additionally, we propose that the contribution of the bending deformation to line tension in thicker than a single TMDC sheet dominates the line tension. Then the labyrinthine bands of a water film wetting TMDC bilayer-mica interfaces are expected to be wider by more than three orders of magnitude as compared to the width in graphene bilayer-mica interface according to Equation (1). The characteristic width of the labyrinthine bands of water wetting graphene bilayer-mica interface were on the order of a hundred nanometres, the expected width of the bands under TMDC bilayers substantially exceeds the typical lateral size of our flakes, which we propose to be the reason for compactness of the observed wetting front under the TMDC bilayer covers.
Let us assume, indeed, that the difference in the width of the wetting pattern bands is dominated by the difference in the bending stiffness of the covering 2D sheets. Indeed, for example, the widths of the patterns under monolayer MoS2 and graphene bilayer are similar, as well as the reported values of the bending stiffnesses of both 2D sheets (from 2.6 to 5.8 eV for graphene bilayer [Citation32] and from 6.62 to 13.24 eV for MoS2 monolayer [Citation31]). The graphene bending stiffness has been shown to grow roughly linearly with the number of layers [Citation32]. Therefore, the width of the bands is expected to grow exponentially with the graphene thickness according to Equation (1). The dependency can indeed be well fitted with an exponential function (Figure (e)) supporting our assumption of 2D sheet bending stiffness as dominant controlling parameter of water wetting patterns.
The discussion above implies that the wetting by molecular liquids should be rather sensitive to the dipole density of the wetting film because of the quadratic dependence of the exponential factor on the dipole density in Equation (1). A transition from structured to unstructured wetting is expected to be achieved by reducing the dipole density by a factor of three considering that the same transition was observed for line tension reduction by an order of magnitude. To test this, we imaged wetting of the same interfaces with ethanol molecules. The molecules have been shown to become less ordered by the interface to compare with water, with the resulting dipole density being at least 50% smaller (see MD simulations below, and reference [Citation4]). The uncertainty is due to the possible presence of water molecules in the ethanol wetting film increasing the resulting dipole density. This suggests that ethanol wetting bands should be at least an order of magnitude wider to compare with water ones following Equation (1). To test the above prediction, we imaged wetting of graphene-mica and MoS2-mica interfaces with ethanol.
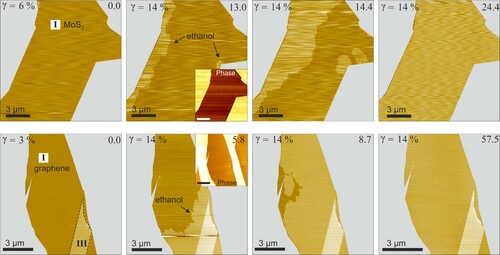
Figure shows the height and corresponding phase images of MoS2-mica and graphene-mica interfaces undergoing wetting by an ethanol film. The heights of ethanol wetting films are 3.4 ± 0.3 Å for all 2D covers we investigated. No wetting is observed for both interfaces when the relative vapour pressure of ethanol () is kept below a threshold of 14 ± 4%. Then, as
increases to 14 ± 4%, a homogeneous layer appears to grow from the edges for both types of interfaces within a minute. In both MoS2- and graphene interfaces, the ethanol film exhibits a compact layer. The wetting film in topography channel and its absence in the corresponding phase channel confirms that the layer grows under the 2D materials. That is, as with water, impermeability of the 2D cover materials to ethanol allows transport through the edges only. The result of unstructured wetting of graphene- and MoS2-mica interfaces with ethanol supports our model predictions.
Figure 3. Ethanol wetting kinetics: Relative vapour pressure of ethanol is shown top left of each image. Time in minutes is shown top-right. Roman numerals indicate the number of layers of the 2D materials. Top row (left to right): single-layer MoS2 on mica. Bottom row (left to right): single-layer graphene on mica. The MoS2 interface did not show any changes at
for 30 min. The graphene interface did not show any changes at
for 20 min. As
is increased to 14% a compact layer starts wetting the two interfaces from edges eventually forming a complete monolayer. Phase images (insets) show no change in contrast, suggesting the wetting film is under the 2D covers. In the bottom row sequence, wetting was halted by purging with dry nitrogen and subsequently resumed by increasing
again. Right-most image of graphene was acquired after wetting resumed. Completely wetted interfaces recover the ultra-flat topography. Bare mica areas are masked grey; images without the grey masks are shown in supporting information Figure S2.
While the threshold for ethanol wetting onset is comparable within the error to that of water wetting, wetting kinetics with the two liquids are different. The ethanol film fully wets the interfaces while is kept constant just above the wetting onset. That is, the wetting occurs within a narrow range of relative vapour pressure contrary to the case of water wetting where complete wetting occurs in the range 10%–25% relative humidity [Citation22]. Moreover, from onset to complete monolayer formation, ethanol film wets the interfaces faster compared to water. At relative vapour pressure between 15-20% water takes several hours to wet the interfaces of typical lateral size ∼10 µm. Whereas ethanol completely wets the interfaces within tens of minutes when
is kept about 1% above the wetting threshold. In a previous study, we attributed the slow wetting of water to a self-pinning mechanism [Citation22]. Edges of labyrinthine structures act as pinning sites. The absence of wetting patterns and of the self-pinning respectively explains the fast wetting with ethanol. That is, the fast propagation of ethanol wetting front can be attributed to its compactness – it does not cost any additional energy to move a line, while wetting by water creates complex labyrinthine pattern with the energy cost of additional boundaries.
MD simulations were performed in the NVT ensemble to rationalise the effect of the different molecular fillings and 2D covers on the dipole density of the molecular layers. We constructed different periodic boundary condition (PBC) interfaces consisting of a 6 × 9 × 1 mica supercell (54.78 × 47.44 × 20 Å) and commensurable 2D materials: one-layer graphene (1LG), two layers graphene (2LG), one-layer MoS2 (1L MoS2) and two layers MoS2 (2L MoS2). We filled out the four different slits with different quantities of water (SPC/E model [Citation33]) and a mixture of water and ethanol (TraPPE model [Citation34]). The Bussi-Donadio-Parrinello thermostat [Citation35], which assures a proper canonical ensemble by rescaling velocities including an stochastic term, was employed to keep the temperature at 300 K for all simulations.
From the MD trajectories, we calculated the total dipole moment of the molecular layer as the time average from the contribution of the individual dipoles,
, where
and
are the charges and positions at each simulation step, and the sum runs over all atomic species. The dipole density across the interface
is then obtained by dividing the
component of the total dipole by the Area
. Figure (a) shows the dipole density as a function of film thickness for different molecular fillings of PBC interfaces.
Figure 4. Dipole density for different molecular fillings of interfaces between mica and 2D materials, 1L and 2L of graphene and MoS2, as a function of film thickness (a). MD snapshots after 50 ns of MD simulations of the 2L MoS2-mica interface filled with water (b) and a mixture of ethanol and water molecules (c).
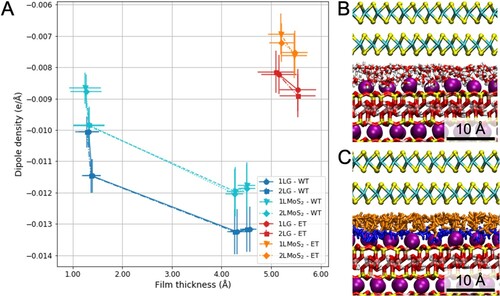
The number of water and ethanol molecules filing the interfaces follows the different experimental conditions. In the following, we are going to analyse the results in the case of an interface between mica and double layer MoS2. For the experimentally dry case, the water content amounts between 136 and 168 molecules (between 5 and 6.5 molecules/nm2) to account for water vapour contents of 1–10 ppm [Citation36]. Even those trace amounts might result in a significant amount of water molecules adsorbed on the highly hydrophilic surface of freshly cleaved mica. The adsorbed water is expected to be confined at the interface upon exfoliation of the 2D material. The amount of water adsorbed on a mica surface at very low water vapour pressures has been disputed. Classical atomistic simulations predict mica surface to be covered with roughly 5–6.5 water molecules per square nanometre in the presence of 1–10 ppm of water vapour [Citation36]. From experiments, on the other hand, it was concluded that smaller amounts of water adsorbed on mica under low humidity [Citation37,Citation38]. Thus, the interface at the lowest experimentally accessible humidity may contain any number of water molecules between zero and 6.5 molecules/nm2.
For the water-filled case, the water content lies between 456 and 520 molecules, which results in the lift of 2L MoS2 between 2.7 and 3.0 Å (see Figure (b)) [Citation22]. In this case, different water contents resulted in equal, within error, dipole densities. Hence, we report an average value of –0.0120 ± 0.0008 e/Å. The possibility of presence of water during ethanol wetting in experiments cannot be excluded. It is likely that water adsorbs between potassium ions on mica [Citation39–41]. Consequently, the experimentally ethanol-filled interface was simulated as a water–ethanol mixture containing 130 ethanol and between 129 and 163 water molecules which corresponds to a system saturated with ethanol at low relative humidity [Citation42]. This water–ethanol mixture lifts 2LMoS2 between 3.1 and 3.5 Å above the experimentally dry case as shown in Figure (c), matching our experimental results [Citation4]. The resulting dipole density for the interface filled with the water–ethanol mixture is –0.0074 ± 0.0007 e/Å. In this way, our MD simulations support our assumption on the smaller dipole density contribution in the experimentally ethanol wetting film in comparison with the water one by a square factor, , greater than two.
Summary
We present our findings on wetting of interfaces between mica and flexible 2D sheets with molecularly thin layers of water and ethanol. Our work explores the lateral morphology of wetting films and provides insight into their origins for the ubiquitous and fundamentally relevant liquids water and ethanol. Supported by experiments and MD simulations, we reveal that interplay of line tension and electrostatic repulsion induces labyrinthine morphologies in the wetting films. Moreover, we report a transition from laterally structured to compact layer morphology with change in line tension as well as with electrostatic repulsion. Our work builds a phenomenological framework for wetting film morphologies in flexible confinements. Such systems are common in molecular biology. Our findings are of significance for lubrication at interfaces where lubricity depends on the structure of intercalating layers.
Methodology
Experimental Procedures. Two-dimensional materials were deposited onto surface of freshly cleaved mica by mechanical exfoliation as described previously [Citation12,Citation13]. We emphasise that the exfoliation procedure involves no adhesive tape contacting the substrate since adhesives leave residues on substrate. Graphenes were mechanically exfoliated from HOPG (Mikromasch, ZYA grade) onto muscovite mica (Ratan mica Exports, V1 (optical quality)). MoS2 and WS2 layers were exfoliated from synthetic crystals (2D Semiconductors) by the same procedure used for graphene. The samples were prepared in the glove box (MBraun, LABmaster) filled with dry nitrogen (H2O content < 10 ppm, O2 content < 100 ppm), and first imaged with SFM within the same glove box. Then the SFM instrument with the sample mounted was transferred into an environmental chamber constructed within the same glove box. The chamber is subsequently sealed from the glovebox. The environmental chamber was filled initially with the dry nitrogen from the glove box, and then it was purged separately by the dry nitrogen bubbling through respective liquid. That is, the sample remained under controlled environment before and during the SFM imaging. Moreover, the sealed environmental chamber helped to keep the glovebox free of the water and ethanol vapour.
A Multimode SFM was operated in Tapping Mode using Olympus AC160TS cantilevers (nominal resonance frequency 300 kHz, typical spring constant 26 N/m). We measured the heights of wetting patterns on the images made with amplitude damping ratio of 0.8, i.e. rather small tip–surface force. The apparent heights of wetting films might reduce for larger damping ratios, i.e. larger forces, which has been attributed to the compliance of the soft molecular layers [Citation22]. Ethanol (Berkel AHK, 1511U) was transferred to gas-wash bottle under a stream of dry nitrogen to limit uptake of water from humid air. For water wetting experiments deionised water (Protegra CS Systems, CEDI Technology > 10 MOhm cm) was used. For the gas-mixing setup PTFE tubes (Rotilabo PTFE), and acetal couplings (CPC) were used. The environment control chamber (built in-house) inside the glovebox was constructed with polycarbonate.
Monolayers of graphene and MoS2 were ascertained after wetting by the shape of their Raman and fluorescence spectra, respectively, as described in previous works [Citation5]. The thickness of the multilayers was calculated from the overview SFM images containing both monolayers and multilayers. The number of the layers in graphene and MoS2 multilayers were calculated as the step height difference between the monolayers and multilayers divided by 3.4 and 6.4 Å respectively plus one. Relative vapour pressure of water and ethanol were controlled by purging the environment control box with nitrogen laden with water or ethanol vapour. The environment control box was constructed inside the glovebox. The setup allows preparation and imaging of the samples without exposure to the ambient environment. The gas is initially bubbled through the respective liquids and subsequently diluted with dry gas in controlled proportions. Relative humidity and temperature inside the environment control box were measured using a testo-625 thermo-hygrometer. In case of ethanol, nitrogen gas bubbling through ethanol was assumed to become saturated with ethanol vapour. It was further diluted with dry nitrogen to control ethanol vapour in the environment control chamber. Ethanol was placed in an ice bath to reduce its temperature to 3.0 ± 2°C and allow finer vapour pressure control.
Molecular Dynamics Simulations. MD simulations were performed using the 2020 version of the GROMACS simulation package [Citation43]. Temperature was kept at 300 K by using a velocity rescaling method [Citation35] and a time constant of 0.1 ps. A time step of 1 fs was used in all simulations. A distance cutoff of 15 Å was used to compute nonbonded interactions. Electrostatic interactions were calculated using the particle mesh Ewald (PME) method. The LINCS constrain algorithm [Citation44] was used to keep the bond distance where hydrogens are involved. Mica surface, KAl2(AlSi3O10)(OH)2, was simulated following the Clay force field [Citation45]. The long-range distribution of Si and Al on the tetrahedral sites of the mica slab is not periodic and the short-range ordering follows the Loewenstein Al-avoidance rule and the local balance of Al charges [Citation46]. The top and bottom layers of the mica slab are half filled with potassium ions, thus keeping charge neutrality and symmetry in the normal (z) direction. During the MD simulations, the lower oxygen atoms were constricted to move to prevent bending of the sheet. Graphene consisted of noncharged aromatic carbons of type CA [Citation47]. Interactions between water and graphitic carbons were modeled using the Lennard-Jones 12−6 potential using the interaction parameters developed by Wu et al. [Citation48]. For each intercalated molecular layer and 2D material, MD simulations in the NVT ensemble were performed. The first 5 ns was for equilibration, followed by 50 ns for production. Only the last 30 ns was used for production of the results shown here.
Supplementary Material
Download PDF (370.6 KB)Acknowledgements
A.R. acknowledges Mr Thorsten Rausche and Thomas Nowak for their support in constructing instrumentation used in this work.
Disclosure statement
No potential conflict of interest was reported by the author(s).
Correction Statement
This article has been republished with minor changes. These changes do not impact the academic content of the article.
Additional information
Funding
References
- A. Vilan and D. Cahen. Chem. Rev. 117, 4624–4666 (2017). doi:https://doi.org/10.1021/acs.chemrev.6b00746.
- Y. Wang, Z. Qin, M.J. Buehler and Z. Xu. Nat. Commun. 7, 12854 (2016). doi:https://doi.org/10.1038/ncomms12854.
- X. Cheng, Y. Y. Noh, J. Wang, M. Tello, J. Frisch, R. P. Blum, A. Vollmer, J.P. Rabe, N. Koch and H. Sirringhaus Adv. Funct. Mater. 19, 2407–2415 (2009). doi:https://doi.org/10.1002/adfm.200900315.
- H. Lin, J.D. Cojal González, N. Severin, I.M. Sokolov and J.P. Rabe. ACS Nano. 14, 11594–11604 (2020). doi:https://doi.org/10.1021/acsnano.0c04144.
- H. Lin, A. Rauf, N. Severin, I.M. Sokolov and J.P. Rabe. J. Colloid Interface Sci. 540, 142–147 (2019). doi:https://doi.org/10.1016/j.jcis.2018.12.089.
- R. Nouchi and T. Tanimoto. ACS Nano. 9, 7429–7439 (2015). doi:https://doi.org/10.1021/acsnano.5b02473.
- A. Schreiber, I. Kertelsen and G.H. Findenegg. Phys. Chem. Chem. Phys. 3, 1185–1195 (2001). doi:https://doi.org/10.1039/b010086m.
- M. Erko, D. Wallacher, G.H. Findenegg and O. Paris. J. Phys. Condens. Matter. 24, 284112 (2012). doi:https://doi.org/10.1088/0953-8984/24/28/284112.
- G.H. Findenegg, S. Jähnert, D. Akcakayiran and A. Schreiber. ChemPhysChem. 9, 2651–2659 (2008). doi:https://doi.org/10.1002/cphc.200800616.
- M. Erko, G.H. Findenegg, N. Cade, A.G. Michette and O. Paris. Phys. Rev. B. 84, 104205 (2011). doi:https://doi.org/10.1103/PhysRevB.84.104205.
- K. Xu, P. Cao and J.R. Heath. Science. 329, 1188–1191 (2010). doi:https://doi.org/10.1126/science.1192907.
- B. Rezania, M. Dorn, N. Severin and J.P. Rabe. J. Colloid Interface Sci. 407, 500–504 (2013). doi:https://doi.org/10.1016/j.jcis.2013.06.034.
- N. Severin, P. Lange, I.M. Sokolov and J.P. Rabe. Nano Lett. 12, 774–779 (2012). doi:https://doi.org/10.1021/nl2037358.
- P. Bampoulis, K. Sotthewes, E. Dollekamp and B. Poelsema. Surf. Sci. Rep. 73, 233–264 (2018). doi:https://doi.org/10.1016/j.surfrep.2018.09.001.
- S. Granick. Science. 253, 1374–1379 (1991). doi:https://doi.org/10.1126/science.253.5026.1374.
- Y.L. Chen, C.A. Helm and J.N. Israelachvili. J. Phys. Chem. 95, 10736–10747 (1991). doi:https://doi.org/10.1021/j100179a041.
- N. Severin, M. Dorn, A. Kalachev and J.P. Rabe. Nano Lett. 11, 2436–2439 (2011). doi:https://doi.org/10.1021/nl200846f.
- C.H. Lui, L. Liu, K.F. Mak, G.W. Flynn and T.F. Heinz. Nature. 462, 339–341 (2009). doi:https://doi.org/10.1038/nature08569.
- S. Hu, M. Lozada-Hidalgo, F. C. Wang, A. Mishchenko, F. Schedin, R. R. Nair, E. W. Hill, D. W. Boukhvalov, M. I. Katsnelson, R. A. W. Dryfe, I. V. Grigorieva, H. A. Wu and A. K. Geim Nature. 516, 227–230 (2014). doi:https://doi.org/10.1038/nature14015.
- J.S. Bunch, et al. Nano Lett. 8, 2458–2462 (2008). doi:https://doi.org/10.1021/nl801457b.
- P. Lange, M. Dorn, N. Severin, D.A. Vanden Bout and J.P. Rabe. J. Phys. Chem. C. 115, 23057–23061 (2011). doi:https://doi.org/10.1021/jp2081726.
- A. Rauf, A. Schilo, N. Severin, I.M. Sokolov and J.P. Rabe. Langmuir. 34, 15228–15237 (2018). doi:https://doi.org/10.1021/acs.langmuir.8b03182.
- H. Lin, A. Schilo, A. R. Kamoka, N. Severin, I. M. Sokolov and J. P. Rabe Phys. Rev. B. 95, 195414 (2017). doi:https://doi.org/10.1103/PhysRevB.95.195414.
- D. Andelman and R.E. Rosensweig. J. Phys. Chem. B. 113, 3785–3798 (2009). doi:https://doi.org/10.1021/jp807770n.
- D.J. Keller, H.M. McConnell and V.T. Moy. J. Phys. Chem. B. 90, 2311–2315 (1986). doi:https://doi.org/10.1021/j100402a012.
- J. Gienger, N. Severin, J.P. Rabe and I.M. Sokolov. Phys. Rev. E. 93, 043306 (2016). doi:https://doi.org/10.1103/PhysRevE.93.043306.
- E.J.G. Santos and E. Kaxiras. Nano Lett. 13, 898–902 (2013). doi:https://doi.org/10.1021/nl303611v.
- E.J.G. Santos and E. Kaxiras. ACS Nano. 7, 10741–10746 (2013). doi:https://doi.org/10.1021/nn403738b.
- S. Bertolazzi, J. Brivio and A. Kis. ACS Nano. 5, 9703–9709 (2011). doi:https://doi.org/10.1021/nn203879f.
- C. Lee, X. Wei, J.W. Kysar and J. Hone. Science. 321, 385–388 (2008). doi:https://doi.org/10.1126/science.1157996.
- G. Casillas, U. Santiago, H. Barrón, D. Alducin, A. Ponce and M. José-Yacamán J. Phys. Chem. C. 119, 710–715 (2015). doi:https://doi.org/10.1021/jp5093459.
- E. Han, J. Yu, E. Annevelink, J. Son, D.A. Kang, K. Watanabe, T. Taniguchi, E. Ertekin, P.Y. Huang and A. M. van der Zande Nat. Mater. 19, 305–309 (2020). doi:https://doi.org/10.1038/s41563-019-0529-7.
- H.J.C. Berendsen, J.R. Grigera and T.P. Straatsma. J. Phys. Chem. 91, 6269–6271 (1987). doi:https://doi.org/10.1021/j100308a038.
- B. Chen, J.J. Potoff and J.I. Siepmann. J. Phys. Chem. B. 105, 3093–3104 (2002). doi:https://doi.org/10.1021/jp003882x.
- G. Bussi, D. Donadio and M. Parrinello. J. Chem. Phys. 126, 014101 (2007). doi:https://doi.org/10.1063/1.2408420.
- A. Malani and K.G. Ayappa. J. Phys. Chem. B. 113, 1058–1067 (2009). doi:https://doi.org/10.1021/jp805730p.
- W. Cantrell and G.E. Ewing. J. Phys. Chem. B. 105, 5434–5439 (2001). doi:https://doi.org/10.1021/jp004305b.
- T.E. Balmer, H.K. Christenson, N.D. Spencer and M. Heuberger. Langmuir. 24, 1566–1569 (2008). doi:https://doi.org/10.1021/la702391m.
- K.T. He, J.D. Wood, G.P. Doidge, E. Pop and J.W. Lyding. Nano Lett. 12, 2665–2672 (2012). doi:https://doi.org/10.1021/nl202613t.
- O. Ochedowski, B.K. Bussmann and M. Schleberger. Sci. Rep. 4, 6003 (2014). doi:https://doi.org/10.1038/srep06003.
- E. Dollekamp, P. Bampoulis, M.H. Siekman, E.S. Kooij and H.J.W. Zandvliet. Langmuir. 35, 4886–4892 (2019). doi:https://doi.org/10.1021/acs.langmuir.9b00471.
- T. Cheng and H. Sun. J. Phys. Chem. C. 116, 16436–16446 (2012). doi:https://doi.org/10.1021/jp3020595.
- M.J. Abraham, T. Murtola, R. Schulz, S. Páll, J. C. Smith, B. Hess and E. Lindah SoftwareX . 1–2, 19–25 (2015). doi:https://doi.org/10.1016/j.softx.2015.06.001.
- B. Hess, H. Bekker, H.J.C. Berendsen and J.G.E.M. Fraaije. J. Comput. Chem. 18, 1463–1472 (1997). doi:https://doi.org/10.1002/(SICI)1096-987X(199709)18:12<1463::AID-JCC4>3.0.CO;2-H.
- R.T. Cygan, J.J. Liang and A.G. Kalinichev. J. Phys. Chem. B. 108, 1255–1266 (2004). doi:https://doi.org/10.1021/jp0363287.
- W. Loewenstein. Am. Mineral. 39, 92–96 (1954).
- A.D. MacKerell Jr, D. Bashford, M. Bellott, R. L. Dunbrack Jr, J. D. Evanseck, M. J. Field, S. Fischer, J. Gao, H. Guo, S. Ha, D. Joseph-McCarthy, L. Kuchnir, K. Kuczera, F. T. K. Lau, C. Mattos, S. Michnick, T. Ngo, D. T. Nguyen, B. Prodhom, W. E. Reiher Iii, B. Roux, M. Schlenkrich, J. C. Smith, R. Stote, J. Straub, M. Watanabe, J. Wiórkiewicz-Kuczera, D. Yin and M. Karplus J. Phys. Chem. B. 102, 3586–3616 (1998). doi:https://doi.org/10.1021/jp973084f.
- Y. Wu and N.R. Aluru. J. Phys. Chem. B. 117, 8802–8813 (2013). doi:https://doi.org/10.1021/jp402051t.