
 ?Mathematical formulae have been encoded as MathML and are displayed in this HTML version using MathJax in order to improve their display. Uncheck the box to turn MathJax off. This feature requires Javascript. Click on a formula to zoom.
ABSTRACT
The kinetics of N2 adsorption onto gas phase Rhi+ clusters (i = 5–15) within 26 K He buffer gas have been investigated by Fourier Transform Ion Cyclotron Resonance (FT-ICR) mass spectrometry, with particular focus to clusters i = 5,6,7,9. The adsorption limits m = mmax of [Rhi(N2)m]+ clusters strongly depend on the size of the clusters. Some Rhi+ clusters reveal an intermittent adsorption limit mx, which implies a rough cluster surface. Most of the clusters reveal smooth surfaces, which consist of Rh atoms with similar next neighbour coordination. The kinetic fits and relative rate constants reveal the sequential adsorption of N2 as the only significant reaction channel. In some cases, we find N2 desorption steps at high N2 loads indicating adsorption–desorption equilibria. For these steps, we determined Gibbs energies from the relative rate constants. We observed a significant reluctance towards N2 adsorption for the Rh5+ cluster, indicated by significant desorption at low N2 coverage. Our DFT calculations model the energetics of the N2 adsorption onto Rh5+ in terms of coverage dependent ‘spin valley’ curves, and we conclude that an adsorption induced spin quenching takes place upon considerable N2 coverage, m > 4.
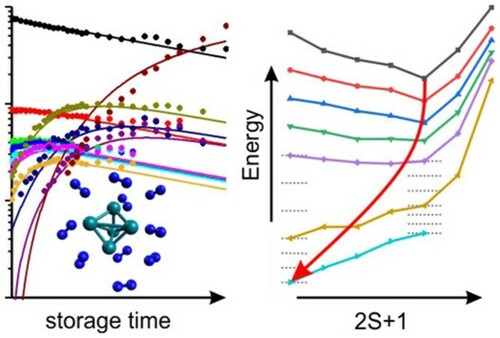
GRAPHICAL ABSTRACT
1. Introduction
Characterising surfaces at the molecular level. Throughout the last 90 years, adsorption behaviour of small molecules to solid surfaces has been serving to investigate the surface structure and existence of distinct surface sites. Brunauer, Emmett and Teller utilised N2 adsorption to gain information on active surface sites [Citation1], and Temperature Programmed Desorption (TPD) has become a routine method for surface analytics. In particular, N2 adsorption/desorption play a key role in metal surface analysis, and its adsorption kinetics became subject of fundamental research [Citation2–4]. Successively more elaborate techniques of surface analysis provided strong evidence for distinguishable N2 adsorption geometries on Fe surfaces [Citation5,Citation6].
Isolated clusters as model systems. Investigation of size selected clusters constructs a bridge between bulk surfaces and isolated atomic systems. In this regard, clusters may serve as model systems for the adsorbate–surface interaction. Studies of isolated metal cluster ions thus serve to elucidate elementary processes in catalysis [Citation6]. Mere atomic ions (or their oxides) are able to catalyse various elementary reactions of relevance to industrial catalysis [Citation7]. On the other side, the investigation of nanosized particles has led to the coinage of the term ‘nanocatalysis’ [Citation8]. In between of these extreme sizes – very small and very large – size selected clusters of less than 50 atoms have come into the focus of particular interest as model systems for active centres/sites in heterogeneous catalysts or as reactive species themselves [Citation9]. A multitude of studies and reviews has recognised the value of N2 adsorption for the characterisation of such size selected clusters throughout the last 30 years [Citation10–21].
Clusters and aliphatic hydrocarbons. It soon became a vivid field of research to investigate the kinetics of aliphatic hydrocarbon adsorption and activation on clusters [Citation22–26]. Most recently, attention was focused on the gas phase chemistry of size selected rhodium clusters, and we refer the reader to the collection of studies within a most exhaustive review [Citation27]. Several selected examples deserve explicit mentioning in the current context: It repeatedly emerged as a reaction motif that multiple CH activation steps occur through multiple consecutive oxidative additions, which are followed by reductive elimination of H2 from dihydride intermediate cluster species. These elementary steps were characterised by their kinetics, and they were found to be depend on the cluster size in an often-unpredictable manner, and charge state matters [Citation23,Citation26,Citation28–32].
Rh clusters and N2 adsorption. It is confirmed that N2 undergoes molecular adsorption to Rhn+ clusters under isothermal conditions [Citation33]. The efficiency of adiabatic N2 adsorption benefits from precooling of neutral Rhn clusters, and the sticking probability declines with reducing the number of rhodium atoms, even vanishing at n < 12 [Citation34]. Nitride and oxide products of rhodium clusters become readily available under hot conditions [Citation35,Citation36].
IR spectroscopy of rhodium clusters. IRMPD (infrared multiphoton dissociation) spectroscopy of [Rhn(CO)x]-/0/+ clusters revealed novel correlations: Observed CO stretching band shifts correlate with the size of the cluster core and are interpretated through a ‘charge dilution model’ [Citation37–40]. Subsequent IRMPD studies confirmed N2O reduction by Rh4-8+ clusters [Citation41]. Far-IR-MPD studies of naked Rh6-12+ clusters served to verify DFT model calculations that predicted tetrahedral and octahedral structures rather than cubic ones [Citation42]. This prediction found support through analogous findings for neutral and anionic clusters [Citation43].
Cluster surface morphologies. In the last years, we have successfully correlated results from IR spectroscopic and kinetic measurements as well as DFT modelling [Citation44–46] of nickel cluster cations and were able to identify several types of cluster surface morphologies as rough and smooth surfaces. Recently, we performed IR-PD (infrared photodissociation) measurements together with DFT modelling of [Rhi(N2)m]+ = (i,m) cluster adsorbate complexes. We assigned an octahedral structure for the Rh6+ cluster, a capped octahedron for the Rh7+ cluster and a tricapped trigonal prism to the Rh9+ cluster [Citation47]. Furthermore, we found evidence for adsorption induced relaxation of the cluster core for the (6,m) and the (7,m) cluster adsorbate complexes.
The structures of Rh5-,0,+ clusters have been subject of numerous investigations. DFT modelling of [Rh5(N2O)Ar]+ cluster complexes revealed a low energy difference of square-based pyramidal (sp) and trigonal bipyramidal (tbp) Rh5 motifs beyond a definite assignment [Citation41]. Other studies at various levels of theory report similar results on neutral and anionic rhodium clusters [Citation26,Citation43,Citation48–51]: There are low energy differences of nonet square pyramid and trigonal bipyramid isomers.
It is a recently emphasised question how coupled electronic surfaces enable metal ligand interactions and reactions through changes of spin multiplicities [Citation52]. Most notably J. Troe and co-workers analysed the reaction kinetics of such nonadiabatic processes involving Fe+ + NO, N2O, NO2, and FeO+ + CH4, H2, CO, NO [Citation53–58].
In the present study, we report and discuss the stepwise adsorption kinetics of N2 on Rhi+ clusters under isothermal cryo conditions, and we evaluate the recorded rate constants in the light of available kinetic models. We extract thermodynamic parameters, and we elucidate our findings in the light of concomitant DFT modelling. We find evidence for stepwise spin quenching by stepwise N2 adsorption, and we coin the concept of spin valley potential curves.
2. Experimental and theoretical methods
A customised 7 T Fourier Transform-Ion Cyclotron Resonance (FT-ICR)-mass spectrometer (Apex Ultra Bruker Daltonics) was used to perform the kinetics experiments. The second harmonic of a Nd:YAG laser (Innolas Spitlight 300, 20 Hz) was guided in the home-built laser vaporisation cluster ion source chamber as described before [Citation22,Citation59]. In brief, the laser beam is focused on a rotating Rh-target (99.8%, Alfa Aesar, 0.1 mm thick) and the resulting plasma is entrained in a helium gas pulse (40 µs, 10–15 bar). The gas pulse was generated by using a home-built piezoelectric valve [Citation60], operating in synchronisation with the laser at 20 Hz. In the subsequent jet expansion through a 69 mm long channel (2 mm diameter) into vacuum (10−7 mbar), the atoms and ions in the plasma cool down and aggregate to clusters. The cluster beam is skimmed and the clusters are guided through a 90 degree ion beam bender and a quadrupole mass filter, before they are stored into a cryogenic hexapole ion trap at 26 K. By a continuous gas inlet we introduce 3.0–3.1 · 10−7 mbar N2 and 3.0 · 10−6 mbar He into the cryo ion trap. After storing the cluster ions for a variable storage time (0–10 s), the ions are extracted and steered into the ICR-cell of the so called ‘infinity’ type [Citation61], using various electrostatic lenses. The ICR-cell is cooled down to 10 K by a closed cycle He cryostat to prevent heating of the clusters by black body radiation. For kinetic investigations of the reaction of Rhi+ clusters with N2, we isolate the parent ion in the quadrupole. The ICR-cell serves for the detection of the formed cluster adsorbate complexes [Rhi(N2)m]+. By analysis of the mass spectra at various reaction times and pseudo-first-order kinetic fits with the genetic algorithm program ‘evofit’ [Citation62] we obtain relative rate constants for each N2 adsorption step
+1, and
for each N2 desorption step
+1
alike:
The chosen nomenclature is in line with our previous publications. It is fully self-consistent, but might become a possible cause of misinterpretation. For the ease of comprehension the reader finds a short excerpt in the supplement, cf. Text S1.
Our thus determined adsorption rate constants are normalised to the experimental conditions of the [Rh7(N2)m]+ species (recorded at p(N2) = 3.0 · 10−7 mbar). The relative rate constants krel are transformed to absolute rate constants kabs, using the number density ) as conversion factor.
(1)
(1)
This number density is determined indirectly from the pressure in the surrounding chamber pc(300K) and an effective geometry factor capp.
(2)
(2)
The geometry factor capp reveals a significant temperature dependence. After numerous kinetic studies, we evaluated this factor to 1.8 at 26 K with an uncertainty of ± 50%. The ratios of the absolute rate constants to the collision rates yield the sticking probabilities :
(3)
(3)
We evaluated collision rates by three models:
The average dipole orientation theory [Citation63–66] (ADO) assumes a classical trajectory of a linear dipole in the field of a point charge:
(4)
In some cases, the measured reaction rates for charged metal clusters exceed the ADO collision rate [Citation29]. Kummerloewe and Beyer [Citation67] devised a ‘Hard Sphere Average dipole orientation’ (HSA) model. They determined collision rates of finite size ionic clusters with neutral molecules treating both as hard spheres, and assuming a point charge in the centre of the cluster. The attraction between point charge and the neutral reactant is represented by an ADO type interaction potential.
The alternative ‘Surface Charge Capture’ (SCC) model assumes an ideally conducting cluster instead. The point charge is free to move within the geometric boundaries of the cluster, and it interacts attractively with the neutral molecule, such that it migrates to the surface of the cluster. This model predicts significantly larger collision rates than ADO, and it is in good agreement with experimental rate constants. Even the SCC collision rates, however, are exceeded by experimental findings in some cases, for example in the reaction of Rhn± with CO [Citation67,Citation68].
The kinetic fits include N2 desorption whenever appropriate. With such desorption rates at hand, the according adsorption–desorption ratios of relative rate constants yield the equilibrium constant of the (m+1)th N2 adsorbate, k(i,m)/k-(i,m+1) = Km (Table S10), and its Gibbs free energy ΔadsG (Figure , Table S11). Where our fits include only negligible desorption or none, we set the value of their relative rate constants k-(i,m+1) to an upper limit of 0.001 s−1.
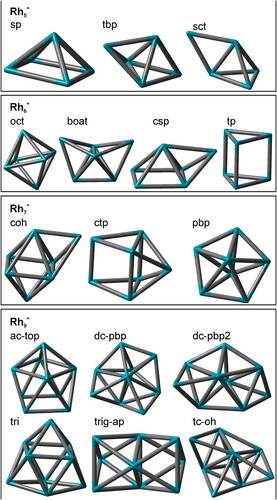
Quantum chemical modelling. Density functional modelling was performed by the Gaussian 09 package [Citation69]. We chose the PBE0/cc-pVTZ(N) level of theory [Citation70] and we utilise Stuttgart RSC 1997 ECP(Rh) basis sets of double zeta quality throughout [Citation71] as proven suitable before [Citation47]. We did not correct for dispersion effects, which we expect to be small. We do not consider spin orbit coupling which might alter some of our findings. We achieved convergence of our calculation only at the expense of a relaxed convergence criterion of only 10−6, which is well understood in terms of the exceedingly high electronic state density of transition metal clusters [Citation72]. We checked the obtained structures for imaginary frequencies. For low spin states and low N2 coverage, we obtained occasionally some spin contamination (cf. Table S19) that is denoted throughout the documentation of results whenever significant. We present a set of conceivable Rhi+, i = 5,6,7, and 9, cluster core structures in Figure .
3. Results and discussion
3.1. The limits of N2 adsorption and its dependencies on the cluster size
We have investigated the cryo adsorption of N2 to a selected subset of [Rhi(N2)m]+ clusters – abbreviated as (i,m) – in the range of i = 5, … ,15 by recording their cryogenic mass spectra and their storage time-dependent product distributions under isothermal conditions at 26 K. Together with the corresponding kinetic fits these data are presented in the supplementary information to this paper (cf. SI Figures S1–S9). Here, we want to present and discuss two archetypical examples in more depth, namely the temporal evolution (t = 0–5 s) of [Rh6(N2)m]+ and [Rh9(N2)m]+ intensities by exposure to ∼ 3.0 · 10−7 mbar N2 (Figure ). The N2 adsorptions of these clusters demonstrate key features, which are representative for other investigated clusters as well. Starting from the bare rhodium cluster, the temporal evolution of the mass spectra reveal a successive increase of 28 m/z. This indicates the adsorption of molecular N2. For all cluster sizes studied, an apparently dominating, sequential adsorption of N2 to the clusters takes place:
Inspection of the recorded mass spectra does not reveal any evidence for further reactions. Later on – invoking explicit kinetic fits – we will find evidence for N2 desorption in some cases.
Figure 1. Temporal evolution of the FT-ICR mass spectra of Rh6+ and Rh9+ exposed to 3.0 · 10−7 mbar and 3.1 · 10−7mbar N2 at a temperature of 26 K at various storage times in the cryogenic hexapole ion trap. Note that the N2 adsorption stops after the uptake of 12 and 9 N2, respectively. m/z on the abscissa represents the ‘mass-to charge number ratio’ where the symbol m stands for a dimensionless mass with this symbol m = mass/u.
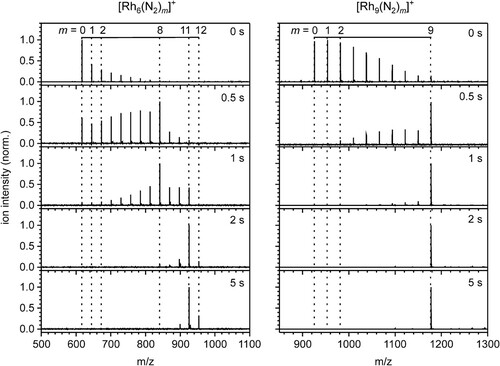
The two clusters (6,m) and (9,m) reveal a stepwise N2 uptake up to strict adsorption limits mmax. These limits mark some points of saturation. Thus, the largest observable clusters are (6,12) and (9,9), respectively. We find a corresponding adsorption limit in all of our recorded spectra of (i,m) clusters (i = 5, … ,15). Closer inspection of the mass spectra reveals subtle details: In the case of (6,m), we observe an N2 adsorbate, namely (6,8), which reacts slower to consecutive N2-species. This causes some retardation, but does not suppress further N2 adsorption. We define this as an intermittent adsorption limit/level mx. In the case of (9,m), there is a sole N2 adsorption limit mmax at m = 9 and no intermittent adsorption limit.
A compilation of the mmax and the mx values for each studied cluster core Rhi+ (Figure ) reveals adsorption limits of i ≤ mmax ≤ 2i with remarkable fluctuations. For the Rh5+ and Rh6+ clusters the found mmax / i ratio is 2; for Rh7+ and beyond there is a decrease of observed ratios towards as low as mmax/i = 1.2 for Rh15+.
Figure 2. The recorded adsorption limits mmax (purple circles) and the intermittent adsorption limits mx (purple stars) of N2 adsorbates to Rhi+-clusters (in colour only in electronic format). The grey lines indicate adsorbate to cluster size ratios of m: i = (1: 1), (2: 1), namely a monolayer and a double occupation of all rhodium atoms, respectively [Citation47]. Note that in correction to the previous publication ([Citation47], Figure S1 therein), we assign an intermittent adsorption limit (5,7) at m = 7 to the [Rh5(N2)m]+ cluster that is clearly supported by the present kinetic investigations.
![Figure 2. The recorded adsorption limits mmax (purple circles) and the intermittent adsorption limits mx (purple stars) of N2 adsorbates to Rhi+-clusters (in colour only in electronic format). The grey lines indicate adsorbate to cluster size ratios of m: i = (1: 1), (2: 1), namely a monolayer and a double occupation of all rhodium atoms, respectively [Citation47]. Note that in correction to the previous publication ([Citation47], Figure S1 therein), we assign an intermittent adsorption limit (5,7) at m = 7 to the [Rh5(N2)m]+ cluster that is clearly supported by the present kinetic investigations.](/cms/asset/5c9b20b4-e7fb-44af-8640-5d749c2765d7/tmph_a_1953172_f0002_oc.jpg)
The Rh9+ cluster shows adsorption up to mmax = 9 – an mmax/i ratio of 1 – and reveals no mx. Such intermittent adsorption limits mx < mmax are observed merely in the cases of Rh5+, Rh6+, Rh7+ and Rh15+, namely (5,7), (6,8), (7,10), and (15,13).
We expect small clusters (i ≤ 12) to consist exclusively of easily accessible surface atoms. One can imagine a limit of a single adsorbate monolayer with twofold occupation of all Rh atoms. Indeed, the Rh atoms of the clusters i < 7 tend to prefer such double adsorbate occupation. Intermediate clusters 7 ≤ i ≤ 12 may provide for some higher coordinated and therefore less accessible surface atoms that can only adsorb one N2. Rh13+ and larger clusters do possess one or more inner Rh atoms, which are completely surrounded by other Rh (surface) atoms, and which become thus inaccessible for exterior adsorbates.
In the following discussion, we will find that clusters without an intermittent adsorption limit mx reveal a smooth cluster surface, which holds true in most cases. More precisely these are the cases of i = 8, … ,14. There are just four clusters, where an intermittent adsorption limit mx occurs, which are i = 5, 6, 7 and 15. We will regard these as clusters with rough surfaces.
3.2. Adsorption kinetics and rate constants
We further investigated the stepwise N2 adsorption onto selected Rhi+ clusters at 26 K by recording their adsorption kinetics in more detail. By assuming pseudo-first-order kinetics, it is possible to fit the temporal evolution of kinetic data with our genetic algorithm routine. This confirms consecutive N2 adsorption steps. All of our investigated Rhi+ clusters decay mono exponentially without any indication of a second component or isomer. From this and the good overall quality of these fits, it is possible to extract a single relative stepwise rate constant for each consecutive adsorption and for each desorption step of N2. We present relative values at this point, with relative uncertainties of as low as ±20%. Conversion to absolute rate constants by pressure normalisation does imply considerable absolute uncertainties of almost one order of magnitude. For these absolute values, refer to the supplement (Table S5). In the following, we will compare and discuss the recorded kinetic fits and the obtained rate constants for the selected clusters Rh5+, Rh6+, Rh7+, and Rh9+ in detail. The kinetic data of the other investigated clusters are provided in the supplementary material.
Our kinetic data confirm what we found by mass spectra at long storage times: The kinetic curves of Rh5+ (Figure (a)), Rh6+ (Figure (b)), Rh7+ (Figure (a)) and Rh9+ (Figure (b)) reveal adsorption limits mmax = 10, 12, 13, and 9, respectively. The kinetic curves of Rh5+, Rh6+, and Rh7+ reveal intermittent adsorption limits at mx = 7, mx = 8 and mx = 10, respectively. In effect, we find strong support for the identification of Rh9+ as a cluster with an all smooth surface. Rh5+ and Rh6+ behave like clusters with rough surfaces, they possess preferred and less preferred adsorption sites which shows in the kinetic curves. The Rh7+ falls somewhat in between; it behaves like a largely smooth surface with some but limited roughness – likely through some low coordinated surface atom.
Figure 3. Isothermal kinetics of the stepwise N2 adsorption at 26 K (a) by isolated Rh5+ clusters and (b) by isolated Rh6+ clusters (solid symbols, in colour only in electronic format). The fits (solid lines) assume pseudo-first-order kinetics in an adsorption chain of up to 10 consecutive steps for Rh5+ and up to 12 for Rh6+ clusters. Fitted values of relative rate constants (c) of Rh5+ and (d) of Rh6+ for the adsorption (k(i,m), black filled circles) and the desorption (k-(i,m+1), green open circles) as a function of the stepwise N2 adsorption (level m). The grey shaded areas indicate the approximate background noise level. Values of 0.001 s−1 represent an upper limit. Rate constants k(5,10) and k(6,12) are at the noise level and indicate an adsorption limit.
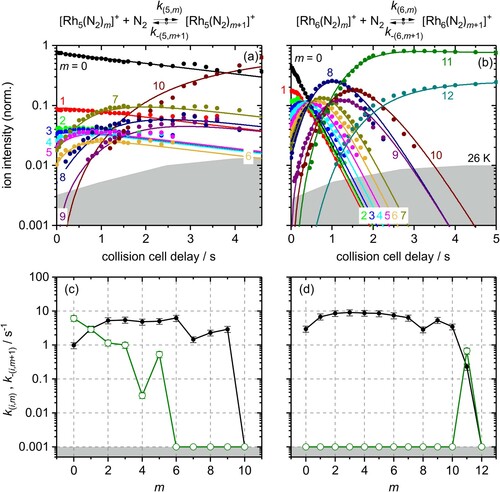
Figure 4. Isothermal kinetics of the stepwise N2 adsorption at 26 K (a) by isolated Rh7+ clusters and (b) by isolated Rh9+ clusters (solid symbols, in colour only in electronic format). The fits (solid lines) assume pseudo-first-order kinetics in an adsorption chain of up to 13 consecutive steps for Rh7+ and up to 9 for Rh9+ clusters. Fitted values of relative rate constants (c) of Rh7+ and (d) of Rh9+ for the adsorption (k(i,m), black filled circles) and the desorption (k-(i,m+1), green open circles) as a function of the stepwise N2 adsorption level m. Values of 0.001 s−1 represent an upper limit. The grey shaded areas indicate the approximate background noise level. Rate constants k(7,13) and k(9,9) are at the noise level and indicate an adsorption limit.
The Rh5+ case seems special as the N2 uptake is overall slower than in all other cases. A closer look at the values of the fitted rate constants may help to understand.
Relative rate constants. Next, we take a more detailed look at the rate constants of each adsorption and desorption step for the selected clusters Rh5+ (Figure (c)), Rh6+ (Figure (d)), Rh7+ (Figure (c)), and Rh9+ (Figure (d)). At first glance we see that the three sets of N2 adsorption rate constants of Rh5+, Rh6+ and Rh7+ show some step like decline towards k(5,7), k(6,8) and k(7,10), respectively. Rh9+ does not. N2 desorption is specific by the size of the cluster.
Rh5+– N2 adsorption. The relative rate constants of N2 adsorption to the Rh5+ cluster increase in the range m = 0–2 by almost a factor of 6. The first adsorption step k(5,0) is rate limiting, and all subsequent steps k(5,m) are faster. For m = 2, … ,6 they are more or less constant; this is within error margins between 4.8 and 6.2 s−1 (Figure (c)). There is a steep decline at the intermittent adsorption limit mx = 7: The rate constants diminish by a factor of 4.2 from k(5,6) to k(5,7). The rate constants k(5,8) and k(5,9) increase slightly, up to a value of k(5,9) = 2.9 s−1. Thus, there is a remarkably slow uptake of the first and of the seventh N2 adsorbate.
Rh5+– N2 desorption. We emphasise a particularly noteworthy outcome of the kinetic fits of our recorded data in the case of Rh5+: There is a significant amount of N2 desorption, k-(5,1) through k-(5,5), which we do not observe in any of the other investigated cases, [Rhi(N2)m]+, i = 6, … ,15. Note that the N2 desorption off [Rh5(N2)1]+, k-(5,1) = 6.1 s−1, is much faster than the N2 adsorption onto Rh5+, k(5,0) = 0.97 s−1. In order to balance it would take six times higher N2 partial pressures than applied.
The subsequent desorption steps slow down, and [Rh5(N2)7]+ does not desorb at all, with a stated upper limit of k-(5,m>5) < 0.001 s−1. The fits indicate even lower values, e.g. k–(5,6) < 8 · 10−7 s–1. The kinetic fit quality of the Rh5+ cluster is not satisfactory at short and long storage times. An analysis of a reduced data set from storage times of 0.2–2.6 s (cf. Figure S2) allows for a kinetic fit with an improved quality, that yields reasonably similar rate constants as before.
In summary, the genetic algorithm modelling of Rh5+ + N2 kinetics yields a pronounced desorption and thus an equilibrium for the first adsorption step and the subsequent steps up to m = 5. With an equilibrium constant of 0.16, the equilibrium (5,0) & Equilibrium; (5,1) is clearly on the reactant side (cf. Tables S7 and S10). The bare Rh5+ cluster seems reluctant against adsorption of a first N2 molecule. The intermittent adsorption limit at mx = 7 may be a first hint towards a trigonal bipyramidal tbp (cf. Figure ) structure with a single N2 molecule at each of the three equatorial Rh atoms and two N2 adsorbates at each of the two apical Rh atoms. This core structure leads to higher coordination of Rh atoms (18 Rh-Rh next neighbour interactions, an average coordination number of 3.6, cf. Table S19) than a square pyramid sp would do (16 Rh-Rh next neighbour interactions, an average coordination number of 3.2). Moreover, the adsorption limit mmax = 10 is nicely rationalised by a trigonal bipyramid structure: It makes up for two geminal N2 per Rh atom.
Figure 5. A selection of conceivable Rhi+, i = 5,6,7, and 9, cluster core structures. The number of next neighbours and average coordination numbers for Rh atoms in the clusters are given in Table S16.
Rh6+– N2 adsorption. The relative rate constants of N2 adsorption to the Rh6+ cluster increase in the range m = 0–2 by almost a factor of three (Figure (d)). The increase, however, is less than in the case of the Rh5+ cluster. We find very similar rate constants, k(6,m) ∼ 7.5 s–1, for the subsequent N2 adsorption steps m = 2, … ,7. Up to m = 7, the first step, k(6,0), is rate limiting for all of the subsequent adsorptions. Beyond the intermittent adsorption limit mx = 8 the rate constants k(6,8), k(6,9), and k(6,10) diminish by a factor of 2.2 (cf. Table S2). This drop corresponds to a similar drop in the case of Rh5+, but smaller by almost a factor of two. The subsequent adsorption of a 12th N2 molecule, k(6,11) = 0.23 s−1 proceeds more than an order of magnitude slower than any of the previous adsorption steps, and it is in equilibrium with desorption, likely indicating saturation. The overall average of N2 adsorption rate constants of Rh6+ is higher by almost a factor of two compared to those of the Rh5+ cluster (cf. Table S2).
The intermittent adsorption limit at (6,8) is somewhat in contrast to our previous computational results. The then predicted, highly symmetric octahedral cluster structure would rather suggest an intermittent adsorption limit at mx = 6, or even a Langmuir type saturation limit mmax = 6 [Citation47]. Instead, the presently determined intermittent adsorption limit mx = 8 rather fits to a structure that comprises two Rh atoms of enhanced propensity of e.g. twofold N2 uptake. It is conceivable to find such behaviour upon lower Rh-Rh next neighbour coordination. We can imagine obtaining such coordination motifs by distortion of an octahedral oct structure towards a boat like structure boat (cf. Figure ).
Rh6+– N2 desorption. In contrast to the Rh5+ cluster, our fits of the Rh6+ - N2 kinetics do not reveal any N2 desorption but for the last step k-(6,12) = 0.67 s−1. This N2 desorption off (6,12) is faster by a factor of 2.9 than the N2 adsorption onto (6,11). Thus, the adsorption–desorption equilibrium constant is 0.34 (cf. Tables S7 and S10).
At saturation (maximum adsorption limit (6,12)) all Rh centres are doubly occupied by geminal N2. One of these N2 is only loosely bound and the equilibrium is on the (6,11) side. We acknowledge the possibility that the observed adsorption–desorption equilibrium may involve an isomerisation of the adsorbate shell, and we note in passing that some of our exploratory DFT calculations have revealed indication of such N2 adsorbate shell reorganisation before [Citation47].
The Rh6+ cluster surface seems smoother than that of Rh5+. Swift N2 stabilisation is possible without risk of desorption. We have no indication of major electronic effects or relaxation. Saturation load seems in equilibrium with single desorption. Geminal N2 occupation of single Rh centres seems ubiquitous.
Rh7+– N2 adsorption. The relative adsorption rate constants of the Rh7+ cluster of the consecutive steps m = 0, … ,9 are roughly constant around k(6,m) ∼ 8.5 s−1 (Figure (c)). In contrast to Rh5+ and Rh6+, we obtain no initial increase of the rate constants and no clearly rate limiting step up to k(7,10). Similar to Rh5+ and Rh6+, beyond the intermittent adsorption limit mx = 10 the rate constants diminish by a factor of 1.4 from k(7,9) to k(7,10) (cf. Table S2).
Obviously, the step height of the drop at the intermittent adsorption limit decreases with increasing number of metal atoms i through i = 5, … ,7. The values of the rate constants are in the same range as for Rh6+, thus higher than for Rh5+. The final adsorption of a 13th N2 molecule is slower by at least a factor of almost two, k(7,12) = 2.8 s−1, compared to all previous adsorption steps.
Rh7+– N2 desorption. As for the Rh6+ cluster, our fit reveals desorption only for the last step k–(7,13) = 2.6 s−1, and for the second but last desorption step an insignificantly low rate constant k-(7,12) = 6.0 · 10−7 s−1 which is far below our upper accuracy limit of 0.001 s−1 (cf. Table S7). Thus, the final adsorption–desorption equilibrium involves a single N2 molecule. The desorption off (7,13) is essentially as fast as N2 adsorption onto (7,12) with an equilibrium constant K(7,12) = 1.1 (cf. Tables S7 and S10).
At saturation (maximum adsorption limit mmax = 13) each Rh centre but one is doubly occupied by a geminal N2 pair. In the course of our previous work, we have managed to assign a capped octahedron coh structure (cf. Figure ) for the (7,12) clusters by reference to recorded IR spectra. There are geminal N2 pairs at all but two Rh centres, and single N2 ligands on two highly coordinated Rh centres: one Rh centre with four and one with five Rh-Rh next neighbour contacts [Citation47] (cf. Table S16). As for the previous Rh6+ case, the adsorption–desorption equilibrium may come about with adsorbate shell isomerisation.
Rh9+– N2 adsorption/desorption. The N2 adsorption–desorption cryo kinetics of Rh9+ are particularly noteworthy in two regards: Firstly, all rate constants are roughly equal, k(9,m) ∼ 8.5 s−1 (Figure (d)), and there is neither an intermittent limit nor a decline towards saturation at mmax = 9. Secondly, this low value of saturation is in remarkable contrast to the found values mmax = 12 of Rh8+ and mmax = 15 of Rh10+, (8,12) and (10,15), cf. Figure , and Figures S3 and S4. All adsorption sites of Rh9+ seem equivalent, which points towards a smooth cluster surface. Thirdly, Rh9+ runs into mmax = 9 without indication of any N2 desorption whatsoever – not even at saturation.
The observation of a swift adsorption process and thus a high equivalence of the adsorption sites is in line with our earlier IR results: We have observed merely one strong IR band for all of the nine N2 oscillators in the previously reported IR spectrum of (9,9) [Citation47], which emphasises the similarity of the N2 oscillators and the seeming equivalence of their locations on the cluster surface. This is remarkable in view of the non-equivalence of Rh atoms in any of the identified Rh9+ structures, cf. Table S16 and Figure . Differences in next neighbour coordination prevail.
Intermittent limits and cluster surface roughness. All together, when inspecting the relative rate constants of the chosen clusters i = 5,6,7, and 9 in detail, we evoke the following conclusions: The drop of rate constants at the intermittent adsorption limits (5,7), (6,8), and (7,10) indicates a particularly slow adsorption step for Rh5+, Rh6+, and Rh7+ at mx = 7, 8, 10, respectively. Thus the eighth, ninth, or eleventh N2 molecule adsorbs more slowly than any of the previous ones to Rh5+, Rh6+, or Rh7+. We imagine that at this point, each Rh atom has accepted at least one single N2 molecule, and the most accessible Rh atoms might accept a geminal N2 pair. The following adsorption steps would take place at less accessible Rh sites, probably those with a higher number of Rh-Rh next neighbours, and thus these steps become slower.
In terms of this interpretation, the observed kinetic drops arise from the presence of at least two essentially different types of adsorption sites on the cluster surfaces. The depths of the kinetic drops seem to indicate the inaccessibility of the corresponding N2 adsorption site. Previously, we have interpreted the existence of a variety of distinct adsorption sites as an indication for rough cluster surfaces [Citation44–46]. A decrease of the magnitude of such a drop indicates that the different adsorption sites become increasingly similar. For Rh9+ (as well as Rh8+ and Rh10+) we do not observe any drop at all. Along with the increase of the number of metal atoms, we expect that the average next neighbour coordination numbers increase such that the amount of atoms with low coordination numbers diminishes. In total, the properties of the surface atoms unify, they are practically similar; the cluster surface becomes more and more smooth.
All of these observations and their interpretation indicate: The Rh5+ cluster is rough all over its surface and Rh6+and Rh7+ are less rough and more smooth – utilising a nomenclature as introduced by our previous study of somewhat larger nickel clusters[Citation44–46]. The average coordination numbers of the Rh atoms increase for the conceivable isomers with the increasing number of metal atoms (cf. Table S16 and Figure ). Rh8+ and Rh10+ are similar to the case of Rh9+ (cf. supplement Figures S3, S4 and Table S2) in terms of their smooth cluster surface. Both are accepting large amounts of geminal N2 loads, however, which is in remarkable contrast to the Rh9+ case that strictly supports only single N2 molecule per surface atom.
Equilibria and thermochemistry. As postulated earlier [Citation47], the equilibrium between the last and second last adsorption step on the Rh6+ and the Rh7+ clusters may arise from two different isomers. These isomers may easily interconvert, preliminary calculations revealing a lower limit of the single N2 adsorption enthalpies of −50 kJ/mol as compared to −56 kJ/mol for stepped Rh surfaces [Citation73,Citation74].
We expect the cluster N2 binding energies to decline with N2 load; in case of observed equilibrium the last adsorption step is necessarily close to thermoneutral. Thus, the final N2 is very weakly bound, maybe roaming or side-on. Both cases are more likely at higher coordinated Rh centres and / or in cases of geminal N2 adsorptions. Calculations on (5,m) m = 0, … ,3 indeed indicate decreasing adsorption energies for the first three adsorption steps starting from −65 kJ/mol.
Our calculated (5,0), (5,1) and (5,7) structures (cf. chapter 3.4 in the following) as well as the obtained N2 adsorption energies depend on the spin state of the clusters. We obtained values of adsorption energies around −65 kJ/mol up to m = 6.
Absolute rate constants for the first adsorption steps. From the relative rate constants, we obtain, by Equation (1), absolute rate constants in the range of 0.1–30 · 10−10 cm3s−1. These values compare favourably with published values of related systems: For example, the reactions Rhi± + N2O proceed with absolute rate constants of 0.02–10 · 10−10 cm3s-1 [Citation75] and those of Rhi± + CO with 0.05–11 · 10−10 cm3s-1 [Citation68].
In general, we observe a gradual increase of the rate constants with increasing number of metal atoms in the cluster core i. This is commonly observed in reactions of metal clusters with small molecules, as for example the reaction of Rhi+ clusters with CO [Citation68] as well as the adsorption of N2 on Ni clusters [Citation44].
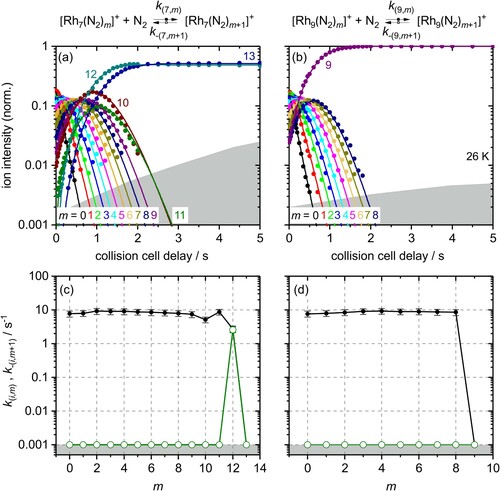
We focus on this finding by discussing the first N2 adsorption step in more detail (Figure ). There is a steep increase of adsorption rate constants with the number of rhodium atoms up to i = 7, followed by a much shallower increase above. A likely explanation for the initial steep rise of the first step rates with increasing size of the cluster core is an increase of heat capacity and thus more effective redistribution of the released N2 adsorption energy into the internal heat bath with the increasing number of metal atoms [Citation68]. Otherwise, desorption rates would remain high. This steep increase reflects also in the sticking probabilities of Rh5+ to Rh7+ (Tables ; Figures S10 and Table S6 in the supplement). Previous studies revealed the steep rise before: Zakin et al. also observed an increase of reaction rates for Rhi0 clusters around i = 5 [Citation36]. Anderson et al. found an increase of sticking probabilities for i > 12 for Rhi0 clusters at liquid N2 temperatures without effective thermalising of the clusters [Citation34].
Figure 6. Experimental absolute rate constants for the first adsorption step of Rhi+ with N2 (filled squares) compared to classical Langevin collision rates kcoll (solid line), the ‘Surface Charge Capture model’ kSCC (dashed line), and the ‘Hard Sphere Average dipole orientation model’ kHSA (open circles) [Citation67].
![Figure 6. Experimental absolute rate constants for the first adsorption step of Rhi+ with N2 (filled squares) compared to classical Langevin collision rates kcoll (solid line), the ‘Surface Charge Capture model’ kSCC (dashed line), and the ‘Hard Sphere Average dipole orientation model’ kHSA (open circles) [Citation67].](/cms/asset/d6ba9925-b21e-4e2d-a81e-087f10fcae30/tmph_a_1953172_f0006_ob.jpg)
The shallow rise in adsorption rates kabs through i = 7, … ,15 seems to correlate with the geometric size of the cluster and its concomitant collision cross section. We compare our experimental absolute rate constants of the first N2 adsorption step with the calculated Langevin collision rate kcoll, the ‘Surface Charge Capture Model’ kSCC and the ‘Hard Sphere Average Dipole Orientation Model’ kHSA from Kummerloewe and Beyer [Citation67] (cf. Figure and Table S15). The kcoll and kHSA values coincide under the present conditions and fit quite well the experimental rate constants in the range from i = 7–15. A slight enhancement by the effects of the HSA model may contribute on top. The adsorption rate of i = 5,6 clusters is reduced with respect to collision rate. Seemingly, the adsorption energy fails to redistribute in the cases of these small clusters, and the hot adsorbate complexes undergo desorption towards separate reactants by considerable amounts.
Subsequent stepwise N2 adsorption. The trend of the relative and the absolute rate constants with increasing surface occupation is similar (Tables ): The rate constants are high at the beginning, when the N2 adsorption starts, implying that the adsorption proceeds fast. Upon subsequent adsorption steps, when the cluster surface coverage is significant, the adsorption rate constants reduce. We observe significant desorption rates in the cases of the [Rh6(N2)12]+ and [Rh7(N2)13]+ cluster adsorbate complexes leading to an equilibrium between two isomers, as explained earlier.
Table 1. Relative pseudo-first-order rate constants, absolute rate constants, collision rates and sticking probabilities for the N2 adsorption on [Rh5(N2)m]+ clusters. The γ(5,m) values are calculated by Equation (3). The relative errors are 20% for k(5,m) and 40% for kabs and γ(5,m). The kcoll values are theoretically determined.
Table 2. Relative pseudo-first-order rate constants, absolute rate constants, collision rates and sticking probabilities for the N2 adsorption on [Rh6(N2)m]+ clusters. The γ(6,m) values are calculated by Equation (3). The relative errors are 20% for k(6,m) and 40% for kabs and γ(6,m). The kcoll values are theoretically determined.
Table 3. Relative pseudo-first-order rate constants, absolute rate constants, collision rates and sticking probabilities for the N2 adsorption on [Rh7(N2)m]+ clusters. The γ(7,m) values are calculated by Equation (3). The relative errors are 20% for k(7,m) and 40% for kabs and γ(7,m). The kcoll values are theoretically determined.
Table 4. Relative pseudo-first-order rate constants, absolute rate constants, collision rates and sticking probabilities for the N2 adsorption on [Rh9(N2)m]+ clusters. The γ(9,m) values are calculated by Equation (3). The relative errors are 20% for k(9,m) and 40% for kabs and γ(9,m). The kcoll values are theoretically determined.
3.3. The Gibbs energies
We have included N2 desorption steps into our kinetic fits whenever these steps improved the quality of fits – namely their χ2 values – in a significant way. As a matter of fact, whenever invoked, these desorption steps were inevitable in order to achieve a fit of acceptable quality at all. Such desorption rates at hand, the according adsorption–desorption ratios of relative rate constants yield the equilibrium constant of the mth N2 adsorbate with the (m + 1)th N2 adsorbate, k(i,m)/k-(i,m+1) =: Km (Table S10), and its Gibbs free energy : = –RT ln Km (Figure , Table S11). Whenever our fits reveal negligible desorption, we set the corresponding rate constants k-(i,m+1) to an upper limit of 0.001 s−1. We assume an according upper limit for the non-observable adsorption step k(i,max).
Figure 7. Plot of Gibbs energies for the equilibria of N2 adsorption onto [Rhi(N2)m]+ / desorption off [Rhi(N2)m+1]+. Note that the
values within the light blue plateau signify upper limits of otherwise unknown values (in colour only in electronic format). The last depicted step formally relates to the equilibrium of mmax with mmax+1. The positive Gibbs energies signify the last adsorption step towards mmax, with the only exception of Rh5+. Its initial N2 adsorption is hindered, and its subsequent steps become more spontaneous. [Rhi(N2)m]+, i = 8, … , 10 possess all negative
values but mmax. The grey area signifies non-occurring processes.
![Figure 7. Plot of Gibbs energies ΔadsG(i,m)26 K for the equilibria of N2 adsorption onto [Rhi(N2)m]+ / desorption off [Rhi(N2)m+1]+. Note that the ΔadsG(i,m)26 K values within the light blue plateau signify upper limits of otherwise unknown values (in colour only in electronic format). The last depicted step formally relates to the equilibrium of mmax with mmax+1. The positive Gibbs energies signify the last adsorption step towards mmax, with the only exception of Rh5+. Its initial N2 adsorption is hindered, and its subsequent steps become more spontaneous. [Rhi(N2)m]+, i = 8, … , 10 possess all negative ΔadsG(i,m)26 K values but mmax. The grey area signifies non-occurring processes.](/cms/asset/a7e5387b-a9ec-4aa1-98e7-ef218ead43d9/tmph_a_1953172_f0007_oc.jpg)
In the cases of stepwise adsorption without observable desorption, k-(i,m+1) < 0.001 s−1, our Gibbs energies take the value of an upper limit, ≤ –1.7 kJ/mol (cf. Figure and Table S11). Note that we utilise upper limits for rate constants of the not observed desorption steps.
Beyond the general trend of an increase of total N2 load (discussed above), we observe three ‘features of reluctance’ deserving special attention:
The low total N2 load of Rh9+
The N2 adsorption reluctance of high N2 loaded Rh13+ and Rh14+. Please note that Rh13+ and Rh14+ show the discussed special behaviour (cf. Figure ), and Rh12+ and Rh15+ do not!
The N2 adsorption reluctance of naked and low N2 loaded Rh5+
Case (a) is not a kinetic or dynamic effect, but relates to a static or structural uptake limit, namely the stoichiometric 1:1 adsorption limit mmax (cf. Figure ). Fast or slow adsorption kinetics would not change this limit. It likely reflects structure and indicates Langmuir type stoichiometric N2 loading of each Rh atom, all of which are accessible.
The cases (b) and (c) are kinetic features: Clusters Rh5+, Rh13+, and Rh14+ experience N2 desorption much ahead of reaching the adsorption limit mmax. Intermediate N2 adsorption seems volatile and prone to some desorption, which of course relates to a lower thermodynamic stability as compared to other adsorbate cluster complexes. We will discuss these issues from a thermodynamic point of view in more detail in the following paragraphs.
Case (b): The adsorption of N2 onto Rh13+ and Rh14+ is all spontaneous ( < 0) up to (13,14) and (14,15). This corresponds to a full loading with two geminal N2s, depending on taking into account an inner, non-accessible Rh atom. The surface atoms of larger clusters are higher next neighbour coordinated and therefore less reactive towards adsorbates [Citation76]. Additional N2 molecules bind more loosely and likely form a second adsorbate shell. These loosely bound N2s can easily desorb or roam about the surface of the cluster adsorbate complex. These processes will manifest themselves in the observed reversibility for large m up to mmax. Other than in the cases i = 6,7, the higher next neighbour coordination of i = 13,14 enhances the effect of desorption on the cryo N2 adsorption kinetics. The mmax/i stoichiometries decrease (12/6, 13/7, 19/13, and 20/14) with number of metal atoms i. It is beyond doubt that large Rhi+ clusters (i > 10) establish an N2 adsorption–desorption equilibrium across multiple steps, a range of m values. In contrast, small rhodium clusters hold tight to their N2 adsorbates but for the very last one, an adsorption–desorption equilibrium at a single m value.
Case (c): The adsorption of a first N2 onto Rh5+ is not spontaneous. All subsequent adsorption steps up to mmax = 10 yield gradually more negative ΔadsG26 K(5,m) values. We had to consider desorption in each step up to m = 5, and negligible desorption rate constants < 0.001 for m > 5. Accordingly, the Gibbs energies decrease stepwise from ΔadsG26 K(5,0) = +0.4 kJ/mol to ΔadsG26 K(5,5) = −0.5 kJ/mol (cf. Table S11). This is in contrast to all other clusters Rhi+ (i ≠ 5) where positive Gibbs energies occur towards (i,mmax). The desorption rate constants of m > 5 are negligible, the ΔadsG26 K(5,m) values have an upper limit of −1.6 kJ/mol, which is similar for all other investigated clusters (as emphasised by the colouring scheme in Figure ).
In summary, the evaluation and mapping of Gibbs energies provided further information on the spontaneity of the adsorption–desorption steps and consolidated our assumptions made before: Besides pure cluster geometry and stoichiometric N2 adsorption, the coordination of the cluster surface atoms plays a crucial role in the adsorption process. Higher next neighbour coordination of Rh atoms impedes the adsorption of a second N2 on a Rh atom. A desorption could precede easily. In these cases, we observe enhanced Gibbs energies. The case of N2 adsorption to Rh5+ bears strong evidence for spin and/or structural isomers and adsorption induced interconversion/relaxation.
3.4. DFT modelling
Rh5+geometry. The above discussion of experimental results received support from our previous DFT results [Citation47] in the cases of Rh6+, Rh7+, and Rh9+. Conceivable starting structures are presented in Figure . Here, we performed additional DFT calculations on structures and multiplicities of the naked Rh5+ cluster, in order to verify our previous structural speculations. We started from a square pyramid sp and a trigonal bipyramid tbp structure and checked for spin multiplicities 2S + 1 = 1, … , 15 (Figure ). We found significant structural relaxation in the course of the optimisation procedure. Low spin structures tend to relax into square pyramids. For septet and nonet spin states we observe coexisting and slightly distorted sp and tbp isomers, and some highly distorted geometries beyond simple classification. The geometries of these distorted clusters are ‘in between’. For the quintet spin state, we obtain a square pyramid 5sp and a distorted structure. The total optimum – as of this survey – is a slightly distorted trigonal bipyramid with a nonet spin state. The second lowest isomer is a nonet square pyramid 9sp (+ 9 kJ/mol). The 11tet square pyramid 11sp relaxed into a trigonal bipyramid 11tbp.
Figure 8. Total energies of most stable Rh5+ cluster structures as a function of the spin multiplicity 2S + 1, normalised to the most stable trigonal bipyramid nonet, 9tbp. The second most stable isomer is a nonet square pyramid, 9sp, +9 kJ/mol. In the cases of high or low multiplicities, a single stable isomer is found (as indicated) while others relax into these. The fully relaxed path of successive spin isomers connects to an asymmetric spin valley (indicated in pink, in colour only in electronic format).
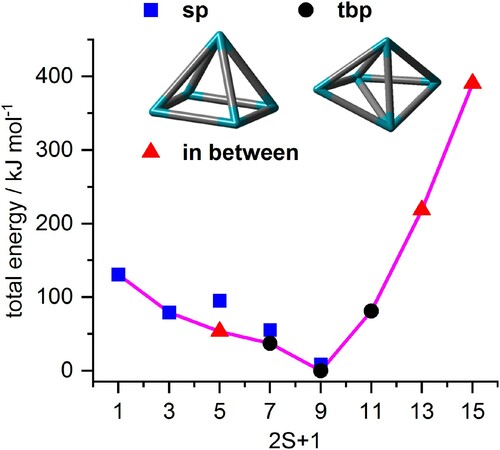
Our results are in line with an earlier study by Hamilton et al. who reported similar stabilities of square-based pyramidal sp and trigonal bipyramidal tbp Rh5 motifs in [Rh5(N2O)Ar]+ clusters [Citation41]. Other studies on various levels of theory on neutral and anionic rhodium clusters report similar results [Citation26,Citation43,Citation48–51]: low energy differences of nonet square pyramid 9sp and trigonal bipyramid isomers tbp.
The rhodium atoms in a square pyramid are on average less coordinated (four 3-fold, and one 4-fold coordinated Rh atom, 8 Rh-Rh bonds, and an average Rh-Rh next neighbour coordination number of 3.2) than in a trigonal bipyramid (three 4-fold, and two 3-fold coordinated Rh atoms, 9 Rh-Rh bonds, and an average Rh-Rh next neighbour coordination number of 3.6), cf. Table S16 in the Supplement. We expect that a lower coordination of rhodium atoms by adjacent metal atoms facilitates an enhanced N2 adsorption.
A trigonal bipyramidal tbp structure of the Rh5+ cluster core facilitates the rationalisation of our intermittent adsorption limit of (5,7): Three single N2 molecules occupy each of the three highly coordinated equatorial Rh atoms, whereas the two apical, low coordinated Rh atoms receive two geminal N2 molecules each.
Stepwise N2 adsorption onto Rh5+. To investigate the effects of stepwise N2 adsorption on the cluster structure and possible spin relaxations, we optimised the cluster core together with the adsorbate shell of (5,m) in the cases of m = 1, … ,4,7,10. For each m, we started with several conceivable adsorption shell isomers around given tbp and sp cluster cores, and we obtained fully converged structures for singlet to tredectet multiplicities in most cases (Figure ). N2 adsorption energies correspond to the offsets between the resulting curves – each of which resembles the spin valley of a single (5,m) complex.
The shape of the naked clusters’ spin valley persists upon adsorption of a first and a second N2 molecule. Nonet multiplicities are most stable. Higher multiplicities are most expensive, lower ones are stepwise less stable by 37–11 kJ/mol per spin flip. Thus, spin pairing is more feasible than costly occupation of additional orbitals by additional single spins.
Here, and in the following, the low spin wing of spin valleys is more affected by N2 adsorption than the high spin wing. The third N2 adsorption reveals a more pronounced effect in this regard: Nonet, septet, and quintet become degenerate, and the fourth N2 adsorption event widens the almost flat bottom of the spin valley by one more multiplicity towards the triplet state, which locates merely 13 kJ/mol above the most stable septet. Even the singlet is only 24 kJ/mol higher than the septet.
The next calculated spin valley curve of (5,7) reveals even more relaxation of low spin multiplicities: The spin valley is continuously decreasing towards the most stable singlet state. The corresponding structure bases on a square pyramid 1sp cluster core: The spin relaxation is intertwined with a structural relaxation. However, 1tbp is found only 12 kJ/mol above 1sp.
We obtain comparable findings for the spin valley curve of (5,10): Once again, it is most stable a singlet square pyramid 1sp cluster core structure. It sustains a fully occupied first adsorbate layer of ten N2 adsorbates, which locate pairwise on any of the five Rh core atoms. This is in full accord with the experimental adsorption limit and the recorded adsorption kinetics of Rh5+ clusters.
It warrants to check for conceivable isomerism of adsorbate shells and cluster cores at this point. The second most stable isomer of (5,10) of +17 kJ/mol comprises of a tetrahedral core with a low coordinated extra Rh atom above one edge, labelled as a singly capped tetrahedral 1sct cluster core structure (cf. Figure ). The single twofold coordinated Rh atom might adsorb up to three N2 molecules and suggest an adsorption limit at (5,11). The lowest 1tbp structure is 37 kJ/mol above 1sp, and it provides for two apical Rh atom, that might adsorb up to three N2 molecules. This suggests a possible adsorption limit at (5,12). The observed limit at (5,10) is thus well in line with the calculate most stable 1sp cluster core, surrounded by a closed adsorbate layer and sustained by all doubly N2 occupied Rh adsorption sites. The similar stabilities of sp and tbp isomers are well in line with literature as reported above.
It seems possible to risk an educated guess on the very nature of the adsorbate induced spin quenching as follows: Naked rhodium clusters of given sizes chose to locate unpaired spins largely in SOMOs of low coordinated atoms at their surfaces. For sure, there is noticeable unpaired spin density exposed to approaching molecules. In case of singlet state bearing molecules with large HOMO–LUMO gap Pauli repulsion sets in. There is little chance to donate unpaired spin density into the molecule, and N2 is probably an example, which is least prone for unpaired spins. Thus, the gain of adsorption enthalpy through lone pair donation is hampered by the persistent presence of high spin density – unless the rhodium cluster itself promotes some of its unpaired electrons into less favourable spin pairing. Only thereby, it would provide accessible LUMOs to accept the σ donation of N2 lone pairs.
Vertical and adiabatic N2 adsorption. The total energies of each of the spin valley curves decrease stepwise with, and by the number of adsorbed N2. We consider energies of spin conserving adsorption processes (vertical) as well as the energies of an adsorption process with relaxation towards most stable spin isomers (adiabatic). These step sizes indicate the N2 adsorption energies per step. We normalise absolute values to the energy of the minimum nonet 9tbp (5,0) cluster. Both vertical and adiabatic adsorption energies (cf. Figure S11 and Table S18) refer to this very starting point. The adiabatic and vertical (nonet) adsorption energies decline for the first three steps from −65 kJ/mol (m = 0) via −62 kJ/mol (m = 1) to –51 kJ/mol (m = 2). Vertical adsorption energies in the last observed step (m = 9) become as low as less than −30 kJ/mol (m = 9), whereas the adiabatic adsorption energies are somewhat higher, about −42 kJ/mol (interpolated).
In total, the vertical adsorption of 10 N2 molecules stabilises the Rh5+ cluster by 441 kJ/mol, and the adiabatic adsorption adds 140 kJ/mol of additional stabilisation through spin relaxation on top. The effect of stepwise decreasing adsorption energies seems intuitive to us, and the red dashed lines in Figure serve to emphasise the actual course of concomitant adsorption and spin relaxation.
Figure 9. Total energies of computed [Rh5(N2)m]+ cluster adsorbate complex structures (5,m) as a function of the spin multiplicity 2S + 1, normalised to the computed (5,0) spin isomer (trigonal bipyramid, 9tbp, nonet). The calculated minimum structures for (5,0), (5,7) and (5,10) are shown as insets. Spin contamination occurs in some low spin cases (red brackets). The horizontal grey dashed lines serve to interpolate singlet and nonet state energies where no computational data are available. Their offset against each other indicates the supposed average adsorption energy upon spin conservation. The red dashed lines connect the spin valley curves’ minima as indicated by the red circles.
![Figure 9. Total energies of computed [Rh5(N2)m]+ cluster adsorbate complex structures (5,m) as a function of the spin multiplicity 2S + 1, normalised to the computed (5,0) spin isomer (trigonal bipyramid, 9tbp, nonet). The calculated minimum structures for (5,0), (5,7) and (5,10) are shown as insets. Spin contamination occurs in some low spin cases (red brackets). The horizontal grey dashed lines serve to interpolate singlet and nonet state energies where no computational data are available. Their offset against each other indicates the supposed average adsorption energy upon spin conservation. The red dashed lines connect the spin valley curves’ minima as indicated by the red circles.](/cms/asset/8c950f8d-0bec-48cc-b904-8f146ac87846/tmph_a_1953172_f0009_oc.jpg)
4. Conclusion
We have recorded the cryo kinetics of N2 adsorption onto cationic Rhi+ clusters (i = 5–15). The adsorption limits mmax increase with the number of metal atoms i, and they range over i ≤ mmax ≤ 2i with the Rh9+ cluster providing for the lowest observed N2 coverage of merely mmax/i = 1. In most cases, the intermittent adsorption limits mx coincide with the adsorption limits mmax, which we take as an indication for a smooth cluster surface made of equal adsorption sites which stem from Rh cluster surface atoms with equal (or at least very similar) next neighbour coordination environments. We determine by kinetic fits relative rate constants for each N2 adsorption and desorption step, which quantify the significant trends in adsorption behaviour in terms of rate constants. We obtain equilibrium constants and Gibbs free energies, and it is beyond doubt that large Rhi+ clusters (i > 10) establish an N2 adsorption–desorption equilibrium while small ones hold tight to their N2 adsorbates but for the very last one. Our experimental absolute rate constants compare favourably to those from the ‘Hard Sphere Average dipole orientation model’. We observed a significant reluctance towards N2 adsorption for the Rh5+ cluster, indicated by necessary desorption steps. By calculating the corresponding Gibbs energies for the adsorption–desorption equilibria and by first extensive DFT calculations, we gained information on the energetics of the N2 adsorption onto Rh5+ and postulate isomerisation processes between a tbp and an sp cluster core type yielding an sp cluster core from an intermittent adsorption limit. A spin quench accompanies the N2 adsorption and the isomerisation. The course of the rate constants enabled us to tentatively assign a tbp cluster structure to Rh5+. DFT calculations also support this assignment.
Further spectroscopic investigations accompanied by DFT modelling of each adsorption step (beyond our previous study, [Citation47]) will deliver even more detailed insights into the cluster structures and the reorganisation processes. Such studies are subject of ongoing work.
Supplementary Material
Download MS Word (2 MB)Acknowledgements
We thank Annika Steiner for valuable discussions concerning data evaluation and nomenclature as well as Thomas Kolling for assistance on technical questions of any kind. Finally, we thank the reviewers for most valuable comments, which were much appreciated.
Disclosure statement
No potential conflict of interest was reported by the author(s).
Additional information
Funding
Related Research Data
References
- S. Brunauer, P.H. Emmett and E. Teller, J. Am. Chem. Soc. 60, 309–319 (1938). doi:https://doi.org/10.1021/ja01269a023.
- D.A. King and M.G. Wells, Proc. R. Soc. A Math. Phys. Eng. Sci. 339, 245–269 (1974). doi:https://doi.org/10.1098/rspa.1974.0120.
- D.A. King and M.G. Wells, Surf. Sci. 29, 454–482 (1972). doi:https://doi.org/10.1016/0039-6028(72)90232-4.
- G. Ertl, S.B. Lee and M. Weiss, Surf. Sci. 114, 515–526 (1982). doi:https://doi.org/10.1016/0039-6028(82)90702-6.
- M. Grunze, M. Golze, W. Hirschwald, H.J. Freund, H. Pulm, U. Seip, M.C. Tsai, G. Ertl and J. Küppers, Phys. Rev. Lett. 53, 850–853 (1984). doi:https://doi.org/10.1103/PhysRevLett.53.850.
- D.K. Böhme and H. Schwarz, Angew. Chem., Int. Ed. 44, 2336–2354 (2005). doi:https://doi.org/10.1002/anie.200461698.
- D. Schröder and H. Schwarz, Angew. Chem., Int. Ed. 34, 1973–1995 (1995). doi:https://doi.org/10.1002/anie.199519731.
- U. Heiz and U. Landman, editors, Nanocatalysis (Springer-Verlag, Berlin, 2007).
- S.M. Lang and T.M. Bernhardt, Phys. Chem. Chem. Phys. 14, 9255–9269 (2012). doi:https://doi.org/10.1039/c2cp40660h.
- M.B. Knickelbein, Annu. Rev. Phys. Chem. 50, 79–115 (1999). doi:https://doi.org/10.1146/annurev.physchem.50.1.79.
- M.D. Morse, M.E. Geusic, J.R. Heath and R.E. Smalley, J. Chem. Phys. 83, 2293–2304 (1985). doi:https://doi.org/10.1063/1.449321.
- A. Bérces, P.A. Hackett, L. Lian, S.A. Mitchell and D.M. Rayner, J. Chem. Phys. 108, 5476–5490 (1998). doi:https://doi.org/10.1063/1.475936.
- F. Liu, M. Li, L. Tan and P.B. Armentrout, J. Chem. Phys. 128, 194313 (2008). doi:https://doi.org/10.1063/1.2909978.
- J. Ho, E.K. Parks, L. Zhu and S.J. Riley, Chem. Phys. 201, 245–261 (1995). doi:https://doi.org/10.1016/0301-0104(95)00242-4.
- S.J. Riley, J. Non-Cryst. Solids. 205–207, 781–787 (1996). doi:https://doi.org/10.1016/S0022-3093(96)00307-9.
- E.K. Parks, L. Zhu, J. Ho and S.J. Riley, J. Chem. Phys. 100, 7206–7222 (1994). doi:https://doi.org/10.1063/1.466868.
- E.K. Parks, L. Zhu, J. Ho and S.J. Riley, J. Chem. Phys. 102, 7376–7389 (1995). doi:https://doi.org/10.1063/1.469050.
- E.K. Parks and S.J. Riley, Z. Phys. D: At., Mol. Clusters. 33, 59–70 (1995). doi:https://doi.org/10.1007/BF01437094.
- E.K. Parks, K.P. Kerns and S.J. Riley, Chem. Phys. 262, 151–167 (2000). doi:https://doi.org/10.1016/S0301-0104(00)00141-5.
- E.K. Parks, G.C. Nieman, K.P. Kerns and S.J. Riley, J. Chem. Phys. 108, 3731–3739 (1998). doi:https://doi.org/10.1063/1.475779.
- L.-H. Mou, G.-D. Jiang, Z.-Y. Li and S.-G. He, Chin. J. Chem. Phys. 33, 507–520 (2020). doi:https://doi.org/10.1063/1674-0068/cjcp2008141.
- C. Berg, T. Schindler, G. Niedner-Schatteburg and V.E. Bondybey, J. Chem. Phys. 102, 4870–4884 (1995). doi:https://doi.org/10.1063/1.469535.
- C. Berg, M. Beyer, T. Schindler, G. Niedner-Schatteburg and V.E. Bondybey, J. Chem. Phys. 104, 7940–7946 (1996). doi:https://doi.org/10.1063/1.471510.
- B. Pfeffer, S. Jaberg and G. Niedner-Schatteburg, J. Chem. Phys. 131, 194305 (2009). doi:https://doi.org/10.1063/1.3264575.
- C. Adlhart and E. Uggerud, J. Chem. Phys. 123, 214709 (2005). doi:https://doi.org/10.1063/1.2131066.
- Y. Ren, Y. Yang, Y.-X. Zhao and S.-G. He, J. Phys. Chem. C. 123, 17035–17042 (2019). doi:https://doi.org/10.1021/acs.jpcc.9b04750.
- Y.-X. Zhao, X.-G. Zhao, Y. Yang, M. Ruan and S.-G. He, J. Chem. Phys. 154, 180901 (2021). doi:https://doi.org/10.1063/5.0046529.
- I. Balteanu, O.P. Balaj, M.K. Beyer and V.E. Bondybey, Int. J. Mass Spectrom. 255–256, 71–75 (2006). doi:https://doi.org/10.1016/j.ijms.2005.08.019.
- I. Balteanu, O.P. Balaj, B.S. Fox-Beyer, P. Rodrigues, M.T. Barros, A.M.C. Moutinho, M.L. Costa, M.K. Beyer and V.E. Bondybey, Organometallics. 23, 1978–1985 (2004). doi:https://doi.org/10.1021/om049946y.
- G. Albert, C. Berg, M. Beyer, U. Achatz, S. Joos, G. Niedner-Schatteburg and V.E. Bondybey, Chem. Phys. Lett. 268, 235–241 (1997). doi:https://doi.org/10.1016/S0009-2614(97)00202-9.
- K. Koszinowski, M. Schlangen, D. Schröder and H. Schwarz, Int. J. Mass Spectrom. 237, 19–23 (2004). doi:https://doi.org/10.1016/j.ijms.2004.06.009.
- C. Berg, M. Beyer, U. Achatz, S. Joos, G. Niedner-Schatteburg and V.E. Bondybey, J. Chem. Phys. 108, 5398–5403 (1998). doi:https://doi.org/10.1063/1.475972.
- F. Mafuné, Y. Tawaraya and S. Kudoh, J. Phys. Chem. A. 120, 4089–4095 (2016). doi:https://doi.org/10.1021/acs.jpca.6b03479.
- M. Andersson, L. Holmgren and A. Rosén, Surf. Rev. Lett. 3, 683–686 (1996). doi:https://doi.org/10.1142/S0218625X96001236.
- C. Cui, Y. Jia, H. Zhang, L. Geng and Z. Luo, J. Phys. Chem. Lett. 11, 8222–8230 (2020). doi:https://doi.org/10.1021/acs.jpclett.0c02218.
- M.R. Zakin, D.M. Cox and A. Kaldor, J. Chem. Phys. 89, 1201–1202 (1988). doi:https://doi.org/10.1063/1.455234.
- A. Fielicke, P. Gruene, G. Meijer and D.M. Rayner, Surf. Sci. 603, 1427–1433 (2009). doi:https://doi.org/10.1016/j.susc.2008.09.064.
- A. Fielicke, G. von Helden, G. Meijer, D.B. Pedersen, B. Simard and D.M. Rayner, J. Phys. Chem. B. 108, 14591–14598 (2004). doi:https://doi.org/10.1021/jp049214j.
- A. Fielicke, G. von Helden, G. Meijer, D.B. Pedersen, B. Simard and D.M. Rayner, J. Chem. Phys. 124, 194305 (2006). doi:https://doi.org/10.1063/1.2196887.
- A. Fielicke, G. von Helden, G. Meijer, B. Simard, S. Dénommée and D.M. Rayner, J. Am. Chem. Soc. 125, 11184–11185 (2003). doi:https://doi.org/10.1021/ja036897s.
- S.M. Hamilton, W.S. Hopkins, D.J. Harding, T.R. Walsh, M. Haertelt, C. Kerpal, P. Gruene, G. Meijer, A. Fielicke and S.R. Mackenzie, J. Phys. Chem. A. 115, 2489–2497 (2011). doi:https://doi.org/10.1021/jp201171p.
- D.J. Harding, P. Gruene, M. Haertelt, G. Meijer, A. Fielicke, S.M. Hamilton, W.S. Hopkins, S.R. Mackenzie, S.P. Neville and T.R. Walsh, J. Chem. Phys. 133, 214304 (2010). doi:https://doi.org/10.1063/1.3509778.
- T.D. Hang, H.M. Hung, L.N. Thiem and H.M.T. Nguyen, Comput. Theor. Chem. 1068, 30–41 (2015). doi:https://doi.org/10.1016/j.comptc.2015.06.004.
- J. Mohrbach, S. Dillinger and G. Niedner-Schatteburg, J. Phys. Chem. C. 121, 10907–10918 (2017). doi:https://doi.org/10.1021/acs.jpcc.6b12167.
- J. Mohrbach, S. Dillinger and G. Niedner-Schatteburg, J. Chem. Phys. 147, 184304 (2017). doi:https://doi.org/10.1063/1.4997403.
- S. Dillinger, J. Mohrbach and G. Niedner-Schatteburg, J. Chem. Phys. 147, 184305 (2017). doi:https://doi.org/10.1063/1.4997407.
- M.P. Klein, A.A. Ehrhard, J. Mohrbach, S. Dillinger and G. Niedner-Schatteburg, Top. Catal. 61, 106–118 (2018). doi:https://doi.org/10.1007/s11244-017-0865-2.
- C.-H. Chien, E. Blaisten-Barojas and M.R. Pederson, Phys. Rev. A. 58, 2196–2202 (1998). doi:https://doi.org/10.1103/PhysRevA.58.2196.
- J.H. Mokkath and G.M. Pastor, J. Phys. Chem. C. 116, 17228–17238 (2012). doi:https://doi.org/10.1021/jp3032176.
- B.V. Reddy, S.K. Nayak, S.N. Khanna, B.K. Rao and P. Jena, Phys Rev B. 59, 5214–5222 (1999). doi:https://doi.org/10.1103/PhysRevB.59.5214.
- Y. Jinlong, F. Toigo and W. Kelin, Phys. Rev. B. Condens. Matter. 50, 7915–7924 (1994). doi:https://doi.org/10.1103/PhysRevB.50.7915.
- D. Schroder, S. Shaik and H. Schwarz, Acc. Chem. Res. 33, 139–145 (2000). doi:https://doi.org/10.1021/ar990028j.
- J.J. Melko, S.G. Ard, J.A. Fournier, N.S. Shuman, J. Troe and A.A. Viggiano, J. Phys. Chem. A. 116, 11500–11508 (2012). doi:https://doi.org/10.1021/jp309033b.
- J.J. Melko, S.G. Ard, J.A. Fournier, J. Li, N.S. Shuman, H. Guo, J. Troe and A.A. Viggiano, Phys. Chem. Chem. Phys. 15, 11257–11267 (2013). doi:https://doi.org/10.1039/c3cp50335f.
- S.G. Ard, J.J. Melko, V.G. Ushakov, R. Johnson, J.A. Fournier, N.S. Shuman, H. Guo, J. Troe and A.A. Viggiano, J. Phys. Chem. A. 118, 2029–2039 (2014). doi:https://doi.org/10.1021/jp5000705.
- S.G. Ard, J.J. Melko, O. Martinez, Jr., V.G. Ushakov, A. Li, R.S. Johnson, N.S. Shuman, H. Guo, J. Troe and A.A. Viggiano, J. Phys. Chem. A. 118, 6789–6797 (2014). doi:https://doi.org/10.1021/jp5055815.
- S.G. Ard, R.S. Johnson, J.J. Melko, O. Martinez, N.S. Shuman, V.G. Ushakov, H. Guo, J. Troe and A.A. Viggiano, Phys. Chem. Chem. Phys. 17, 19709–19717 (2015). doi:https://doi.org/10.1039/C5CP01418B.
- V.G. Ushakov, J. Troe, R.S. Johnson, H. Guo, S.G. Ard, J.J. Melko, N.S. Shuman and A.A. Viggiano, Phys. Chem. Chem. Phys. 17, 19700–19708 (2015). doi:https://doi.org/10.1039/C5CP01416F.
- S. Dillinger, J. Mohrbach, J. Hewer, M. Gaffga and G. Niedner-Schatteburg, Phys. Chem. Chem. Phys. 17, 10358–10362 (2015). doi:https://doi.org/10.1039/C5CP00047E.
- D. Proch and T. Trickl, Rev. Sci. Instrum. 60, 713–716 (1989). doi:https://doi.org/10.1063/1.1141006.
- P. Caravatti and M. Allemann, Org. Mass Spectrom. 26, 514–518 (1991). doi:https://doi.org/10.1002/oms.1210260527.
- M. Graf, Entwicklung eines auf Evolutionsstrategien basierenden Computerprogrammes zum optimierten Anpassen kinetischer Daten aus FT-ICR-Massenspektrometrie-Messungen (TU Kaiserslautern, Kaiserslautern, 2006).
- T. Su and M.T. Bowers, J. Am. Chem. Soc. 95, 7609–7610 (1973). doi:https://doi.org/10.1021/ja00804a011.
- T. Su and M.T. Bowers, J. Am. Chem. Soc. 95, 1370–1373 (1973). doi:https://doi.org/10.1021/ja00786a003.
- T. Su and M.T. Bowers, J. Chem. Phys. 58, 3027–3037 (1973). doi:https://doi.org/10.1063/1.1679615.
- T. Su and M.T. Bowers, Int. J. Mass Spectrom. Ion Phys. 12, 347–356 (1973). doi:https://doi.org/10.1016/0020-7381(73)80104-4.
- G. Kummerlöwe and M.K. Beyer, Int. J. Mass Spectrom. 244, 84–90 (2005). doi:https://doi.org/10.1016/j.ijms.2005.03.012.
- I. Balteanu, U. Achatz, O.P. Balaj, B.S. Fox, M.K. Beyer and V.E. Bondybey, Int. J. Mass Spectrom. 229, 61–65 (2003). doi:https://doi.org/10.1016/S1387-3806(03)00256-2.
- M.J. Frisch, G.W. Trucks, H.B. Schlegel, G.E. Scuseria, M.A. Robb, J.R. Cheeseman, G. Scalmani, V. Barone, B. Mennucci, G.A. Petersson, H. Nakatsuji, M. Caricato, X. Li, H.P. Hratchian, A.F. Izmaylov, J. Bloino, G. Zheng, J.L. Sonnenberg, M. Hada, M. Ehara, K. Toyota, R. Fukuda, J. Hasegawa, M. Ishida, T. Nakajima, Y. Honda, O. Kitao, H. Nakai, T. Vreven, J.A. Montgomery, Jr., J.E. Peralta, F. Ogliaro, M.J. Bearpark, J. Heyd, E.N. Brothers, K.N. Kudin, V.N. Staroverov, R. Kobayashi, J. Normand, K. Raghavachari, A.P. Rendell, J.C. Burant, S.S. Iyengar, J. Tomasi, M. Cossi, N. Rega, N.J. Millam, M. Klene, J.E. Knox, J.B. Cross, V. Bakken, C. Adamo, J. Jaramillo, R. Gomperts, R.E. Stratmann, O. Yazyev, A.J. Austin, R. Cammi, C. Pomelli, J.W. Ochterski, R.L. Martin, K. Morokuma, V.G. Zakrzewski, G.A. Voth, P. Salvador, J.J. Dannenberg, S. Dapprich, A.D. Daniels, Ö Farkas, J.B. Foresman, J.V. Ortiz, J. Cioslowski and D.J. Fox, Gaussian 09, Revision D.01 (Gaussian, Inc., Wallingford, CT, 2009).
- C. Adamo and V. Barone, J. Chem. Phys. 110, 6158–6170 (1999). doi:https://doi.org/10.1063/1.478522.
- D. Andrae, U. Häußermann, M. Dolg, H. Stoll and H. Preuß, Theor. Chim. Acta. 77, 123–141 (1990). doi:https://doi.org/10.1007/BF01114537.
- G. Niedner-Schatteburg, in Clusters – Contemporary Insight in Structure and Bonding, edited by S. Dehnen (Springer International Publishing, Cham, 2017), pp. 1–40.
- G. Comelli, V.R. Dhanak, M. Kiskinova, K.C. Prince and R. Rosei, Surf. Sci. Rep. 32, 165–231 (1998). doi:https://doi.org/10.1016/S0167-5729(98)00003-X.
- T. Bligaard and J.K. Nørskov, in Chemical Bonding at Surfaces and Interfaces, edited by A. Nilsson, L.G.M. Pettersson, and J.K. Nørskov (Elsevier, Amsterdam, 2008), pp. 255–321.
- D. Harding, M.S. Ford, T.R. Walsh and S.R. Mackenzie, Phys. Chem. Chem. Phys. 9, 2130–2136 (2007). doi:https://doi.org/10.1039/B618299B.
- J. Berwanger, S. Polesya, S. Mankovsky, H. Ebert and F.J. Giessibl, Phys. Rev. Lett. 124, 096001 (2020). doi:https://doi.org/10.1103/PhysRevLett.124.096001.