
 ?Mathematical formulae have been encoded as MathML and are displayed in this HTML version using MathJax in order to improve their display. Uncheck the box to turn MathJax off. This feature requires Javascript. Click on a formula to zoom.
Abstract
The reactions between ground-state (X
) and
forming
and
were investigated in the range of collision energies
between
and 10 K using a merged-beam approach. The reaction rates measured experimentally are compared to those obtained for the reaction between
and
forming
under similar experimental conditions. Below 1 K, a clear enhancement of the reaction rate coefficient compared to the Langevin rate measured at higher collision energies was observed in both reaction systems. This enhancement is interpreted as originating from the interaction between the charge of
and the quadrupole of para
and ortho
molecules in the J = 1 rotational level. The enhancement of the reaction with
was found to be significantly less than that of the reaction with
, reflecting the relative population of the J = 1 rotational level of
(75%) and
(33%) in natural samples at low temperatures. Simulations of the experimental results based on the theoretical predictions of the reaction cross sections by Dashevskaya et al. [J. Chem. Phys. 145, 244315 (2016)] reveal agreement within the experimental uncertainties. The branching ratio η of the reaction involving
and
and forming
and D (
) near
was determined to be 0.341(15). Time-of-flight measurements of the velocity distributions of the reaction products are compatible with an isotropic product emission with an average total kinetic energy of 0.45(5) eV for both channels, representing about 30% of the total energy released by the reaction.
GRAPHICAL ABSTRACT
1. Introduction
Ion-molecule reactions play an important role in the chemistry of dilute gases [Citation1–3]. Accurate data on their rates, on branching ratios for competing product channels, and on the quantum-state distribution of the reaction products are relevant for the modelling of chemical processes in plasmas, planetary atmospheres [Citation4,Citation5] and interstellar clouds [Citation6–12]. Measurements of thermal reaction rates and collision-energy-dependent reaction cross sections have been carried out down to about 10 K for numerous ion-molecule reactions using guided-ion beam techniques [Citation13–15] and in supersonic beams expanding out of Laval nozzles (CRESU technique for ‘Cinétique de Réaction en Ecoulement Supersonique Uniforme’ [Citation16]). The study of ion-molecule reactions at temperatures below about 10 K or low collision energies has long been hampered by heating effects of the reactant ions by stray electric fields in the reaction volume. Consequently, the knowledge and understanding of low-temperature ion-molecule chemistry has been almost exclusively obtained from theoretical investigations. Examples involving the theoretical description of fast, barrier-free ion-molecule reactions relevant for the present investigation include Refs. [Citation17–26].
The temperature and collision-energy ranges below 10 K are becoming accessible experimentally thanks to recent progress in the study of physical and chemical processes involving atomic and molecular ions stored in Coulomb crystals and ion-traps [Citation27–32]. For example, Dörfler et al. have studied the effect of the quadrupole of electronically excited Rb atoms on the rate of their reactions with O and N
in the collision-energy range between
and
[Citation32]. An alternative approach to study ion-molecule reactions at low temperatures consists of replacing the reactant ion by a neutral atom or molecule excited to a high Rydberg state. In such states, the highly excited Rydberg electron is located far away from the ionic core and does not influence the reactions of the ion core with neutral atoms and molecules located within the Rydberg-electron orbit [Citation33–35]. The Rydberg electron shields the reaction system from heating effects by stray electric fields. Moreover, the large dipole moments of Rydberg states enable the control of the motion of Rydberg atoms and molecules using Rydberg-Stark decelerators and deflectors [Citation36–41], opening access to studies of ion-molecule reactions at very low collision energies in merged beams [Citation42–45]. Recent studies based on this approach revealed pronounced enhancements of the reaction rate coefficients below 1 K in capture reactions resulting from the ion-dipole interaction in the
reaction [Citation44] and from the ion-quadrupole interaction in the
[Citation42] reaction, but not in the
[Citation45] reaction.
In this article, we report on the study of the ion-quadrupole interaction in the reaction between and
forming
and
and on the quantitative comparison of the collision-energy dependence of the reaction rate coefficient with that of the
reaction forming
at collision energies
in the range between
between 0 and 10 K (
is Boltzmann's constant). We also describe a precise measurement of the branching ratios of the
and
product channels and the determination of the mean kinetic energy released by the reaction.
2. Experimental setup and procedure
The experiments were carried out using the merged-beam apparatus depicted in Figure , which is a redesigned version of the experimental setup originally developed to study the reaction [Citation43]. Several modifications introduced to improve the collision-energy resolution, the sensitivity of the product-ion detection, and the stability of the optical and mechanical components are described in Ref. [Citation45], which also explains in detail, with the example of the reaction between
and HD forming
and
, how the kinetic-energy distributions of the products and the branching ratios between different reaction channels are measured. We present here only the main aspects of the measurements and the aspects that are specific to the
reaction system and refer to articles [Citation43,Citation45] for further details.
Figure 1. Schematic representation of the merged-beam apparatus used to study the and
reactions at low collision energies, with (i) the source chambers containing pulsed valves emitting supersonic beams of either
or
(
source chamber) and
(
source chamber), (ii) the deflection and reaction chamber containing the photoexcitation zone, where
molecules are photoexcited to Rydberg-Stark states, the Rydberg-Stark deflector and decelerator used to merge the two beams, and the electrode stack surrounding the reaction zone used to extract the product ions, and (iii) the detection chamber where the product-ion yields are monitored using an MCP detector. FIG1 and FIG2 are two fast ionisation gauges used to measure the velocity distribution of the
or
beam. Top left: Example of a sequence of pulsed potentials applied to the three plates of the electrode stack to extract the product ions.
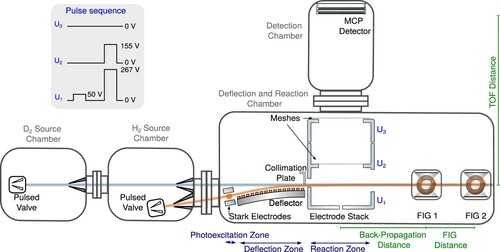
The apparatus consists of four differentially pumped vacuum chambers. A supersonic beam of ground-state or
molecules is generated in the
source chamber using a home-built pulsed-valve (nozzle-opening time of 20
) operated at a stagnation pressure of 6 bar and a repetition rate of 25 Hz. The central component of the beam is selected by two skimmers and traverses the reaction chamber in a straight line. The characteristics of the beam are determined beyond the reaction zone using two fast ionisation gauges (FIG1 and FIG2 in Figure ) separated by 19.3 cm. From the temporal profile of the signals generated by the FIGs, the longitudinal (i.e. along the beam-propagation direction) spatial and velocity distributions of the cold packets of molecules in the reaction zone can be precisely reconstructed. Their transverse spatial and velocity distributions are given by the geometrical constraints imposed by the two skimmers and a collimation plate located at the entrance of the reaction zone. In the experiments described here, the mean velocity of the beam was adjusted in the range between 1300 m/s and 1900 m/s by setting the temperature of the valve to specific values between 110 and 170 K. In the reaction zone, the pulsed molecule packets form a
cm-long cylindrical cloud with cross-sectional radius (
) of about 1 mm resulting from the large longitudinal dispersion of the molecules propagating with different velocities from the valve orifice to the reaction zone. This dispersion guarantees that only molecules within a very narrow range of velocities overlap with the much more compact (see below)
-Rydberg-molecule cloud in the centre of the reaction zone. Consequently, the velocity distribution of the ground-state molecules does not limit the collision-energy resolution of the measurements, as explained in Ref. [Citation45] (see also below).
Another pulsed supersonic beam, of pure gas, is generated by a second home-built valve operated at a stagnation pressure of 5 bar. A skimmer of 2 mm orifice diameter selects the central part of the beam, which then propagates along an axis making an angle of
with the first supersonic beam. Three lasers are used to excite the
molecules in this beam to low-field-seeking n = 27 Rydberg-Stark states having an
ion core in the rovibronic ground state using the resonant multiphoton excitation
(1)
(1) as described in detail in Refs. [Citation38,Citation43]. The
-Rydberg molecules are then loaded into electric traps moving above the surface of a curved 5 cm-long printed circuit board consisting of sets of parallel surface electrodes and serving as a Rydberg-Stark deflector and decelerator [Citation46]. This device is used to merge the beams of
-Rydberg molecules with the beam of ground-state
or
molecules just before the entrance of the reaction zone. It is also employed to adjust the final velocity of the Rydberg molecules using pre-programmed waveforms of the time-dependent electric potentials applied to the surface electrodes. With the help of numerical particle-trajectory simulations, the velocity and spatial distributions of the
-Rydberg molecules in the reaction zone can be accurately predicted. In earlier work [Citation42,Citation43,Citation45], these predictions have been carefully checked using imaging and time-of-flight measurement techniques. In the middle of the reaction zone, the
-Rydberg molecules form a 5 mm-long tubular cloud with axis parallel to the deflector surface and perpendicular to the beam-propagation direction and a cross-sectional radius (
) of about 1–2 mm, depending on the depth of the deflector trapping potentials and the selected final velocity. In the experiments described below, the velocity distribution of the
-Rydberg molecules in the beam limited the collision-energy resolution to about
for the
reaction, and to
for the
reaction because of the larger reduced mass. This resolution is to be interpreted as the energy bandwidth at nominal zero collision energy within which 68% of the collision events occur.
To measure the energy dependence of the reaction rate coefficients, we monitored the yield of the product ions ,
and
as a function of the relative mean velocity of the two beams, which were varied either by changing the temperature of the valve emitting the ground-state beam or by changing the final velocity of the
-Rydberg beam, as discussed in more detail below. The valve-opening times were set before each measurement to guarantee that the centres of the ground-state and
-Rydberg-molecule clouds reached the middle of the reaction zone at the same time. The product ions were collected by applying a sequence of pulsed electric fields (see upper left inset of Figure ) across the three electrodes of the electrode stack surrounding the reaction zone. This sequence enables one to precisely set the time interval over which the reaction is monitored, as explained in Ref. [Citation43]. A first potential pulse was applied to the bottom electrode of the stack and was used to define the beginning of the reaction-observation window. It swept out of the reaction zone all ions generated prior to its falling edge. Its amplitude of 50 V was chosen so that the electric field in the reaction region was too weak to field ionise the
-Rydberg molecules. The second pulse was generated by applying potentials of 267 and 155 V to the bottom and middle electrodes of the stack, respectively. This pulse extracted the product ions generated during the field-free reaction-observation window between the two pulses towards a microchannel-plate detector in a direction perpendicular to the merged-beams propagation axis. These potentials corresponded to the Wiley-McLaren conditions [Citation47] needed to observe sharp and well-resolved
,
and
product-ion signals in the time-of-flight (TOF) mass spectra. The field generated by these potentials typically also field ionised some of the
-Rydberg molecules, and the resulting
ions signal, which is proportional to the number of
-Rydberg molecules, was used to normalise the product-ion signals.
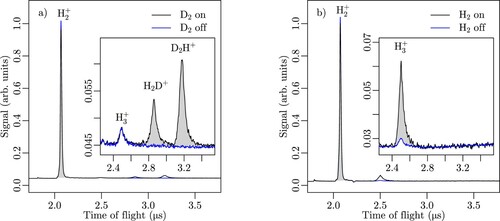
Typical TOF profiles are presented as black traces in panels (a) and (b) of Figure for the reactions of with
and
, respectively. The blue traces in this figure correspond to TOF spectra obtained when opening the ground-state valve after the product-ion extraction pulse and thus represent the background signal arising from reactions of
with ground-state molecules in the vacuum chamber. This background signal stems exclusively from
molecules emitted by the valve used to generate the
-Rydberg beam because this valve is located much closer to the reaction zone and is separated from it by only one differential-pumping stage (see Figure ). To eliminate this background signal, we recorded TOF spectra in alternate experimental cycles, once with, and once without, temporal overlap of the
-Rydberg and ground-state beams in the reaction zone. We then determined the differences of the corresponding integrated signals, as indicated by the grey-shaded areas below the product-ion signals in the insets of Figure (a,b). Only two product ions were detected for the
reaction:
and
. The signal observed at mass 3 u was found to be exclusively caused by the reaction of
with
molecules in the background gas. The reaction channel
, which is slightly endothermic, does not contribute in the range of collision energies studied here. The background-corrected integrated signals corresponding to
and
were used to derive the branching ratios of the
and
product channels of the
reaction.
Figure 2. Typical TOF spectra of the products of (a) the and (b) the
reactions measured when operating the TOF-mass spectrometer in Wiley-McLaren conditions. The black and blue traces were recorded with the ground-state beam on and off, respectively. The areas shaded in grey correspond to the integrated
PFI signal used to normalise the product yields and to the integrated product signals (
and
in (a) and
in (b)). The insets display the TOF regions of the
reaction products on an enlarged scale.
By applying a potential only to the bottom electrode of the ion-extraction stack and keeping the middle and top electrodes grounded, we can obtain information on the product-ion-cloud distributions at the time of extraction and derive information on the product-ion velocity distributions, as will be explained in the next section (see Figure in Section 3).
The density of ground-state molecules in the reaction volume is several orders of magnitude larger than that of the -Rydberg molecules so that the reaction rates follow pseudo-first-order kinetics. Moreover, the experiments are carried out under conditions where only a very small fraction (at most 1%) of the
-Rydberg molecules react to form products during the reaction-observation window. The reaction rate thus remains constant and the number of product ions grows linearly during the reaction-observation window. Consequently, the product-ion signals also increase linearly when we increase the duration τ of the reaction-observation window up to about
, when the fastest reaction products start leaving the extraction region. As demonstrated in Ref. [Citation45] and in the next section, we can exploit these properties to derive precise values of the branching ratios of specific reaction-product channels and also to obtain information on the product-kinetic-energy distribution. To this end, we have developed and extensively tested a numerical particle-trajectory simulation programme that enables us to derive information on the collision-energy-dependent rate coefficients, the branching ratios of different product channels, and the product-kinetic-energy distributions from observed TOF-spectra such as those presented in Figure and in Figure below (see also Refs. [Citation43,Citation45]).
3. Results and discussion
3.1. Determination of relative velocities and collision energies with the example of the  reaction
Figure illustrates the control over the relative mean velocities of the ground-state and Rydberg molecules achieved in our experiments. The figure displays, with the example of the reaction, the relative
product yield for different combinations of mean velocities of the two components of the merged beam. For each measurement set presented in Figure , the mean velocity of the
ground-state beam was kept fixed by stabilising the temperature of the pulsed valve and varying the velocity of the
-Rydberg beam with the surface-electrode deflector. The ground-state-beam velocity was changed between the different measurement sets and precisely determined from the temporal pulse profiles measured by the two fast ionisation gauges, as given on the right-hand side of the figure.
Figure 3. Normalised yield of the
reaction recorded when setting the velocity of the
ground-state beam to the values indicated above the different traces and varying the velocity of the
Rydberg beams using the Rydberg-Stark deflector and decelerator. The data points with error bars (one standard deviation) correspond to the experimental results and the full coloured lines to the results of the simulations described in Subsection 3.4. The slanted dashed line corresponds to equal velocities of the Rydberg and ground-state
beams.
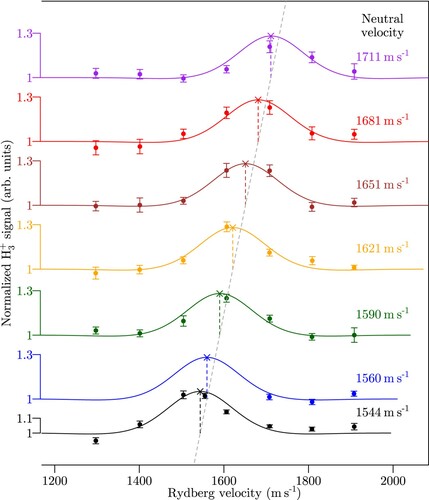
The horizontal axis in Figure gives the programmed values of the final velocities of the Rydberg molecules leaving the Rydberg-Stark deflector. The results of individual measurements of the relative yield are presented as dots with statistical error bars. The sets of measurements obtained for different ground-state-beam velocities are presented in different colours, each with its own vertical axis offset by an amount proportional to the velocity increments of the ground-state beam. All measurement sets exhibit a clear enhancement of the relative product yield of about 30% highlighted by full lines, which correspond to a numerical simulation of the experiment based on the rate coefficients reported by Dashevskaya et al. [Citation26], as explained below. The dashed vertical lines indicate the positions of maximal
yields, which, in all cases, correspond to zero relative velocities between the two beams. This behaviour is emphasised by the slanted grey dashed line in Figure , which exactly connects the positions of maximal relative
yields.
These experimental results do not only confirm the enhancement of the reaction rate coefficient of the reaction at collision energies below
K reported previously in Ref. [Citation42]; they also illustrate the improvements in sensitivity and resolution of the experiments achieved in the redesign of the apparatus. Each measurement set presented in Figure unambiguously reveals the enhancement of the rate coefficients at low collision energies in about a hundreth of the measurement time needed for the earlier measurements. Moreover, the amplitude of the enhancement is increased by a factor of about two, which corresponds to a twofold improvement of the collision-energy resolution. Because the velocities of both beams were set independently, Figure also demonstrates our ability to control the mean relative velocity of the two components of the merged beam to better than 20 m/s and the mean collision energy to better than
. This aspect greatly facilitated the experimental observation of the enhancement of the reaction rate of the
reaction presented in Subsection 3.4.
3.2. Branching ratios of the and product channels of the reaction
The charge-transfer reaction is endothermic and not observable in the range of collision energies below
K studied here. The reaction
has thus only two product channels in this range, i.e.
and
, which are sometimes also referred to as the D-atom-transfer and the proton-transfer channel, respectively. The branching ratios between these two channels can be obtained from the yields of
and
product ions and is equal to
for the D-atom-transfer channel and
for the proton-transfer channel.
To determine these branching ratios, we proceed as explained in Section 2 and determine the background-corrected relative and
product-ion signals for different durations τ of the reaction-observation windows. For τ values below
, all product ions are still within the volume where they can be extracted for detection. Beyond
, the ion products emitted with the largest kinetic energies can leave the detection volume before the pulsed extraction field is applied. The resulting loss of product ions must be considered in the analysis of the data, because for a given total product-kinetic energy, the velocity of
is larger than that of
.
The upper panel of Figure displays as black and blue dots with error bars the normalised relative and
product signals measured for different durations of the reaction-observation window, labelled ‘reaction time(s)’ along the horizontal axis. For short reaction times, the signals grow linearly with τ, but the signal growth slows down beyond
because of the loss of the fastest products mentioned above. To account for the product losses, we simulate the trajectories of the product ions from the time they are emitted to the time they are detected, taking into account the stray field in the reaction volume and assuming (i) that the velocity distribution can be scaled from the distributions measured at higher collision energies by Pollard et al. [Citation48] and (ii) that the product emission is isotropic in the laboratory frame at the very low collision energies studied here. These assumptions are explained further and justified in Subsection 3.3 (see also Ref. [Citation45]). The simulations enable us to determine the expected relative product-ion signals taking into account the loss of the fastest products. The results are plotted as full red and orange lines in Figure (a). Correcting the product-ion signals for these losses leads to the branching ratios depicted in the lower panel of Figure . Apart from a very small fluctuation, which we attribute to a weak variation of the background signal that is not entirely corrected by the background subtraction, the branching ratios extracted from the measurements performed up to
consistently yield a value of 0.341(15) for η. The D-atom-transfer channel is therefore approximately twice less likely than the proton-transfer channel at low collision energies.
Figure 4. (a) Relative intensities of the (black data points) and
(blue data points) products of the
reaction at low collision energies. The light-blue and gray data points indicate the individual measurements. The red and orange lines represent the simulated detection efficiencies of
and
, respectively, used to determine the branching ratio. (b) Branching ratio of the
reaction channel. The full red lines represent the weighted mean value of the experimental data corrected for the detection efficiency and the dashed red lines the standard deviation.
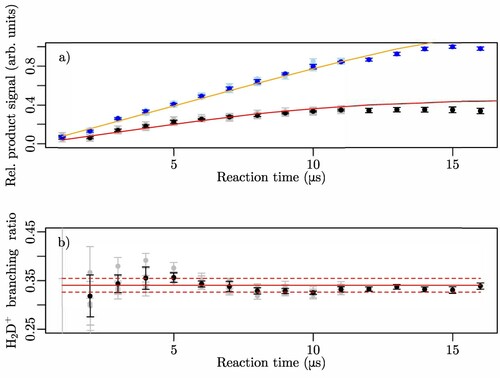
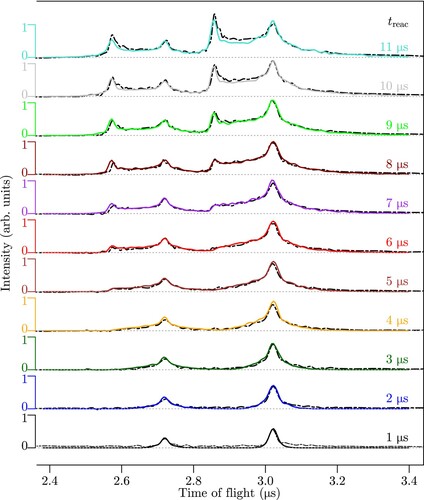
Figure 5. TOF spectra of the products of the reaction measured after reactions times ranging from 1 to 11
when operating the TOF-mass spectrometer so as to obtain information on the product velocity distributions. The signals at about 2.7 and 3.2
correspond to
and
, respectively. The experimental and simulated data are shown as black dashed lines and full coloured lines, respectively. See text for details.
This η value significantly differs from the ‘statistical’ value of 0.5 one would get by drawing either the H- or the D-atom product from the four atoms of the collision complex. This observation indicates that the reaction between and
(and deuterated species) follows a fast and direct mechanism, in accord with the results of earlier investigations at higher collision energies [Citation25,Citation49–53]. The lower yield of the
product channel compared to that of the
+ H product channel is also predicted by recent quasi-classical calculations, which determined a branching ratio of about 0.3 at a collision energy of 0.01 meV [Citation54].
3.3. Mean product kinetic energy
To obtain information on the product-kinetic-energy distribution, we carry out measurements of the TOF distributions of the product ions for different durations τ of the reaction-observation window, as for the determination of the branching ratios. However, instead of setting the potentials on the electrodes of the ion-extraction stack so as to approximate Wiley-McLaren conditions, we only apply an extraction potential to the bottom (repeller) plate of the stack and set the other two electrodes to ground potential. Under these conditions, the flight times of the product ions depend on their location at the extraction time. Ions originally emitted towards the detector experience a smaller acceleration potential than those emitted towards the repeller plate and reach the detector after a longer flight time. Consequently, the widths and shapes of the product-ion signals in the TOF spectrum provide information on their kinetic-energy distributions.
Figure presents the TOF distributions of the and
product ions obtained when extracting the ions after reaction-observation windows of durations τ ranging from 1 to 11
. For small τ values, the distributions are narrow and symmetric and reflect the fact that the product ions are still located close to the reaction volume. As τ increases, the TOF profiles broaden on both sides because ions released at the beginning of the reaction-observation window have had more time to move away from the reaction volume. The central peak of the distribution remains roughly unchanged and corresponds to product ions emitted just before the end of the reaction-observation window. After 5–6
, a second peak forms on the early TOF-side of the distributions. This peak originates from a focussing effect affecting the product ions that have moved close to the repeller plate and which are accelerated by the larger potential difference, as discussed in Ref. [Citation45].
We simulate the time-of-flight profiles by a Monte-Carlo algorithm as described in the following (see also Ref. [Citation45]). Reaction products are created along the trajectory of the -Rydberg-molecule cloud at discrete time intervals in the range
. The product kinetic energy is drawn from a statistical distribution modelled according to the distribution of released kinetic energy measured by Pollard et al. [Citation48] and scaled to account for the different collision energies, as described in our previous studies [Citation42,Citation45]. The direction of the product-ion velocity vectors are drawn from a uniform distribution in the laboratory frame. The ion position is then propagated until the end of the reaction-observation time window. We found it necessary to include a small homogeneous electric field (0.06 V/cm) in the direction of the detector during the propagation of the ion trajectory to obtain quantitative agreement with the experimental data. Numerical particle trajectory simulations using the finite-element ion-trajectory simulation tool SimIon [Citation55] are then employed to decide if, and after which time of flight, the ion reaches the detector. The detected ions are then binned according to their times of flight to generate the simulated time-of-flight profile. The flight times obtained from the SimIon simulation had to be scaled by a few percent to precisely match the positions of experimental and simulated time-of-flight peaks.
The free parameters of the simulation are the mean released kinetic energy, the residual stray field in the extraction volume, and the branching ratio for the two product channels. To determine their values, we numerically minimised the mean squared deviation between simulated and experimental time-of-flight traces simultaneously for all spectra corresponding to reaction times from 4 to 11 . Optimal agreement between experimental and simulated time-of-flight profiles was reached for a mean released kinetic energy of 0.45(5) eV and a residual stray field of 0.06(2) V/cm, the uncertainties being estimated from the mean squared deviations. The product-ion branching ratio determined from the fits is 0.357(20), which agrees with the branching ratio presented in Subsection 3.2 within the error bars. The mean kinetic energy release also closely corresponds to the values derived for the
reaction from similar experiments [Citation45] and represents less than 30% of the reaction exothermicity.
3.4. Reaction rate coefficients
The collision-energy dependencies of the rate coefficients of the and
reactions are presented in Figure (a,b), respectively. The grey data points in this figure were obtained from measurements carried out for numerous combinations of velocities of the ground-state and
-Rydberg beams, such as those depicted in Figure . The rate coefficients were normalised to the values determined at
values above 3 K, where the reaction rates are known to closely follow classical Langevin behaviour [Citation12,Citation25,Citation26,Citation43,Citation56]. For each of these measurements, the collision energy
was obtained from the velocities
and
selected for the Rydberg and ground-state beams, respectively, which we can determine accurately, as demonstrated in Subsection 3.1. Each of these data points corresponds to an average of the product-ion signals generated by collisions involving a range of collision energies
given by
(2)
(2) where
represents the collision-energy resolution at zero collision energy and is equal to
for the
reaction and
for the
reaction, as explained in Section 2.
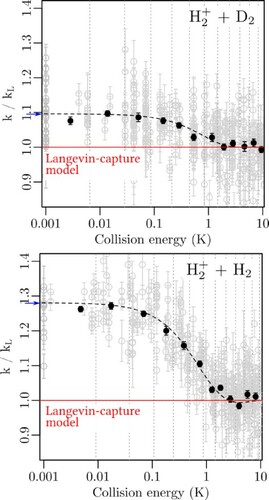
Figure 6. Rate coefficients k relative to the Langevin rate coefficient as a function of the collision energy for a) the reaction
, and b) the reaction
. The grey dots with error bars (one standard deviation) represent individual measurements, the black dots are weighted averages over the regions separated by the dotted grey vertical lines. The dashed black lines correspond to simulations of the experimental results based on the theoretical rate coefficients reported by Dashevskaya et al. [Citation26] for the
reaction, with adequate mass scaling for the
reaction. See text for details.
![Figure 6. Rate coefficients k relative to the Langevin rate coefficient kL as a function of the collision energy for a) the reaction H2++D2, and b) the reaction H2++H2. The grey dots with error bars (one standard deviation) represent individual measurements, the black dots are weighted averages over the regions separated by the dotted grey vertical lines. The dashed black lines correspond to simulations of the experimental results based on the theoretical rate coefficients reported by Dashevskaya et al. [Citation26] for the H2++H2 reaction, with adequate mass scaling for the H2++D2 reaction. See text for details.](/cms/asset/a12fb19a-4708-48a6-83e9-613503c592a0/tmph_a_1954708_f0006_oc.jpg)
The black dots with error bars in Figure represent weighted averages with standard deviations of all individual measurements within the bins delimited by the dotted grey lines. The widths of these bins were selected so that each bin contained approximately the same number of individual measurements.
The rate coefficients obtained for the and
reactions both reveal the same qualitative behaviour. They increase in a step-like manner as the collision energy decreases below 1 K, with a half-rise point at an
value of
indicated by the red crosses in the figure. This rise of the rate coefficient at low collision energies results from the charge-quadrupole electrostatic interaction between
and the neutral molecule (
and
have the same quadrupole moment in the Born-Oppenheimer approximation), as demonstrated earlier for the
reaction [Citation24,Citation26,Citation42].
The amplitude of the rise is, however, qualitatively different and amounts to 28(2)% and 10(1)% for the and
reactions, respectively. This difference by a factor of 2.8(3) in the enhancement can be explained by (i) the different relative populations of the J = 1 rotational level in the two samples, and (ii) the scaling of the deviation from Langevin behaviour with the reduced mass of the collision systems, as is now explained in detail. (i) In a natural sample of jet-cooled
molecules, 3/4 of the molecules belong to the ortho-
nuclear-spin isomer (total nuclear spin I = 1) and occupy the J = 1 rotational level whereas 1/4 of the molecules belong to the para-
nuclear-spin isomer (I = 0) and occupy the J = 0 rotational level. In a jet-cooled sample of
, on the other hand, 2/3 of the molecules are in the J = 0 rotational level and belong to the ortho-
nuclear-spin isomer (I = 0, 2) whereas 1/3 of them are in the J = 1 rotational level of the para-
isomer (I = 1). Molecules in the J = 0 rotational level do not have a quadrupole moment so that only the molecules in the J = 1 level significantly contribute to the enhanced rate coefficients at low collision energies. There are 9/4-times (i.e. 2.25 times) more of them in a cold natural sample of
than in a cold natural sample of
. (ii) The amplitude of the deviation from Langevin behaviour is expected to be approximately the same for the two reactions but to occur over a broader collision-energy range in the collision system having the smaller reduced mass. Dashevskaya et al. [Citation24,Citation26] have demonstrated that the collision-energy width of the deviation scales with the reduced mass as
(see Figure 7 of Dashevskaya et al. [Citation24]). Because the collision-energy and the collision-energy resolution themselves are proportional to μ, the integral over the deviation from Langevin behaviour at low collision energies scales as
. These considerations contribute a factor of
to the expected enhancement factor. On the basis of these simple arguments one therefore expects an overall enhancement factor of
of the deviation from Langevin behaviour for the
reaction compared to the
reaction. This factor, which does not include the slight (about 10%) difference in the effects of ion-quadrupole interaction interaction for the J = 1 level of
and
(see Table III of Ref. [Citation24]), corresponds closely to the observed factor of 2.8(3).
The dashed lines in Figure represent the results of simulations of the observed collision-energy dependence of the rate coefficients based on the scaled capture rate coefficients reported in Figures 2 and 3 of Ref. [Citation26]. The simulations take into account the collision-energy resolution of our measurements and faithfully describe the amplitudes and the high-collision-energy onset of the deviations from Langevin behaviour below 1 K for both reaction systems. This agreement confirms the validity of the theoretical predictions made by Dashevskaya et al. [Citation24,Citation26] as well as the interpretation proposed above within the uncertainty limits of the experimental results.
4. Conclusions
In this article, we have reported the results of an experimental investigation of the and
reaction systems at collision energies in the range
between 0 and 10 K. In these experiments, we rely on a merged-beam approach and observe the ion-molecule reaction within the orbit of a highly excited Rydberg electron, which eliminates heating of the reactant ions by stray electric fields. Using a completely redesigned version of the original experimental setup [Citation42,Citation43], we could improve the energy resolution and the sensitivity of the measurements of the collision-energy dependence of the rate coefficients by factors of 2 and 100, respectively, compared to our previous study of the
reaction [Citation43]. In our experiments, we can now reliably detect changes of 1–2% of the rate coefficients at low energies, which opens up many exciting prospects in the study of low-temperature ion-molecule chemistry and physics. The results presented here demonstrate the ability to control the mean velocities of the beams to better than 20 m/s and the mean collision energy to better than
. We have exploited these advantages to study the deviation from Langevin behaviour at collisions energies below
caused by the ion quadrupole interaction between
and ground-state
and
molecules in the J = 1 rotational level.
For both reaction systems, we could detect a clear enhancement of the reaction rates below 1 K. Whereas the overall shape of the observed rate enhancements was very similar for both reactions, the amplitude of the enhancement was found to be a factor of 2.8(3) larger in the reaction than in the
reaction. This factor could be attributed to (i) the different population of the J = 1 rotational state in the jet-cooled samples of pure
and
samples, and (ii) the scaling with the reduced mass of the deviation from Langevin-capture behaviour at low collision energies. Remarkable quantitative agreement was found between the experimental results and simulations based on the scaled reaction-rate coefficients at low collision energies reported by Dashevskaya, Litvin, Nikitin and Troe [Citation26].
From TOF measurements of the kinetic energy of the products, we found out that the mean kinetic energy released by the reaction at low collision energies is 0.45(5) eV, which is slightly below what would be expected from a purely statistical distribution over all translational and internal degrees of freedom but in accord with our previous results on the reaction and with earlier theoretical results (see, e.g. Ref. [Citation18]).
Finally, we have also determined the branching ratios of the and
product channels of the
reaction to be
and
, respectively, in agreement with recent calculations based on a quasi-classical theoretical treatment [Citation54]. These values differ from the statistical value of 0.5 one would obtain for both channels by drawing the H or D atom product from a sample consisting of two H and two D atoms. The observed branching ratios thus indicate that the reactions follow direct atom- and ion-transfer mechanisms, even at very low collision energies, as they do at higher collision energies (see, e.g. Refs. [Citation25,Citation49–53]).
Acknowledgments
It is a great pleasure to dedicate this article to Professor Jürgen Troe, whose work on cold ion-molecule reactions has been an inspiration for the work presented here. We thank Prof. Octavio Roncero for communicating to us the results of quasi-classical calculations of the reaction prior to their publication. We also thank Dr. Urs Hollenstein, Josef A. Agner and Hansjürg Schmutz for technical support and Dr. Valentina Zhelyazkova and Fernanda B. V. Martins for very insightful discussions on all experimental and theoretical aspects related to the work presented here.
Disclosure statement
No potential conflict of interest was reported by the author(s).
Additional information
Funding
References
- P. Ausloos, editors, Kinetics of Ion-Molecule Reactions Nato Advanced Study Institute Series – Series B: Physics, Vol. 40 (Plenum Press, New York, 1978).
- M.T. Bowers, editors, Gas Phase Ion Chemistry: Vol. 1 and 2 (Academic Press, New York, 1979).
- C.Y. Ng and M. Baer, editors, State-Selected and State-to-State Ion-Molecule Reaction Dynamics: Part 1. Experiment and Part 2. Theory Advances in Chemical Physics, Vol. 82 (John Wiley & Sons, Inc., New York, 1992).
- A. Faure, V. Vuitton, R. Thissen, L. Wiesenfelda and O. Dutuit, Faraday Discuss. 147, 337–348 (2010). doi:https://doi.org/10.1039/c003908j.
- M. Dobrijevic, J.C. Loison, K.M. Hickson and G. Gronoff, Icarus 268, 313–339 (2016). doi:https://doi.org/10.1016/j.icarus.2015.12.045.
- E. Herbst and W. Klemperer, Astrophys. J. 185, 505 (1973). doi:https://doi.org/10.1086/152436.
- E. Herbst, Ann. Rev. Phys. Chem. 46, 27–53 (1995). doi:https://doi.org/10.1146/annurev.pc.46.100195.000331.
- E. Herbst, Space Sci. Rev. 106, 293–304 (2003). doi:https://doi.org/10.1023/A:1024654108167.
- V. Wakelam, I.W.M. Smith, E. Herbst, J. Troe, W. Geppert, H. Linnartz, K. Oeberg, E. Roueff, M. Agundez, P. Pernot, H.M. Cuppen, J.C. Loison and D. Talbi, Space Sci. Rev. 156, 13–72 (2010). doi:https://doi.org/10.1007/s11214-010-9712-5.
- I.W.M. Smith, Annu. Rev. Astron. Astrophys. 49, 29–66 (2011). doi:https://doi.org/10.1146/annurev-astro-081710-102533.
- M. Larsson, W.D. Geppert and G. Nyman, Rep. Prog. Phys. 75, 066901 (2012). doi:https://doi.org/10.1088/0034-4885/75/6/066901.
- T. Oka, Chem. Rev. 113, 8738–8761 (2013). doi:https://doi.org/10.1021/cr400266w.
- D. Gerlich, in Low Temperatures and Cold Molecules, edited by I.M.W. Smith (Imperial College Press, London, 2008), Chap. 3, pp. 121–174.
- T.D. Tran, S. Rednyk, A. Kovalenko, Š. Roučka, P. Dohnal, R. Plašil, D. Gerlich and J. Glosık, Astrophys. J. 854, 25 (2018). doi:https://doi.org/10.3847/1538-4357/aaa0d8.
- C.R. Markus, O. Asvany, T. Salomon, P.C. Schmid, S. Brünken, F. Lipparini, J. Gauss and S. Schlemmer, Phys. Rev. Lett. 124, 233401 (2020). doi:https://doi.org/10.1103/PhysRevLett.124.233401.
- J.B. Marquette, B.R. Rowe, G. Dupeyrat, G. Poissant and C. Rebrion, Chem. Phys. Lett. 122, 431 (1985). doi:https://doi.org/10.1016/0009-2614(85)87241-9.
- D.C. Clary, Mol. Phys. 54, 605–618 (1985). doi:https://doi.org/10.1080/00268978500100461.
- C.W. Eaker and G.C. Schatz, J. Phys. Chem. 89, 2612–2620 (1985). doi:https://doi.org/10.1021/j100258a036.
- J. Troe, J. Chem. Phys. 87, 2773 (1987). doi:https://doi.org/10.1063/1.453701.
- D.C. Clary, Annu. Rev. Phys. Chem. 41, 61–90 (1990). doi:https://doi.org/10.1146/annurev.pc.41.100190.000425.
- J. Troe, J. Chem. Phys. 105, 6249 (1996). doi:https://doi.org/10.1063/1.472479.
- M. Auzinsh, E.I. Dashevskaya, I. Litvin, E.E. Nikitin and J. Troe, J. Chem. Phys. 139, 084311 (2013). doi:https://doi.org/10.1063/1.4819062.
- M. Auzinsh, E.I. Dashevskaya, I. Litvin, E.E. Nikitin and J. Troe, J. Chem. Phys. 139, 144315 (2013). doi:https://doi.org/10.1063/1.4821589.
- E.I. Dashevskaya, I. Litvin, E.E. Nikitin and J. Troe, J. Chem. Phys. 122, 184311 (2005). doi:https://doi.org/10.1063/1.1889425.
- C. Sanz-Sanz, A. Aguado, O. Roncero and F. Naumkin, J. Chem. Phys. 143, 234303 (2015). doi:https://doi.org/10.1063/1.4937138.
- E.I. Dashevskaya, I. Litvin, E.E. Nikitin and J. Troe, J. Chem. Phys. 145, 244315 (2016). doi:https://doi.org/10.1063/1.4972129.
- M. Drewsen, I. Jensen, J. Lindballe, N. Nissen, R. Martinussen, A. Mortensen, P. Staanum and D. Voigt, Int. J. Mass Spectrom. 229, 83–91 (2003). doi:https://doi.org/10.1016/S1387-3806(03)00259-8.
- M.T. Bell and T.P. Softley, Mol. Phys. 107, 99 (2009). doi:https://doi.org/10.1080/00268970902724955.
- M. Drewsen, Physica B 460, 105 (2015). doi:https://doi.org/10.1016/j.physb.2014.11.050.
- S. Willitsch, Int. Rev. Phys. Chem. 31, 175–199 (2012). doi:https://doi.org/10.1080/0144235X.2012.667221.
- S. Willitsch, Adv. Chem. Phys. 162, 307–340 (2017). edited by S.A. Rice and A.R. Dinner.
- A.D. Dörfler, P. Eberle, D. Koner, M. Tomza, M. Meuwly and S. Willitsch, Nat. Comm. 10, 5429 (2019). doi:https://doi.org/10.1038/s41467-019-13218-x.
- S.T. Pratt, J.L. Dehmer, P.M. Dehmer and W.A. Chupka, J. Chem. Phys. 101, 882–890 (1994). doi:https://doi.org/10.1063/1.467741.
- M. Matsuzawa, Phys. Rev. A 82, 054701 (2010). doi:https://doi.org/10.1103/PhysRevA.82.054701.
- E. Wrede, L. Schnieder, K. Seekamp-Schnieder, B. Niederjohann and K.H. Welge, Phys. Chem. Chem. Phys. 7, 1577–1582 (2005). doi:https://doi.org/10.1039/b417440b.
- S.R. Procter, Y. Yamakita, F. Merkt and T.P. Softley, Chem. Phys. Lett. 374, 667–675 (2003). doi:https://doi.org/10.1016/S0009-2614(03)00812-1.
- E. Vliegen, S.D. Hogan, H. Schmutz and F. Merkt, Phys. Rev. A 76023405 (2007). doi:https://doi.org/10.1103/PhysRevA.76.023405.
- Ch. Seiler, S.D. Hogan and F. Merkt, Phys. Chem. Chem. Phys. 13, 19000–19012 (2011). doi:https://doi.org/10.1039/c1cp21276a.
- S.D. Hogan, EPJ Tech. Instrum. 3, 2 (2016). doi:https://doi.org/10.1140/epjti/s40485-015-0028-4.
- F. Merkt, Molecular-physics aspects of cold chemistry, in Current Trends in Atomic Physics, edited by A. Browaeys et al. (Oxford University Press, Oxford, 2019).
- V. Zhelyazkova, M. Žeško, H. Schmutz, J.A. Agner and F. Merkt, Mol. Phys. 117 (21), 2980–2989 (2019). doi:https://doi.org/10.1080/00268976.2019.1600060.
- P. Allmendinger, J. Deiglmayr, K. Höveler, O. Schullian and F. Merkt, J. Chem. Phys. 145, 244316 (2016). doi:https://doi.org/10.1063/1.4972130.
- P. Allmendinger, J. Deiglmayr, K. Höveler, O. Schullian and F. Merkt, ChemPhysChem 17, 3596–3608 (2016). doi:https://doi.org/10.1002/cphc.201600828.
- V. Zhelyazkova, F.B.V. Martins, H. Schmutz, J.A. Agner and F. Merkt, Phys. Rev. Lett. 125, 263401 (2020). doi:https://doi.org/10.1103/PhysRevLett.125.263401.
- K. Höveler, J. Deiglmayr, J.A. Agner, H. Schmutz and F. Merkt, Phys. Chem. Chem. Phys. 23, 2676–2683 (2021). doi:https://doi.org/10.1039/D0CP06107G.
- P. Allmendinger, J. Deiglmayr, J.A. Agner, H. Schmutz and F. Merkt, Phys. Rev. A 90, 043403 (2014). doi:https://doi.org/10.1103/PhysRevA.90.043403.
- W.C. Wiley and I.H. McLaren, Rev. Sci. Instr. 26, 1150–1157 (1955). doi:https://doi.org/10.1063/1.1715212.
- J.E. Pollard, D.J. Trevor, J.E. Reutt, Y.T. Lee and D.A. Shirley, J. Chem. Phys. 81, 5302–5309 (1984). doi:https://doi.org/10.1063/1.447672.
- A.B. Lees and P.K. Rol, J. Chem. Phys. 61, 4444–4449 (1974). doi:https://doi.org/10.1063/1.1681762.
- J.R. Krenos, K.K. Lehmann, J.C. Tully, P.M. Hierl and G.P. Smith, Chem. Phys. 16, 109–116 (1976). doi:https://doi.org/10.1016/0301-0104(76)89028-3.
- C.H. Douglass, D.J. McClure and W.R. Gentry, J. Chem. Phys. 67, 4931–4940 (1977). doi:https://doi.org/10.1063/1.434675.
- P.M. Hierl and Z. Herman, Chem. Phys. 50, 249–254 (1980). doi:https://doi.org/10.1016/0301-0104(80)87042-X.
- J.E. Pollard, L.K. Johnson, D.A. Lichtin and R.B. Cohen, J. Chem. Phys. 95, 4877–4893 (1991). doi:https://doi.org/10.1063/1.461704.
- O. Roncero, Private communication.
- SIMION 3D, version 8.1. (Scientific Instrument Services, Inc., Ringoes, NJ, USA, 2012).
- T. Glenewinkel-Meyer and D. Gerlich, Israel J. Chem. 37, 343–352 (1997). doi:https://doi.org/10.1002/ijch.v37.4.