
 ?Mathematical formulae have been encoded as MathML and are displayed in this HTML version using MathJax in order to improve their display. Uncheck the box to turn MathJax off. This feature requires Javascript. Click on a formula to zoom.
Abstract
We have known for over 200 years that hydrogen undergoes rapid oxidation to water on Pt catalysts; yet the reaction mechanism remains unclear. Here, we report high temporal resolution measurements of the production rate of H2O from hydrogen oxidation catalysed by a Pt (111) single crystal surface with a known concentration of adsorbed oxygen atoms and a step density of approximately 0.002 ML. We obtain two rate constants describing the rise, and fall of the reaction rate between 350 and 470 K and compare our observations to modern ab initio predictions of the reaction rates in surface chemistry. Remarkably, a mechanism based on a standard set of elementary reaction steps with energies and barrier heights obtained from Density Functional Theory (DFT), predicts a rate that is four orders of magnitude smaller than observed experimentally. Furthermore, the theoretically predicted reaction rate follows first-order kinetics, whereas the experimental observations clearly show a second-order reaction. The theoretical predictions are robust – six different exchange–correlation functionals lead to similar predictions. We suggest that the reason for these disagreements is that the active sites of the catalyst and the associated elementary reactions have, so far, not been properly identified.
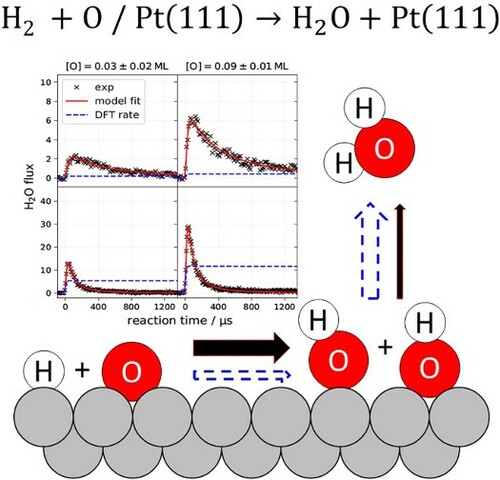
GRAPHICAL ABSTRACT
1. Introduction
The catalytic reaction of hydrogen (H2) and oxygen (O2) on Pt to produce water has an illustrious history dating back over 200 years to the work of Davy [Citation1] and Döbereiner [Citation2]. They found that at room temperature, metallic Pt could induce the hydrogen oxidation reaction and it was so rapid that the Pt sample they used glowed white-hot. Inspired by this discovery of ‘flame without flint’ and related work in other laboratories, Berzelius introduced the word catalyst in 1835 to describe ‘substances … able to awaken (chemical) affinities … by their mere presence … ’ [Citation3].
Study of hydrogen oxidation also played an important role in Langmuir’s early investigations of surface chemical processes. In 1921, he showed, using remarkably simple experiments involving pressure measurements, that the reaction proceeds via initial dissociation of H2 and O2 at the Pt surface, followed by reaction of adsorbed H and O to form water [Citation4], what we now call the Langmuir–Hinshelwood mechanism.
Because of its chemical simplicity, the catalytic reaction of oxygen and hydrogen on Pt remains of great interest to this day as an important model system for the study of heterogeneous catalysis. We now have a wealth of detailed information about this reaction based on extensive work using greatly improved vacuum technology, sensitive gas-phase detection techniques, and a host of new tools provided by the emergence of the field of surface science, and insights gained from theoretical chemistry. Mass spectrometric and quartz crystal microbalance (QCM) measurements provided information about reaction rates under steady state and transient titration conditions [Citation5,Citation6]. Information on onset temperatures and barriers came from temperature-programmed reaction and desorption (TPR, TPD) [Citation6–8]. Molecular beam scattering allowed measurement of angular and speed distribution of desorbing products, providing clues about the dynamics of the desorption process [Citation9–11]. Modulating the molecular beams and using molecular beam relaxation spectroscopy (MBRS) tested kinetic models and provided experimental values for the reaction barriers and prefactors [Citation10–13]. Laser induced fluorescence (LIF) made it possible to see desorbing OH reaction intermediates [Citation14,Citation15]. To further probe reaction products and intermediates, surface sensitive techniques have proven useful, including X-ray and UV photoemission spectroscopy (XPS, UPS) [Citation16,Citation17], electron energy loss spectroscopy (EELS) [Citation18–20], and secondary ion mass spectroscopy (SIMS) [Citation21,Citation22]. Atomic scale images of reactions as they proceed are available from scanning tunnelling microscopy (STM) [Citation23,Citation24]. The development of theory and simulation has also been important. DFT calculations in particular provide values for enthalpies of reactants, intermediates, and products, and barriers to elementary reaction steps, some of which may not be available from experiment [Citation25–30].
Most of the work to date agrees with Langmuir’s conclusion: the reaction proceeds via a mechanism starting with adsorbed O and H atoms, although, there are also suggestions that a molecular hydrogen precursor state or hot H atoms could play an important role [Citation8,Citation19,Citation31]. There are also suggestions that the reaction mechanism must include a central role for minority defect sites [Citation13,Citation32,Citation33].
The elementary reactions that could be involved for this Langmuir–Hinshelwood mechanism appear, at first sight, to be simple; these include:
(1)
(1)
(2)
(2)
(3)
(3)
(4)
(4)
(5)
(5)
(6)
(6)
Here asterisks indicated adsorbed atoms (H*, O*) and molecules (OH*, H2O*) as well as surface vacancies (*). Two possible pathways to water formation are sequential addition of H*, reactions (3) and (4), and OH disproportionation, reactions (3) and (5). To help visualise these reactions we show an enthalpy diagram illustrating the species involved in Figure . The figure shows experimental values for the enthalpy of each species derived from TPD [Citation34] and microcalorimetery measurements [Citation35] along with DFT values for both the energies and reaction barriers calculated in this work.
Figure 1. Energy diagram of relevant steps in the H2 oxidation on Pt(111) under conditions where solvation effects are unimportant. The experimental enthalpies at 298 K (black lines) and their uncertainties (grey shaded regions) are reconstructed from Ref. [Citation35]. Calculated energies and barrier heights using the PW91 exchange-correlation functional are shown as purple lines. The calculated energies are without zero-point energy correction.
![Figure 1. Energy diagram of relevant steps in the H2 oxidation on Pt(111) under conditions where solvation effects are unimportant. The experimental enthalpies at 298 K (black lines) and their uncertainties (grey shaded regions) are reconstructed from Ref. [Citation35]. Calculated energies and barrier heights using the PW91 exchange-correlation functional are shown as purple lines. The calculated energies are without zero-point energy correction.](/cms/asset/a9124c08-6798-47cd-997d-d14c613d2c8d/tmph_a_1966533_f0001_oc.jpg)
Despite extensive study, we still do not know which elementary reaction steps lead to water formation. Specific uncertainties include the enthalpies of intermediates, the influence of co-adsorption and coverage on enthalpies. The heights of activation barriers also remain uncertain. Furthermore, experimentally derived activation energies are not consistent [Citation12,Citation19,Citation22,Citation36] and cannot be reconciled with theoretical values for barriers [Citation25–30]. The influence of surface preparation and defects [Citation10,Citation11,Citation13], the reaction pathway, and the rate limiting steps are also still in dispute.
Some of the confusion surrounding the reaction pathway arises because the reaction mechanism may be dependent on temperature as well as H2/O2 ratio and related coverages of H* and O*. For example, Kasemo and coworkers investigated the high temperature kinetics of hydrogen oxidation on polycrystalline Pt [Citation15,Citation37], where OH* desorbs competitively with its consumption by reactions (4) and (5). They could detect both desorbing OH and H2O [Citation15]. By modelling the kinetics, the authors inferred qualitative features of the reaction mechanism [Citation37], surmising that reaction (4) dominates the consumption of OH* at high temperature, when excess surface hydrogen is available while reaction (5) is more important at lower temperatures under conditions of excess surface oxygen [Citation37].
Adding to the complexity, hydrogen oxidation also occurs far below room temperature [Citation17,Citation20,Citation23], following a quite different mechanism. Using TPD and XPS, hydrogen oxidation could be observed at 120 K and initially reaction (2) is important to generate a small concentration of OH* followed by addition of H*, reaction (3), generating H2O*. Remarkably, H2O* catalyses further reaction
(7)
(7) as shown by STM, HREELS and LEED [Citation20,Citation23]. This work also showed that the OH* product of reaction (7) formed between 130 and 170 K remains stable after water has desorbed at 170 K. This implies there must be a substantial activation barrier for OH disproportionation, reaction (5), in the absence of adsorbed water; contradicting this, DFT calculations predict no barrier for this reaction [Citation28,Citation38].
How can it be that such a seemingly simple reaction remains such a puzzle after two centuries of scientific investigation? One reason is the lack of high temporal resolution kinetic data from which the influence of the individual reaction steps might be observed. In this paper, we provide such data using the newly developed velocity resolved kinetics technique [Citation39,Citation40]. The observable in our measurements is the time dependent flux of water, a quantity that is identical to the instantaneous rate of water production. We observe this quantity after a short H2 beam pulse initiates the reaction on a Pt(111) surface with adsorbed oxygen atoms held at a known steady state concentration. The product flux vs. reaction time curve, denoted the kinetic trace, provides direct information on the kinetics of hydrogen oxidation on Pt with much better time resolution than previouslypossible.
We have chosen the conditions of the measurements aiming to minimise or eliminate the complexities described above. Specifically, we use moderate temperatures similar to those of practical catalytic temperatures, avoiding low temperatures where high H2O concentrations make modelling more difficult due to autocatalytic reaction. We also restricted our work to conditions with low to moderate O* coverage, where O* islands should not be present [Citation41].
Under these conditions, the kinetic trace shows a rapid onset followed by a decaying water production rate obeying second-order kinetics. We obtain activation energies for the initiation reaction and the second-order decay. This strongly suggests that the initiation reaction (3) is rapid at modest temperatures, contradicting the DFT prediction that the reaction is slow due to a high barrier. The second-order decay is most simply explained if the limiting step was OH disproportionation, reaction (5). This, however, contradicts the DFT prediction that OH disproportionation has essentially no activation barrier on Pt(111) and thus should not be rate limiting.
Because of the strong disagreement between our results and predictions based on DFT, we performed new DFT calculations to investigate if a different choice of the exchange–correlation functional would influence the predicted rates. This proved not to be the case; the DFT energies and barriers are not sensitive to the choice of six different functionals tested in this work. We suggest that the stark disagreement between experimental results and DFT predictions is not due to an error in experiment or theory, but rather to a failure in understanding the reactive sites and / or reaction intermediates.
2. Methods
2.1. Experimental
To obtain information on the reaction rate, we used the recently developed velocity resolved kinetics technique [Citation39,Citation40,Citation42]. Two differentially pumped molecular beams delivered short pulses of O2 and H2 to the surface of a Pt(111) crystal, which was cleaned by Ar+ sputtering and annealed to recover surface order. The Pt(111) crystal of this study has a reported miscut angle which would result in a step density of <0.002 ML. The H2 beam had an exposure of
monolayer (ML) per pulse and a 25 Hz repetition rate. We varied the repetition rate of the O2 beam, which produced an exposure of
ML/pulse, between 50 and 500 Hz to control the average oxygen coverage during reaction and measured the coverage by titration as previously described [Citation39,Citation43]. The two molecular beams run asynchronously and both had a translational incidence energy of 0.09 eV. The temporal profile of the H2 beam was measured independently and was well represented by a Gaussian function with a full width at half maximum of
.
To detect desorbing and scattered molecules we focused a high power pulsed laser (Astrella ultrafast Ti:Sapphire laser from Coherent® Inc.) to ionise the molecules by non-resonant multiphoton ionisation about 2 cm in front of the Pt surface. Slice ion imaging [Citation44] provided information about the velocities of the ions and allowed selection of the mass of the detected ion. By scanning the delay between the incident H2 pulse and the ionising laser pulse, we obtain the temporal profile of the product and a corresponding ion image for each value of the temporal delay. Since the ion signal is proportional to product density, we used the velocity obtained from the ion image to convert to product flux. We also used the velocity to determine the flight time of the water molecules from the Pt surface to the laser focus, which has no relevance to the kinetics. We subtract this time from the time axis of the kinetic trace. Due to uncertainties associated with the exact surface to laser distance we have uncertainty of
for the reaction time axis. In this way, we obtain the product flux, i.e. the
formation rate, as a function of reaction time on the Pt surface. Under the conditions of our experiments, the coverage of adsorbed hydrogen was much less than that of adsorbed oxygen,
. The oxygen coverage was at quasi steady state, only slightly perturbed by the hydrogen pulse. Essentially all the hydrogen introduced by one H2 beam pulse is consumed before the next pulse arrives.
2.2. Computational
We used the Vienna Ab-initio Simulation Package (VASP) to perform the periodic DFT calculations [Citation45] applying a variety of exchange–correlation functionals based on the generalized-gradient approximation (GGA) or the meta-generalized-gradient approximations (meta-GGA) in order to test the effect of different functionals on the computational results.
The electron-ion interactions were described by the projector augmented wave (PAW) method [Citation46], with a cutoff energy of 400 eV for the plane-wave basis. The Pt(111) surface was modelled by a four-layer periodic slab with each layer containing a p(3×3) supercell. The bottom layer was fixed during optimisation. A 15 Å vacuum region was added to the slab to avoid interaction in the z-direction. The numerical integration of the Brillouin zone was performed on a (3×3×1) Monkhorst−Pack k-point mesh. The transition states were located by the climbing image nudged elastic band (CI-NEB) method [Citation47].
To determine how much the reaction energies and barriers for these reactions vary with the choice of exchange correlation functional, we tested six functionals: (i) Perdew–Wang 91 (PW91) [Citation48], (ii) Perdew−Burke−Ernzerhof (PBE) [Citation49], (iii) revised-Perdew–Burke–Ernzerhof (RPBE) [Citation50], (iv) vdW-DF1 (DF1) [Citation51], (v) optB86b-vdW (opt86) [Citation52], and (vi) Minnesota 2006 local functional (M06-L) [Citation53]. The first three are the GGA type. PW91 and PBE are very similar and typically underestimate barrier heights while RPBE tends to overestimate barrier heights. One drawback of GGA functionals is that they are not capable of describing the long-range dispersion interaction, which we treat using functionals (iv) and (v). The last functional is a meta-GGA functional parameterised to reproduce a high-quality benchmark database.
3. Results
The velocity resolved kinetics method used here provides angular and speed resolved measurements of reaction products as a function of the time from initiation of the reaction by a pulse of H2 on a Pt(111) surface with a quasi-steady state coverage of O*. As described in section 2.1, these data allow us to construct the kinetic trace while at the same time obtaining information about the dynamics of the reaction. Before examining the kinetic trace, it is interesting to look at the product angular and speed distributions to gain information about the dynamics of the product formation and desorption.
3.1. Product angular and speed distributions
We measured the angular and speed distributions of water desorbing from the surface with a beam incident on Pt(111) with a steady state
coverage (
). The distribution of flux as a function of the polar angle,
, was close to a
function. The speed distribution obeyed a Maxwell–Boltzmann law with a slightly lower characteristic temperature than that of the surface. These results are consistent with the detailed balance predictions for equilibrium desorption of H2O molecules when their sticking probability decreases with increasing velocity in the range of observed velocities, ∼ 1200 m/s [Citation54]. There is no indication in the observed velocity distribution of multiple reaction channels, as was the case for CO oxidation on Pt(111) [Citation39]. This, of course, does not rule out the possibility of multiple reaction channels but says only that, if multiple channels are present, none exhibits non-equilibrium desorption dynamics.
3.2. Reaction kinetics
Measurements of the kinetic trace are shown in Figure for a steady state O* coverage of and four surface temperatures. The left column shows a linear scale plot of the flux, normalised to the peak intensity as a function of reaction time. The insets in the left column show the rising edge of the kinetic trace compared to the accumulated H2 molecular beam pulse,
, defined as:
(8)
(8) shown as a blue-dashed line in Figure . Here,
is the instantaneous flux of H2 incident on the surface as a function of time,
, while
is the total amount of H2 delivered to the surface up until time
. Note that, for all but the highest temperature, there is an observable delay between arrival of H2 and appearance of H2O.
Figure 2. Kinetic traces of hydrogen oxidation to water on Pt(111) for various , as indicated. Left column: linear plots with insets showing the initial rise. Dashed blue line is the accumulated
beam flux that initiates the reaction. Note the small delay in the onset for all temperatures except 448 K. Right column: linearised second-order plots, i.e.
flux vs. time. Dash-dotted red lines are displayed to guide the eye. The O* coverage is 0.14 ± 0.02 ML in all panels. The H2O flux is peak normalised to 1.
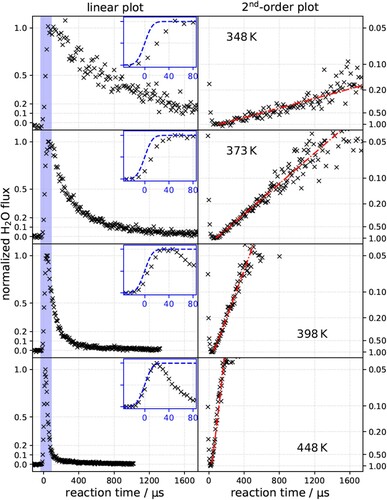
The observed kinetic trace also shows that the rate-limiting step in the formation reaction is characteristic of a second-order process. For second-order kinetics, plotting
vs. reaction time gives a straight line. To see this, consider a second-order reaction scheme where an intermediate A produces water,
(9)
(9) and its corresponding differential equation,
(10)
(10)
After integration, the flux of H2O takes the following form,
(11)
(11) where
is the initial concentration of A. In our velocity resolved kinetics experiment, we obtain the relative flux
, which is proportional to
so
(12)
(12)
Plotting vs time, gives a straight line if the reaction under consideration is second-order. The right hand column of Figure displays this linearisation of the H2O flux from our experiments. The linearity shows the H2O formation reaction follows second-order kinetics between 350 and 470 K. Note that because
. appears in Equation (12), without a priori knowledge of
,
cannot be derived from the slope.
3.3. Fit of kinetic trace data to a reaction rate model
Figure shows the two characteristic features of the kinetic traces seen in this work – the initial rise and the second-order decay. We will now develop a simple reaction model capable of describing both features. We use the following basic reaction scheme.
(13)
(13)
(14)
(14)
(15)
(15)
Intermediate A is populated by the H2 from the molecular beam. The temporal profile of the molecular beam flux is given by . The intermediate A subsequently converts to intermediate B with the rate constant
. This process is responsible for the initial rise of the trace. The intermediate B can recombine with another B with rate constant
to form H2O. This process is responsible for the decay of the H2O formationrate.
For generality, we have constructed this scheme referencing only the products and reactants without assigning the intermediate species involved. The most obvious assignment would be to and
Then, in reaction (14),
would depend parametrically on
and
, which are constant during the reaction and thus do not appear. Despite the appealing simplicity of this assignment, we resist claiming that our work proves that the reaction mechanism involves the disproportionation reaction as the rate limiting step. With additional high quality data, other reaction mechanisms may turn out to explain the results as well or better. We discuss these issues in greater detail below.
Based on reactions (13)-(15) we construct a fitting function derived from the differential equations below:
(16)
(16)
(17)
(17)
Integrating the differential equations numerically, we obtain the transient rate of H2O formation from the corresponding concentration-time profiles:
(18)
(18)
We then fit the H2O kinetic traces individually to the rate model by optimising and
.
In Figure we show the experimental kinetic traces (black crosses) for three surface temperatures between 373 and 473 K and for oxygen atom coverages between 0.03 and 0.14 ML along with the results of the fitted rate model fit (red solid line).
Figure 3. Kinetic traces for hydrogen oxidation to water on Pt(111) for various temperatures and oxygen coverages with comparison to theoretical predictions. The red line shows the results of a simplified three-step kinetic model fit individually to experimental data (×) for each set of conditions. The blue dashed line shows the predictions of the standard mechanism using DFT and TST derived rate constants. The integral of experimental data over reaction time reflects the relative H2O yield, which increases with temperature and oxygen coverage. The rate of the standard mechanism is uniformly but arbitrarily scaled to compare to relative H2O fluxes obtained experimentally.
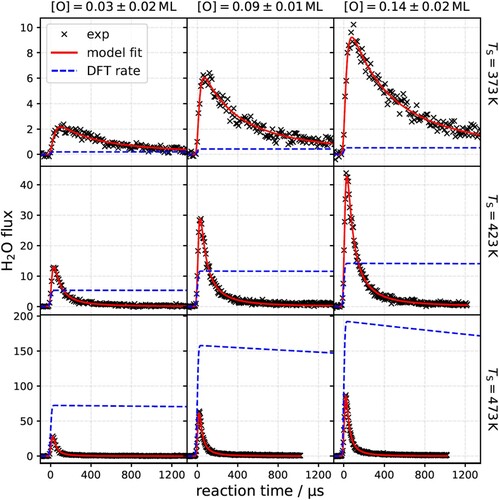
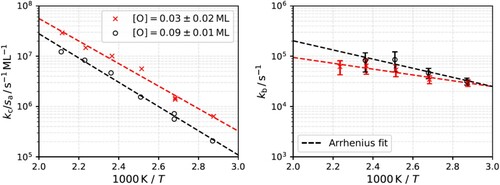
Figure 4. Reaction rate constants (symbols) derived from the simplified three-step kinetic model. Red and black dashed lines are the Arrhenius fits. The Arrhenius rate parameter derived for initiation rate constant are
and
and for the 2nd order rate-limiting water production rate constant,
, are
and
.
The fits yield values for and
but as we have shown in Equation (12), the shape of the kinetic trace depends on the second-order rate constant,
, and
, which is proportional to
. Thus the second-order rate constant derived from the kinetic mechanism is proportional to
.
Figure shows the temperature dependence of the extracted rate parameter and
for two values of the O* coverage. The temperature dependence allows us to perform an Arrhenius analysis. For the initiation reaction,
, we find an activation energy of
eV. Furthermore, within our ability to measure it,
is only weakly dependent on oxygen coverage. The corresponding Arrhenius prefactor,
, is unphysically low indicating that the rise time of the kinetic trace is probably not resulting from an elementary process. It is interesting to note that such low prefactors and low activation energies were used to describe the conversion of CO molecules from the terrace to the step in an ad hoc manner [Citation39]. We cannot exclude that the initial rise observed here arises from the conversion of an intermediate from one to another, more reactive binding site.
For the second-order rate constant , we find an activation energy of
. As noted above, it is not possible to determine the pre-exponential factor for a second-order rate constant without some knowledge or assumptions about the initial concentration of the participating reactants. By assuming that the H2 sticking probability is
[Citation55] for
, and recalling that hydrogen recombination and desorption are unimportant at our conditions, we estimate the initial concentration to be on the order of
. This allows us to estimate the prefactor to be
, a value that is in line with values expected within the framework of transition-state theory (compare also Table ).
Since we do not measure the absolute flux of H2O, the absolute value of is meaningless and used only to normalise the amplitude of the fitted function to the experimental kinetic trace shown in Figure . Despite this, comparing the
values obtained at different temperatures and O* coverages is meaningful. The nine panels shown in Figure accurately reflect the relative yield of H2O, which is proportional to
, as a function of temperature and O* coverage. Here we define the yield as the velocity and time integrated H2O flux. Inspection of Figure reveals that the yield of water increases both with temperature and O* coverage. This is shown explicitly in Figure .
Figure 5. Experimentally derived water yield vs. surface temperature and oxygen coverage. The yield is obtained by integrating the kinetic trace over all velocities and time. The absolute yield per hydrogen molecule could be obtained if the absolute flux of water were known. Here the scaling of H2O yield is arbitrary.
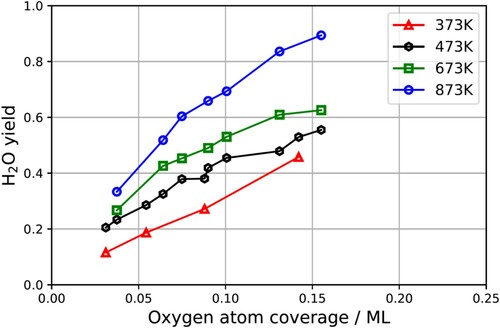
Figure shows that the yield increases with temperature and O* coverage between 0.03 and to 0.16 ML; furthermore the dependence of yield on coverage is approximately linear at all surface temperatures. There is some uncertainty about the coverage for the two highest temperatures, due to a lack of calibration data. While we have calibration data for the steady-state oxygen coverage as a function of the flux ratio of incident oxygen and hydrogen for 373 and 473 K and they exhibit no surface temperature dependence, we lack such data for the two highest surface temperatures. We assumed there was also no temperature dependence to the calibration at these temperatures.
An increase of the product yield with temperature and O* coverage reflects an increasing reactant sticking probability and/or an increasing probability that the reactant leads to product formation rather than desorption producing H2. The increasing product yield, reveals an inconsistency with the assignment of the second-order reaction to OH disproportionation. In that case, we would expect that the transient reaction rate would also increase with increasing yield – as yield is proportional to (assumed in this scenario to be proportional to [OH*]0) However, the kinetic traces presented in Figure do not show this behaviour. This lack of dependence of the shape of the kinetic traces on yield suggests that the simple interpretation of the second-order reaction as OH* disproportion may not becorrect.
3.4. Modelling H2 oxidation rates with the standard mechanism
The experimental data presented in the previous sections give the transient rate of H2O formation and show an increase of the H2O yield with temperature and oxygen atom coverage. A proper kinetic model should be able to reproduce the observed features. In this section, we attempt to model the experimental observations by using a full kinetic model with rate constants obtained from ab initio calculations.
Equations (1)–(6) describe the elementary steps of what might be called the ‘standard mechanism’ for the catalytic reaction of hydrogen and oxygen on a Pt surface at moderate temperatures. Nearly all previous work used these elementary steps, or a subset thereof. Exceptions are work dealing with low temperatures, where additional elementary reactions involving adsorbed water are involved, or work dealing explicitly with the role of precursor states or defects. To compare our experimental results with the predictions of this standard mechanism, we solve the corresponding system of differential equations numerically using rate expressions derived from DFT. In the following section, we describe, first, how we obtained the reaction barriers and energies for kinetic modelling. We then show results of the theoretical predictions.
3.4.1. DFT calculation of reaction barriers
The elementary reactions steps that are essential for modelling the standard mechanism for hydrogen oxidation on Pt are O* + H* → OH*, OH* + OH* → H2O* + O* and H* + OH* → H2O*, and H2O* → H2O. The last reaction is, however, much faster than other reactions and will not influence the kinetic trace.
To determine the starting and ending structures of each elementary reaction, the adsorption of O, H, and OH on the Pt(111) surface was first investigated with the PW91 functional. From Table , it can be seen that O* strongly favours the fcc site, while H* has no particular energetically preferred binding site. OH* is bound most stably at the bridge site, but can easily move from bridge to top to bridge. It is only slightly destabilised at the fcc site. This is consistent with previous studies[Citation29,Citation56]
Table 1. Adsorption energies of O*, H* and OH* on Pt(111) determined using the PW91 exchange-correlation functional.
Table displays the results of our calculations of the reaction energies and barrier heights, along with values from previous calculations in the literature. Our results are in good agreement with previous work. The enthalpies of reactants and intermediates are also in good agreement with experimental values, as is shown in Figure . The variation in energies and barrier heights with the choice of the functional is small, generally 0.1 eV. A critical point for the modelling is that the path to the first addition of an H atom, O* + H* → OH*, has a barrier 0.9 eV. Wang and co-workers found a slightly lower barrier of 0.79 eV but this is probably due to the smaller p(2 × 2) unit cell they used [Citation57]. As we will see, this high barrier results in a much lower predicted reaction rate than is observed experimentally. Another result that is crucial to the kinetic modelling that the OH* + OH* → H2O* + O* reaction is predicted to be exoergic and barrierless. We emphasise that the energetics obtained with 6 different functionals vary slightly and are consistent with previous calculations[Citation28,Citation30].
Table 2. Reaction energies (ΔE) and barrier heights (E) for elementary steps in the hydrogen oxidation reaction on Pt(111) determined by DFT calculations.
3.4.2. Parametrization of the rate constants
In Table we summarise the Arrhenius rate parameters used to generate the rate predictions of the standard mechanism, following Equations (1) to (6).
Table 3. Arrhenius rate parameters based on DFT calculations that we used to simulate the rate of H2 oxidation on Pt(111) (see blue dashed line of Figure ).
We have used prefactors that were previously determined from Vlachos and co-workers [Citation38] and the energy barriers from our calculations with the PW91 functional. Again, the predictions of the rate model do not change significantly if we use barrier heights from different functionals presented in Table . The rate of H2 oxidation is modelled using the standard mechanism with the best possible parameters provided from DFT – results are shown in Figure as blue dashed lines and clearly fail to describe the experimental observations. In fact, the disagreement in rate of water production is on the order 104. We note that due to the predicted barrier heights of the various reactions, the reaction flux in the standard mechanism shown under the conditions of this experiment is limited by the initiation reaction, reaction (3) and involves only the disproportionationreaction (5).
4. Discussion
4.1. Comparison of experimental results with predictions of DFT and the ‘standard mechanism’
The experimental observations obtained with velocity resolved kinetics (sections 3.2 and 3.3) stand in sharp contrast to predictions of theory (section 3.4) based on DFT and the standard elementary reactions of a Langmuir–Hinshelwood mechanism, reactions (1)-(6). For example, for a coverage of 0.09 ML and =373 K, the experiment shows a reaction with a second-order decay that reaches the
point in about
; theory shows a first-order decay to
in about 13 s, more than 4 orders of magnitude slower. The reason theory shows such a slow first-order decay is clear – theory predicts the rate-limiting step is reaction (3),
with an energy barrier of ∼0.9 eV. All other reactions exhibit small or zero barriers, so the overall reaction is pseudo first-order under the conditions
used in the experiments. The 0.9 eV energy barrier accounts for the slow reaction.
It is tempting to attribute the disagreement between theory and experiment to an error in the DFT barriers or an error in the measured reaction rates. We think both explanations are unlikely. The velocity resolved kinetics technique provides a very direct measurement of the reaction rate as a function of time where the catalytic surface is held under highly controlled conditions – it is inconceivable that there is a large error in the decay time or shape of the decay curve. It is also unlikely the DFT barrier heights could be off by enough to reconcile its predictions with observation. This would require reducing the barrier height for reaction (3) from 0.9 eV to 0.2 eV and increasing the barrier height for
, reaction (5), from 0 eV to
0.45 eV. The robustness of the barrier height results to the choice of exchange correlation functionals suggests errors of this magnitude are unlikely. A recent review of the accuracy of DFT reaction barriers for reactions on surfaces leads to the conclusion that errors are typically less than about 0.2 eV [Citation58].
An explanation that we believe is much more likely is a failure to identify properly the active sites and elementary reactions involved in hydrogen oxidation on Pt. In the modelling we discussed above, an essential problem was that the pathway to the first addition of hydrogen has a high activation barrier. An active site might provide a lower barrier pathway to this crucial first step.
One obvious possibility is that reaction (3) might proceed over a lower barrier at steps, kinks, or other defects. Experiments with surfaces prepared by sputtering or oxygen treatment to change the density of defects suggest that defects at a very low level (∼10−3 ML) can influence the reaction rate [Citation11]. There are also suggestions of the role of a reactive intermediate involving two oxygen atoms formed at an unspecified site with enhanced reactivity [Citation13] and of reaction limited by diffusion of O* to an active site [Citation33]. To examine this possibility, kinetics on well-defined stepped surfaces could be examined.
Another area to explore for solutions to the problem presented by the high barrier for H addition is the possibility that the barrier might be surmounted with the help of dynamical effects. We speculate, for example that hot H atoms formed in the dissociation of incident H2 on the surface might provide a way to overcome the barrier of the H addition reaction, perhaps with further help from tunnelling. This hypothesis can presumably be verified by using deuterium atoms.
4.2. Observation of delayed onset and H2O yields dependence – possible role for precursor and defects
The observation of a delay in the onset to the hydrogen oxidation reaction relative to the incident H2 pulse that initiates the reaction is interesting. Previous experiments did not have sufficient time resolution to see this delay. Our analysis (section 3.3) shows the process that is responsible for the delay is thermally activated with an activation energy of eV. Thus, either all or some of the participating species of this reaction must be in thermal equilibrium with the surface.
In general, the observation of the onset has to do with a build-up of some reactive intermediate, which we cannot specify yet with the information available. The onset delay might arise if the formation site of the reactive intermediate is different from the site where it reacts to produce the product. Thus, the intermediate would have to diffuse to another active site resulting in a delayed onset.
Another possibility is that a molecular precursor state of H2 is involved. If true, this could, in principle, not only account for the delayed onset, it could also help explain the increase in yield with oxygen coverage. The trapping probability into the precursor state might increase if the incident
landed on top of an
or cluster of
, thus giving a higher coverage of adsorbed
In addition a higher oxygen coverage might increase the probability of H2* to directly reacts with O* instead of desorbing. While a precursor mechanism is in principle able to explain the temperature and oxygen atom coverage dependence, it is improbable that a physisorbed H2 molecule can survive on the surface for ∼40
s at 350 K, which would be required to contribute to the onset of the kinetic trace. This would imply that the precursor has a binding energy of at least 0.5 eV, which appears to us to be unlikely.
5. Conclusions and outlook
We have known for over 200 years that oxygen and hydrogen react catalytically on Pt, so rapidly that the Pt catalyst glows white-hot. In this paper, we presented high-resolution kinetics measurements of the rate of reaction that are 3–4 orders of magnitude faster than the predictions of the best first principles theory of the reaction mechanism. Experiment shows a decay curve following second order kinetics, while theory predicts a first order decay. The surprising truth is that we still lack a fundamental understanding of one of the most extensively studied model systems of heterogeneous catalysis. We speculate that this discrepancy is not due to a simple error in either the calculations or experiment. Rather it is due to a fundamental failure of understanding. Either we have failed to identify properly the elementary reaction steps and active sites involved or we have failed to identify dynamical effects and kinetic limitations that could give results beyond those of thermal kinetics.
There are many directions for future research suggested by the results of the present study. One obvious extension of this work is to make high-resolution kinetics measurements on vicinal surfaces with a controlled density of steps. Such experiments proved extremely valuable in unravelling the puzzles of the CO oxidation reaction [Citation39]. It would also be valuable to probe the reaction under more hydrogen rich conditions. Dosing the surface with a high flux hydrogen beam and probing with a pulsed oxygen beam would accomplish this. Additionally, probing with the oxygen beam would eliminate some contributions that are only possible when we initiate the reaction with a hydrogen probe pulse like the possible participation of molecular hydrogen precursor states or the participation of hot atoms produced transiently by dissociative chemisorption of H2. Furthermore, probing rather than dosing with oxygen beams would rule out the possibility that in the present experiments oxygen might be diffusing to special reactive sites or forming transient areas of high concentration due to fluctuations.
There are also many new directions for theoretical work arising from the results presented here. DFT calculations of possible active sites, special configurations of adsorbed O* and H* that might present lower barrier reaction pathways are high on the list. Likewise, dynamical calculations to explore the role of hot atoms from dissociative chemisorption would be of great interest.
Unfortunately, the hydrogen oxidation reaction on Platinum remains a puzzle. However, there is reason to believe in light of the unambiguous experimental observations presented in this work and possible extensions of the work discussed above, that the puzzle may soon be solved.
6. Dedication
We dedicate this paper to Professor Jürgen Troe on the occasion of his 80th birthday. His example in developing theories of chemical reaction rates and testing theory against experiment has inspired many. We count ourselves lucky to have grown up during his career.
Disclosure statement
No potential conflict of interest was reported by the author(s).
Funding
DB and MS thank the BENCh graduate school, funded by the Deutsche Forschungsgemeinschaft (DFG) (389479699/GRK2455). JF, MS, GS and TNK acknowledge support from the European Research Council (ERC) under the European Union’s Horizon 2020 research and innovation programme (grant agreement no. [833404]). YW and HG acknowledge support from the National Science Foundation (CHE-1951328) and HG is a Humboldt Research Awardee. The DFT calculations were performed at the Center for Advanced Research Computing (CARC) at UNM.
References
- H. Davy, Philos. Trans. Royal Society of London. 107, 77 (1817). doi:https://doi.org/10.1098/rstl.1817.0009
- J.W. Döbereiner, Ann. Phys. 74, 269 (1823). Johann Wolfgang Döbereiner, ISIS, 989 (1823). doi:https://doi.org/10.1002/andp.18230740705
- J.J. Berzelius, Jahres-Bericht. 14, 237 (1835).
- I. Langmuir, Trans. Faraday Soc. 17, 621 (1922). doi:https://doi.org/10.1039/tf9221700621
- V.P. Zhdanov, V.I. Sobolev and V.A. Sobyanin, Surf. Sci. 175 (2), L747 (1986). Sohail Akhter and J. M. White, Surf. Sci. 171 (3), 527 (1986); Laurens K. Verheij and Markus B. Hugenschmidt, Surf. Sci. 324 (2-3), 185 (1995). doi:https://doi.org/10.1016/0039-6028(86)90226-8
- J. Biener, E. Lang, C. Lutterloh and J. Kuppers, J. Chem. Phys. 116 (7), 3063 (2002). doi:https://doi.org/10.1063/1.1436075
- J.L. Gland and E.B. Kollin, J. Chem. Phys. 78 (2), 963 (1983). doi:https://doi.org/10.1063/1.444801
- H.H. Kan, R. Bradley Shumbera and J.F. Weaver, J. Chem. Phys. 126 (13), 134704 (2007). doi:https://doi.org/10.1063/1.2713111
- J.N. Smith and R.L. Palmer, J. Chem. Phys. 56 (1), 13 (1972). doi:https://doi.org/10.1063/1.1676837
- L.K. Verheij, M.B. Hugenschmidt, L. Cölln, B. Poelsema and G. Comsa, Chem. Phys. Lett. 166 (5-6), 523 (1990). doi:https://doi.org/10.1016/0009-2614(90)87145-H
- L.K. Verheij, M.B. Hugenschmidt, B. Poelsema and G. Comsa, Chem. Phys. Lett. 174 (5), 449 (1990). doi:https://doi.org/10.1016/S0009-2614(90)87178-T
- A.B. Anton and D.C. Cadogan, Surf. Sci. 239 (3), L548 (1990). A. B. Anton and D. C. Cadogan, Journal of Vacuum Science & Technology A 9 (3), 1890 (1991). doi:https://doi.org/10.1016/0039-6028(90)90217-V
- L.K. Verheij and M.B. Hugenschmidt, Surf. Sci. 416 (1-2), 37 (1998). doi:https://doi.org/10.1016/S0039-6028(98)00498-1
- A. Rosen, S. Ljungstrom, T. Wahnstrom and B. Kasemo, J. Electron Spectrosc. Relat. Phenom. 39 (1-4), 15 (1986). B. Hellsing, B. Kasemo, S. Ljungstrom, A. Rosen, and T. Wahnstrom, Surf. Sci. 189, 851 (1987); T. Wahnstrom, S. Ljungstrom, A. Rosen, and B. Kasemo, Surf. Sci. 234 (3), 439 (1990); E. Fridell, B. Hellsing, B. Kasemo, S. Ljungstrom, A. Rosen, and T. Wahnstrom, Journal of Vacuum Science & Technology a-Vacuum Surfaces and Films 9 (4), 2322 (1991). doi:https://doi.org/10.1016/0368-2048(86)85028-9
- T. Wahnström, E. Fridell, S. Ljungström, B. Hellsing, B. Kasemo and A. Rosén, Surf. Sci. 223 (3), L905 (1989). doi:https://doi.org/10.1016/0039-6028(89)90662-6
- G.B. Fisher and B.A. Sexton, Phys. Rev. Lett. 44 (10), 683 (1980). doi:https://doi.org/10.1103/PhysRevLett.44.683
- G.B. Fisher, J.L. Gland and S.J. Schmieg, J. Vac. Sci. Technol. 20 (3), 518 (1982). doi:https://doi.org/10.1116/1.571421
- G.E. Mitchell and J.M. White, Chem. Phys. Lett. 135 (1-2), 84 (1987). doi:https://doi.org/10.1016/0009-2614(87)87221-4
- T.A. Germer and W. Ho, Chem. Phys. Lett. 163 (4-5), 449 (1989). doi:https://doi.org/10.1016/0009-2614(89)85166-8
- K. Bedurftig, S. Volkening, Y. Wang, J. Wintterlin, K. Jacobi and G. Ertl, J. Chem. Phys. 111 (24), 11147 (1999). doi:https://doi.org/10.1063/1.480472
- J.R. Creighton and J.M. White, Surf. Sci. 136 (2-3), 449 (1984). Gary E. Mitchell, Sohail Akhter, and J. M. White, Surf. Sci. 166 (2-3), 283 (1986). doi:https://doi.org/10.1016/0039-6028(84)90623-X
- K.M. Ogle and J.M. White, Surf. Sci. 139 (1), 43 (1984). doi:https://doi.org/10.1016/0039-6028(84)90007-4
- S. Volkening, K. Bedurftig, K. Jacobi, J. Wintterlin and G. Ertl, Phys. Rev. Lett. 83 (13), 2672 (1999). C. Sachs, M. Hildebrand, S. Volkening, J. Wintterlin, and G. Ertl, Journal of Chemical Physics 116 (13), 5759 (2002). doi:https://doi.org/10.1103/PhysRevLett.83.2672
- T. Zambelli, J.V. Barth, J. Wintterlin and G. Ertl. ), Nature. 390 (6659), 495 (1997). doi:https://doi.org/10.1038/37329
- A. Michaelides and P. Hu, J. Am. Chem. Soc. 123 (18), 4235 (2001). doi:https://doi.org/10.1021/ja003576x
- G.S. Karlberg and G. Wahnstrom, Phys. Rev. Lett. 92 (13), 136103 (2004). Timo Jacob and William A. Goddard, ChemPhysChem 7 (5), 992 (2006); Ryosuke Jinnouchi, Kensaku Kodama, and Yu Morimoto, Journal of Electroanalytical Chemistry 716, 31 (2014). doi:https://doi.org/10.1103/PhysRevLett.92.136103
- L. Qi, J. Yu and J. Li, J. Chem. Phys. 125 (5), 054701 (2006). doi:https://doi.org/10.1063/1.2227388
- D.C. Ford, A.U. Nilekar, Y. Xu and M. Mavrikakis, Surf. Sci. 604 (19-20), 1565 (2010). doi:https://doi.org/10.1016/j.susc.2010.05.026
- M.J. Kolb, F. Calle-Vallejo, L.B.F. Juurlink and M.T.M. Koper, J. Chem. Phys. 140 (13), 134708 (2014). doi:https://doi.org/10.1063/1.4869749
- R.F. de Morais, A.A. Franco, P. Sautet and D. Loffreda, ACS Catal. 5 (2), 1068 (2015). doi:https://doi.org/10.1021/cs5012525
- J. Harris, B. Kasemo and E. Tornqvist, Surf. Sci. 105 (2-3), L288 (1981). doi:https://doi.org/10.1016/0039-6028(81)90005-4
- L.K. Verheij, M.B. Hugenschmidt, B. Poelsema and G. Comsa, Surf. Sci. 233 (3), 209 (1990). doi:https://doi.org/10.1016/0039-6028(90)90633-J
- L.K. Verheij, M. Freitag, M.B. Hugenschmidt, I. Kempf, B. Poelsema and G. Comsa, Surf. Sci. 272 (1-3), 276 (1992). doi:https://doi.org/10.1016/0039-6028(92)91450-P
- C.T. Campbell, G. Ertl, H. Kuipers and J. Segner, Surf. Sci. 107 (1), 220 (1981). Deborah Holmes Parker, Michael E. Bartram, and Bruce E. Koel, Surf. Sci. 217 (3), 489 (1989). doi:https://doi.org/10.1016/0039-6028(81)90622-1
- E.M. Karp, C.T. Campbell, F. Studt, F. Abild-Pedersen and J.K. Norskov, J. Phys. Chem. C. 116 (49), 25772 (2012). doi:https://doi.org/10.1021/jp3066794
- K.M. Ogle and J.M. White, Surf. Sci. 169 (2-3), 425 (1986). F. T. Wagner and T. E. Moylan, Surf. Sci. 191 (1-2), 121 (1987); W. R. Williams, C. M. Marks, and L. D. Schmidt, Journal of Physical Chemistry 96 (14), 5922 (1992); V. J. Kwasniewski and L. D. Schmidt, Journal of Physical Chemistry 96 (14), 5931 (1992). doi:https://doi.org/10.1016/0039-6028(86)90623-0
- B. Hellsing, B. Kasemo and V.P. Zhdanov, J. Catal. 132 (1), 210 (1991). doi:https://doi.org/10.1016/0021-9517(91)90258-6
- M. Stamatakis, Y. Chen and D.G. Vlachos, J. Phys. Chem. C. 115 (50), 24750 (2011). doi:https://doi.org/10.1021/jp2071869
- J. Neugebohren, D. Borodin, H.W. Hahn, J. Altschaeffel, A. Kandratsenka, D.J. Auerbach, C.T. Campbell, D. Schwarzer, D.J. Harding, A.M. Wodtke and T.N. Kitsopoulos,, Nature. 558 (7709), 280 (2018). doi:https://doi.org/10.1038/s41586-018-0188-x
- G. Barratt Park, T.N. Kitsopoulos, D. Borodin, K. Golibrzuch, J. Neugebohren, D.J. Auerbach, C.T. Campbell and A.M. Wodtke, Nature Reviews Chemistry. 3 (12), 723 (2019). doi:https://doi.org/10.1038/s41570-019-0138-7
- M. Nagasaka, H. Kondoh, I. Nakai and T. Ohta, J. Chem. Phys. 122 (4), 6, 044715 (2005); H. R. Tang, A. Van der Ven, and B. L. Trout, Physical Review B 70 (4), 045420 (2004); Hairong Tang, Anton Van Der Ven, and Bernhardt L. Trout, Molecular Physics 102 (3), 273 (2004). doi:https://doi.org/10.1063/1.1835270
- D.J. Harding, J. Neugebohren, D.J. Auerbach, T.N. Kitsopoulos and A.M. Wodtke, J. Phys. Chem. A. 119 (50), 12255 (2015). Dan J. Harding, Jannis Neugebohren, Hinrich Hahn, D. J. Auerbach, T. N. Kitsopoulos, and Alec M. Wodtke, Journal of Chemical Physics 147 (1), 013939 (2017). doi:https://doi.org/10.1021/acs.jpca.5b06272
- D. Borodin, K. Golibrzuch, M. Schwarzer, J. Fingerhut, G. Skoulatakis, D. Schwarzer, T. Seelemann, T. Kitsopoulos and A.M. Wodtke, ACS Catal. 10 (23), 14056 (2020). doi:https://doi.org/10.1021/acscatal.0c03773
- C.R. Gebhardt, T.P. Rakitzis, P.C. Samartzis, V. Ladopoulos and T.N. Kitsopoulos, Rev. Sci. Instrum. 72 (10), 3848 (2001). doi:https://doi.org/10.1063/1.1403010
- G. Kresse and J. Furthmüller, Comput. Mater. Sci. 6 (1), 15 (1996). Georg Kresse and Jürgen Furthmüller, Physical review B 54 (16), 11169 (1996). doi:https://doi.org/10.1016/0927-0256(96)00008-0
- G. Kresse and D. Joubert, Physical Review b. 59 (3), 1758 (1999). Peter E Blöchl, Physical review B 50 (24), 17953 (1994). doi:https://doi.org/10.1103/PhysRevB.59.1758
- G. Henkelman, B.P. Uberuaga and H. Jónsson, J. Chem. Phys. 113 (22), 9901 (2000). doi:https://doi.org/10.1063/1.1329672
- J.P. Perdew and Y. Wang, Physical Review B. 45 (23), 13244 (1992). doi:https://doi.org/10.1103/PhysRevB.45.13244
- J.P. Perdew, K. Burke and M. Ernzerhof, Phys. Rev. Lett. 77 (18), 3865 (1996). doi:https://doi.org/10.1103/PhysRevLett.77.3865
- B. Hammer, L.B. Hansen and J.K. Nørskov, Physical Review B. 59 (11), 7413 (1999). doi:https://doi.org/10.1103/PhysRevB.59.7413
- M. Dion, H. Rydberg, E. Schröder, D.C. Langreth and B.I. Lundqvist, Phys. Rev. Lett. 92 (24), 246401 (2004). doi:https://doi.org/10.1103/PhysRevLett.92.246401
- J. Klimeš, D.R. Bowler and A. Michaelides, J. Phys.: Condens. Matter. 22 (2), 022201 (2009). Jiří Klimeš, David R Bowler, and Angelos Michaelides, Physical Review B 83 (19), 195131 (2011). doi:https://doi.org/10.1088/0953-8984/22/2/022201
- Y. Zhao and D.G. Truhlar, J. Chem. Phys. 125 (19), 194101 (2006). doi:https://doi.org/10.1063/1.2370993
- G. Comsa and R. David, Surf. Sci. Rep. 5 (4), 145 (1985). J. E. Hurst, L. Wharton, K. C. Janda, and D. J. Auerbach, The Journal of Chemical Physics 83 (3), 1376 (1985). doi:https://doi.org/10.1016/0167-5729(85)90009-3
- A.C. Luntz, J.K. Brown and M.D. Williams, J. Chem. Phys. 93 (7), 5240 (1990). doi:https://doi.org/10.1063/1.459669
- D.C. Ford, Y. Xu and M. Mavrikakis, Surf. Sci. 587 (3), 159 (2005). J. M. Hawkins, J. F. Weaver, and A. Asthagiri, Physical Review B 79 (12), 125434 (2009); Linsen Zhou, Alexander Kandratsenka, Charles T. Campbell, Alec M. Wodtke, and Hua Guo, Angewandte Chemie International Edition 58 (21), 6916 (2019). doi:https://doi.org/10.1016/j.susc.2005.04.028
- Z. Duan and G. Wang, Phys. Chem. Chem. Phys. 13 (45), 20178 (2011). doi:https://doi.org/10.1039/c1cp21687b
- G.J. Kroes, Phys. Chem. Chem. Phys. 23 (15), 8962 (2021). doi:https://doi.org/10.1039/D1CP00044F