
 ?Mathematical formulae have been encoded as MathML and are displayed in this HTML version using MathJax in order to improve their display. Uncheck the box to turn MathJax off. This feature requires Javascript. Click on a formula to zoom.
Abstract
The article presents adiabatic potential energy curves of the ground and excited electronic states for the diatomic NaK molecule. The calculations were made using the ab initio computational methods to include electron correlation. The studied molecule was calculated as the effective two-electron problem, in which only the valence electrons of the molecule are explicitly taken into account. The remaining electrons with atomic nuclei are described with appropriate, energy-consistent relativistic pseudopotentials. Additionally, a bespoke basis set, generated and optimised for both ground and excited electronic states of the NaK system was developed. The spectroscopic parameters of the calculated potential energy curves were determined and compared with the available experimental and theoretical results. The compliance of the obtained results, despite slight differences, is very satisfactory.
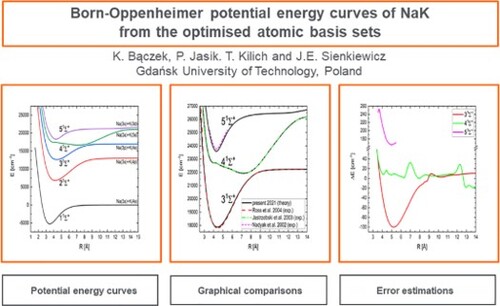
GRAPHICAL ABSTRACT
1. Introduction
The knowledge of the structure of diatomic molecules is essential for understanding and testing physical theories of the structure of molecular systems. The simplest of all molecules – the hydrogen dimer – has been the benchmark for accuracy and understanding of molecular quantum mechanics and, more recently, quantum electrodynamics. Starting with pioneering computations by James and Coolidge [Citation1] through seminal high-accuracy work of Kołos and Wolniewicz [Citation2] and its subsequent improvements [Citation3–6] it became clear that accurate calculation based on rigorous theoretical methods can provide guidance for experimental work and sometimes even correct it. Although ultra-accurate calculations for hydrogen molecule, taking into account higher-order nonadiabatic, relativistic and QED effects [Citation7], is still an active field of investigation and provides excellent agreement with experiment, significant progress was also obtained for heavier diatomic systems. When looking for molecules that are most similar to diatomic hydrogen, one can think in two ways. Firstly, systems with three or four electrons, such as HeH, He, or LiH, can be thought of as molecules that are most similar to hydrogen. However, as it is well known, atoms share similar traits according to their electron configuration, resulting in their position in the periodic table of elements. Subsequently, molecules and their properties also depend on electronic structure and therefore properties of helium dimer are very different from hydrogen molecules. Thinking along the line of electronic configuration, molecular systems that are most similar to hydrogen dimer are alkali metal dimers and hydrides. Since alkali metal atoms have, analogously to hydrogen atom, only one valence electron they share a lot of similarity. Knowledge of potential energy curves and spectroscopic parameters of such systems helps with resolving spectra, planning new experiments, and looking for ro-vibrational energy levels, through which cooling is possible. Furthermore, ultracold systems of alkali metal atoms are currently the active and important field of study in ultracold physics and chemistry [Citation8,Citation9]. Accurate data is required not only for the ground state of the system but also for excited states with various values of angular momentum and spin.
The purpose of this work is to show the consistency between different theoretical approaches and to present the original method of optimisation of the atomic basis sets. This optimisation takes into account the excitation energies of the atomic states, thanks to which it gives very good asymptotic values of the potential energy curves. Obtained basis sets are relatively small sets and yet, they give accurate results. Due to their relatively small size, the calculations are less time-consuming than with larger, but not fully optimised basis sets.
Therefore, in this work, we theoretically determine the potential energy curves for ground and excited states of the NaK molecule in singlet and triplet states of , Π, and Δ symmetries. The approach using large-core relativistic pseudopotentials allows to calculate the excited states that are needed to resolve molecular spectrum along the wide ranges of temperature. Particular attention was paid to the optimisation of the bespoke atomic basis sets, which in turn are used in calculations of ground and excited states. For this purpose, we use high-level, accurate quantum chemistry methods. Based on the obtained results, spectroscopic parameters are also determined and then compared with the available experimental and theoretical values.
The first significant experimental work on NaK appeared in 1977, where Zmbov et al. [Citation10] determined the dissociation energy and ground state spectroscopic parameters. A year later, the results of their experimental work were confirmed by Breford and Engelke [Citation11]. In the same year, Janoschek and Lee [Citation12] applied pseudopotential methods to calculate potential energy curves for several electronic states. However, the development of research on the NaK molecule took place in the 1980s, when a lot of experimental work was carried out. Spectroscopic constants for the ground [Citation13] and several excited states were determined, these include [Citation14],
[Citation15,Citation16],
[Citation17],
[Citation18]. A large impact on the knowledge of the experimental electronic structure of NaK was given by Warsaw group. Using polarisation labelling spectroscopy technique Kowalczyk, Jastrzębski et al. investigated several excited electronic states of the NaK molecule [Citation19–29]. In turn, Magnier and Millie [Citation30] and Musiał et al. [Citation31] provided theoretical curves of potential energy for several electronic states.
2. Theoretical method
The system is simplified to an effective two-electron problem in which only valence electrons are described explicitly. The remaining electrons, together with the nuclei of the respective atoms, form two atomic cores described by energy-consistent relativistic pseudopotentials developed by the Stuttgart group [Citation32]. The details of the method with two valence electrons for the entire alkali molecule has already been described in ours earlier papers and has been proven to produce reliable results, especially for excited states [Citation33,Citation34]. Such an approach could also be beneficial in larger molecules and even clusters, because the dimension of active space and the number of configurations to consider is significantly reduced.
To calculate adiabatic potential energy curves of the NaK molecule, we use the multiconfigurational self-consistent field/complete active space self-consistent field (MCSCF/CASSCF) method and the multi-reference singles and doubles configuration interaction (MRCISD) method. The initial atomic basis sets of both atoms, i.e. Na and K, were optimised separately for each symmetry of the atomic orbitals (i.e. s, p, and d) using the error function defined as , where the sum goes over appropriate atomic energy levels. All calculations are done with the MOLPRO package [Citation35]. The error function is minimised using the Broyden–Fletcher–Goldfarb–Shanno (BFGS) gradient method. Specially written Python scripts support this minimisation procedure. The process itself is quite tedious but gives surprisingly good results, considering the size of the basis set.
3. Results and discussion
3.1. Optimised atomic basis sets
In the case of potassium atom, the ECP18SDF [Citation32] pseudopotential is used on the eight-element basis set with four s and four p orbitals taken from the Stuttgart ECP database [Citation36,Citation37]. This basis set has been optimised with only the ground and first excited atomic states. The initial results, using only slightly modified s orbitals, gave energy estimate of the ground state and the 5s atomic excitation. The initial
cm
was calculated with respect to the experimental energy difference of the ground and 5s
excited state [Citation38,Citation39]. Subsequent optimisation with the BFGS method by successively adding basis functions allowed to reduce the ERR to the value of 0.024 cm
. The exponents of the optimal at this stage basis functions of type s were 1.0826, 1.0763, 0.5992, 0.2544, 0.0483, 0.0217, 0.0041, 0.0040, and 0.0039. Attempts to expand the s-type database further lead to problems with linear dependence of the basis set. After optimisation of s-type basis functions, the basis set was supplemented with p-type functions. ERR calculated with additional experimental energy of the atomic state 4p
[Citation40] during the optimisation process of p-type function drops from 30 to 0.003 cm
. This basis set was then extended by adding d-type orbitals coming with a pseudopotential ECP10MDF [Citation41]. At this stage, ERR with additional experimental atomic energy of the state 3d
during optimisation of the d-type function is lowered from the initial value of 1314 to 0.003 cm
. Thereafter, we make optimisation of the entire atomic basis set, including s-, p-, and d-type orbitals. The core electrons of the sodium atom are represented by the ECP10SDF pseudopotential [Citation32] with dedicated basis set [Citation36,Citation37]. The same optimisation process as for K is repeated for the sodium atom and the final atomic basis sets are shown in Table .
Table 1. The optimised Gaussian exponents of atomic orbitals s, p, and d for sodium and potassium atoms.
The obtained asymptotic potential energy values for the NaK molecule are placed in Table . The high agreement of the obtained results in comparison with the experimental data indicates that the chosen optimisation method of the atomic basis sets yields good results.
Table 2. Asymptotic values and , i.e. the difference between the obtained results and the experimental data [Citation39,Citation40,Citation42].
3.2. Potential energy curves and spectroscopic parameters
We calculated a total of eighteen potential energy curves: five singlet states and five triplet states of symmetry, three singlet states and three triplet states with Π symmetry, and one singlet state and one triplet state with Δ symmetry. The covered distance between the nuclei ranges from 3.0 a
(1.59 Å) to 66.0 a
(34.93 Å) with varying step sizes. For small internuclear distances, these steps are smaller than for large ones. This is because usually, the minima of potential energy curves exist for small distances. Tables with all calculated potential energy curves can be found in Supplementary Materials.
The obtained potential energy curves for the five states are shown in Figure . In Table are our present spectroscopic constants for symmetry
and other values obtained from experimental and theoretical research. This allows for the verification of our results. From Table , it can be concluded that we obtained good agreement with the experimental results, especially for the ground state as well as for the singlet
and Π excited states. Our results look very good compared to the other theoretical results. Our binding energies
are basically more accurate than the other theoretical values, and additionally, we can noticed that the term energy
for the state
and the vibrational constant
for the state
are better than the other theoretical results in comparison with experimental ones. The position of
is shifted towards shorter distances compared to the experiment. However, the difference between these values rather does not exceed 0.1 Å. The special attention should be directed to the 4
excited state. The shape of this potential is strongly irregular, so we noticed here some discrepancies of the electronic energy term
in comparison with available experimental data, but also between different theoretical results. However, we reproduce almost perfectly the shape of this potential energy curve, which is visible on Figure (a) and confirmed by R-dependent error analysis Figure (b). The same figure also presents comparison of our 3
and 5
states with available curves derived from experimental data [Citation25,Citation28]. Once again the shapes of our potentials correspond well with experimental ones and vertical energy differences do not exceed 260 cm
Figure (b).
Figure 1. Adiabatic potential energy curves of the NaK molecule for five states with symmetry .
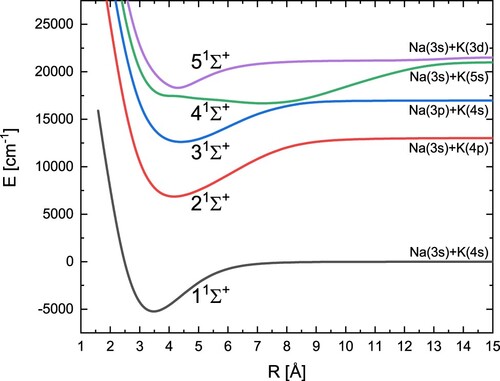
Figure 2. (a) The comparison of the current results of the adiabatic potential energy curves with the potentials derived from experimental data [Citation25,Citation27,Citation28] for the 3–5 (the graph is scaled by the value of the bond energy for the present ground state), (b) error plot, i.e. the value of the difference between the current results and the experimental data [Citation25,Citation27,Citation28] for given distances.
![Figure 2. (a) The comparison of the current results of the adiabatic potential energy curves with the potentials derived from experimental data [Citation25,Citation27,Citation28] for the 3–51Σ+ (the graph is scaled by the value of the bond energy for the present ground state), (b) error plot, i.e. the value of the difference between the current results and the experimental data [Citation25,Citation27,Citation28] for given distances.](/cms/asset/d0cd21c5-f756-481b-a9f4-039af0254295/tmph_a_2040628_f0002_oc.jpg)
Table 3. Spectroscopic constants of the ground and excited states.
The obtained potential energy curves and spectroscopic constants of three singlet states with symmetry Π and one singlet state with symmetry Δ are shown in Figure and Table , respectively. Our position for the 1
state fits perfectly with the experimental value. Overall, our results are closer to different theoretical results than to the most recent experimental data.
Figure 3. Adiabatic energy curves of the NaK molecules for three states with symmetry and one state with symmetry
.
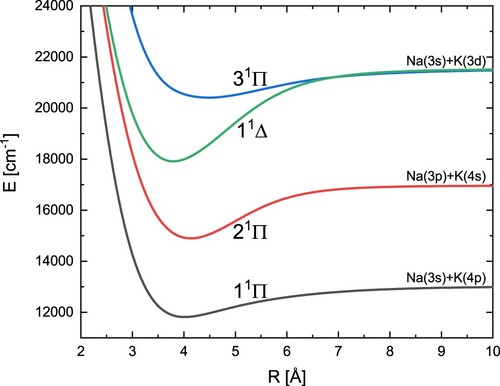
Table 4. Spectroscopic constants of the excited and
states.
In turn, the obtained potential energy curves for five triplet states with symmetry are shown in Figure . Table contains the calculated spectroscopic constants for these states and values from other theoretical and experimental studies. We obtained a high overall agreement with experimental data. An exception should be made for the bond energy
for the 2
state, but in this case neither of theoretical results is much better. In turn, for the 3
state, we find a second minimum that has not been reported either in experimental or theoretical research.
Figure 4. Adiabatic potential energy curves of the NaK molecule for five states with symmetry .
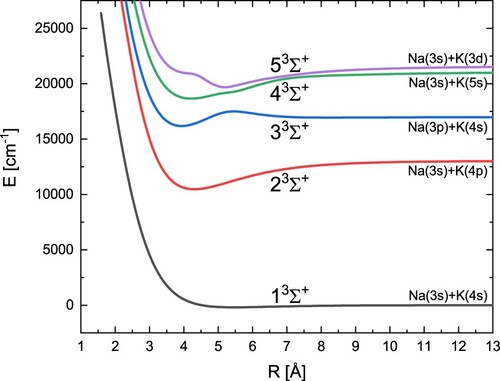
Table 5. Spectroscopic constants of the excited states.
Finally, computed energy curves of the three triplet states with symmetry Π and one with symmetry Δ are shown in Figure . Their spectroscopic constants can be found in Table . By analysing this table, it turns out that, apart from the constant for the 1
state, we achieved very good agreement with the experimental data. The determined potential energy curve for state 3
has two minima. An almost identical theoretical result was obtained by Allouche et al. [Citation43].
Figure 5. Adiabatic potential energy curves of the NaK molecule for three states with symmetry and one state with symmetry
.
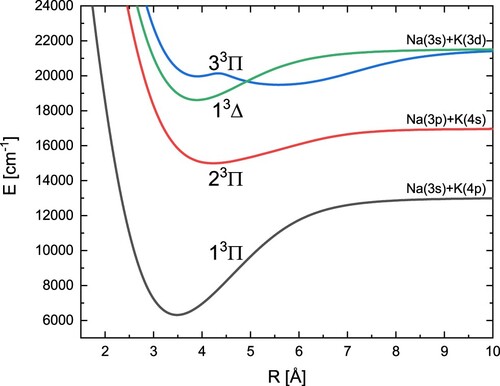
Table 6. Spectroscopic constants of the excited and
states.
4. Conclusions
By simplifying the NaK molecule into an efficient two-electron system and using quantum chemistry methods such as MCSCF/CASSCF and MRCI, we computed 18 potential energy curves. Only the valence electrons were explicitly included in the calculations. The remaining electrons with nuclei are referred to as pseudopotentials. The basis sets coming with atomic pseudopotentials have been extended and optimised using the gradient method from MOLPRO managed by a specially written script. We also determined selected spectroscopic constants and compared them with available experimental data and other theoretical results. The compatibility with the latest experimental data is very good. A great similarity can also be seen in the comparative chart, where the potential energy values obtained in this approach almost perfectly match the experimental results in many places. The difference between the obtained values and the experimental data is the smallest for long distances, it is the result of properly conducted optimisation of atomic basis sets. We also observed high agreement with the theoretical results obtained by Allouche et al. and Magnier et al.
To calculate the potential energy curves, we used a small but very efficient basis of Na and K. Despite small discrepancies with existing data, they give reliable results, while showing consistency between different theoretical calculations and experimental results. Newly developed basis sets can be used in systems, where Na or K atoms interact with other atoms. Moreover, in a more general sense, the proposed basis set optimisation method can be applied to other atoms.
Overall, our results can serve as a valuable comparative resource for other theoretical and experimental approaches.
Supplementary materials
The data that support the findings of this study are available from the corresponding author upon request and also are openly available in the MOST Wiedzy portal [Citation53].
Acknowledgments
We thank Aleksandra Skibowska for her help in preparing the correlated sodium atomic basis set. Calculations were carried out at the Centre of Informatics Tricity Academic Supercomputer & Network. Part of the calculations were made with resources provided by Wrocaw Center for Networking and Supercomputing.
Disclosure statement
No potential conflict of interest was reported by the author(s).
Additional information
Funding
References
- H.M. James and A.S. Coolidge, J. Chem. Phys. 1, 825 (1933). doi:10.1063/1.1749252
- W. Kołos and L. Wolniewicz, J. Chem. Phys. 41, 3663–3673 (1964). doi:10.1063/1.1725796
- L. Wolniewicz, J. Chem. Phys. 45, 515 (1966). doi:10.1063/1.1727599
- W. Kołos and L. Wolniewicz, Phys. Rev. Lett. 20, 243 (1968). doi:10.1103/PhysRevLett.20.243
- W. Kołos and L. Wolniewicz, J. Chem. Phys. 49, 404 (1968). doi:10.1063/1.1669836
- W. Kołos and L. Wolniewicz, J. Chem. Phys. 51 (4), 1417–1419 (1969). doi:10.1063/1.1672189
- M. Puchalski, J. Komasa and K. Pachucki, Phys. Rev. A 95, 052506 (2017). doi:10.1103/PhysRevA.95.052506
- J.M. Sage, S. Sainis, T. Bergeman and D. DeMille, Phys. Rev. Lett. 94, 203001 (2005). doi:10.1103/PhysRevLett.94.203001
- K.-K. Ni, S. Ospelkaus, M.H.G. De Miranda, A. Pe'Er, B. Neyenhuis, J.J. Zirbel, S. Kotochigova, P.S. Julienne, D.S. Jin and J. Ye, Science 322 (5899), 231–235 (2008). doi:10.1126/science.1163861
- K.F. Zmbov, C.H. Wu and H.R. Ihle, J. Chem. Phys. 67, 4603 (1977). doi:10.1063/1.434621
- E.J. Breford and F. Engelke, Chem. Phys. Lett. 53 (2), 282 (1978). doi:10.1016/0009-2614(78)85397-4
- R. Janoschek and H.U. Lee, Chem. Phys. Lett. 58, 47 (1978). doi:10.1016/0009-2614(78)80314-5
- A.J. Ross, C. Effantin, J. d'Incan and R.F. Barrow, J. Mol. Spectrosc. 56, 903 (1985).doi:10.1080/00268978500102791
- A.J. Ross, J. Mol. Spectrosc. 127, 546 (1988). doi:10.1016/0022-2852(88)90142-7
- P. Kowalczyk, J. Chem. Phys. 91, 2779 (1989). doi:10.1063/1.456947
- J. Derouard and N. Sadeghi, J. Chem. Phys. 88, 2891 (1988). doi:10.1063/1.453981
- R.F. Barrow, R.M. Clements, G. Delacretaz, C. Effantin, J. d'Incan, A.J. Ross, J. Verges and L. Wöste, J. Phys. B: At. Mol. Phys. 20, 3047 (1987). doi:10.1088/0022-3700/20/13/016
- A.J. Ross, C. Effantin, J. d'Incan and R.F. Barrow, J. Phys. B: At. Mol. Phys. 19, 1449 (1986). doi:10.1088/0022-3700/19/10/014
- P. Kowalczyk, J. Mol. Spectrosc. 136, 1 (1989). doi:10.1016/0022-2852(89)90213-0
- P. Kowalczyk and N. Sadeghi, J. Chem. Phys. 102, 8321 (1995). doi:10.1063/1.468824
- W. Jastrzębski and P. Kowalczyk, Phys. Rev. A. 55, 2438 (1997). doi:10.1103/PhysRevA.55.2438
- A. Pashov, I. Jackowska, W. Jastrzębski and P. Kowalczyk, Phys. Rev. A 58, 1048–1054 (1998). doi:10.1103/PhysRevA.58.1048
- A. Pashov, W. Jastrzębski and P. Kowalczyk, J. Phys. B: At. Mol. Opt. Phys. 33, L611–L614 (2000). doi:10.1088/0953-4075/33/17/103
- R. Ferber, E.A. Pazyuk, A.V. Stolyarov, A. Zaitsevskii, P. Kowalczyk, H. Chen, H. Wang and W.C. Stwalley, J. Chem. Phys. 112, 5740 (2000). doi:10.1063/1.481149
- R. Nadyak, W. Jastrzębski and P. Kowalczyk, Chem. Phys. Lett. 353, 414–417 (2002). doi:10.1016/S0009-2614(02)00054-4
- A. Grochola, W. Jastrzębski, P. Kortyka and P. Kowalczyk, J. Mol. Spectrosc. 221, 279–284 (2003). doi:10.1016/S0022-2852(03)00233-9
- W. Jastrzębski, R. Nadyak and P. Kowalczyk, Chem. Phys. Lett. 374, 297 (2003). doi:10.1016/S0009-2614(03)00729-2
- A.J. Ross, P. Crozet, I. Russier-Antoine, A. Grochola, P. Kowalczyk, W. Jastrzębski and P. Kortyka, J. Mol. Spectrosc. 226, 95 (2004). doi:10.1016/j.jms.2004.03.011
- A. Adohi-Krou, W. Jastrzębski, P. Kowalczyk, A.V. Stolyarov and A.J. Ross, J. Mol. Spectrosc. 250, 27 (2008). doi:10.1016/j.jms.2008.04.003
- S. Magnier and Ph. Millie, Phys. Rev. A 54, 204 (1996). doi:10.1103/PhysRevA.54.204
- M. Musiał, P. Skupin and A. Motyl, Adv. Quantum Chem. 73, 249 (2016). doi:10.1016/bs.aiq.2015.04.003
- P. Fuentealba, H. Preuss, H. Stoll and L. v. Szentpaly, Chem. Phys. Lett. 89, 418 (1982). doi:10.1016/0009-2614(82)80012-2
- M. Wiatr, P. Jasik and J.E. Sienkiewicz, Phys. Scr. 90, 054012 (2015).doi:10.1088/0031-8949/90/5/054012
- M. Wiatr, P. Jasik, T. Kilich, J.E. Sienkiewicz and H. Stoll, Chem. Phys. 500, 80 (2018). doi:10.1016/j.chemphys.2017.10.005
- H.-J. Werner, P. Knowles, G. Knizia, F. Manby and M. Schütz, Wiley Interdiscip. Rev. Comput. Mol. Sci. 2, 242 (2012).doi:10.1002/wcms.82
- P. Fuentealba, unpublished (1988). As referenced in the Stuttgart ECP database website.
- J. Poppe, unpublished, As referenced in the Stuttgart ECP database website.
- J. Sugar and C. Corliss, J. Phys. Chem. Ref. Data. 14, 1 (1985). doi:10.1063/1.555747
- I. Johansson and N. Svendenius, Phys. Scr. 5, 129 (1972). doi:10.1088/0031-8949/5/3/006
- S. Falke, E. Tiemann, C. Lisdat, H. Schnatz and G. Grosche, Phys. Rev. A 74, 032503 (2006). doi:10.1103/PhysRevA.74.032503
- I.S. Lim, P. Schwerdtfeger, B. Metz and H. Stoll, J. Chem. Phys. 122, 104103 (2005). doi:10.1063/1.1856451
- J.E. Sansonetti, J. Phys. Chem. Ref. Data. 37, 1659 (2008). doi:10.1063/1.2943652
- A.R. Allouche and M. Aubert-Frecon, J. Chem. Phys. 135, 024309 (2011). doi:10.1063/1.3607964
- A. Gerdes, M. Hobein, H. Knöckel and E. Tiemann, Eur. Phys. J. D 49, 67 (2008). doi:10.1140/epjd/e2008-00138-7
- I. Russier-Antoine, A.J. Ross, M. Aubert-Frecon, F. Martin and P. Crozet, J. Phys. B: At. Mol. Opt. Phys. 33, 2753 (2000). doi:10.1088/0953-4075/33/14/312
- W. Müller and W. Meyer, J. Chem. Phys. 80, 3311 (1984). doi:10.1063/1.447084
- W.J. Stevens, D.D. Konowalow and L.B. Ratcliff, J. Chem. Phys. 80, 1215 (1984). doi:10.1063/1.446798
- G.H. Jeung, J.P. Daudey and J.P. Malrieu, Chem. Phys. Lett. 94, 300 (1983). doi:10.1016/0009-2614(83)87092-4
- S. Kasahara, M. Baba and H. Kato, J. Chem. Phys. 94, 7713 (1991). doi:10.1063/1.460157
- M. Baba, S. Tanaka and H. Kato, J. Chem. Phys. 89, 7049 (1988). doi:10.1063/1.455334
- H. Kato, M. Sakano, N. Yoshie, M. Baba and K. Ishikawa, J. Chem. Phys. 93, 2228 (1990). doi:10.1063/1.459056
- S. Kasahara, H. Hikoma and H. Kato, J. Chem. Phys. 100, 63 (1994). doi:10.1063/1.466927
- K. Bączek, P. Jasik, T. Kilich, and J.E. Sienkiewicz, Born-Oppenheimer potential energy curves of the NaK molecule [Data set]. 2022. doi:10.34808/kbwz-2f50