
 ?Mathematical formulae have been encoded as MathML and are displayed in this HTML version using MathJax in order to improve their display. Uncheck the box to turn MathJax off. This feature requires Javascript. Click on a formula to zoom.
Abstract
We report on the measurement and analysis of photoionisation, mass-analysed-threshold-ionisation and pulsed-field-ionisation zero-kinetic-energy photoelectron spectra of HD in the vicinity of the dissociative-ionisation thresholds H + D(1s) + e
and H(1s) + D
+ e
. The spectra were recorded via the
vibrational levels of the
and
outer wells of the H
and B
states and provide information on the weakly bound levels of the X
ground state of HD
with vibrational quantum numbers
and rotational angular-momentum quantum numbers
. The spectra also reveal for the first time shape and Feshbach resonances of HD
located energetically above the H
+ D(1s) dissociation limit. The structure and dissociation dynamics of the
and
states of HD and of the X
and A
states of HD
near the dissociation thresholds are strongly influenced by the g/u-symmetry breaking caused by the nuclear-mass asymmetry.
GRAPHICAL ABSTRACT
1. Introduction
This article presents an experimental study of HD in the vicinity of the H
+ D(1s) and H(1s) + D
dissociation thresholds by pulsed-field-ionisation zero-kinetic-energy (PFI-ZEKE) photoelectron spectroscopy. We used a resonant multiphoton excitation sequence via the
levels of the H
and B
states. These levels are located in the outer (
and
) potential wells, which have ion-pair character, and are thus ideally suited to efficiently access the high vibrational levels of HD
located just below, and the dissociation continua located above, these thresholds. They are almost degenerate and, in HD, the gerade/ungerade (g/u) symmetry breaking from the nuclear-mass asymmetry mixes these two states [Citation1] and makes them accessible by two-photon excitation from the ground state.
The emphasis of the article is placed on (i) the structure and dynamics of HD in the H
and B
states and of HD
near the dissociation threshold, and (ii) the effects of the g/u-symmetry breaking in the electronic states of HD and HD
. The earlier theoretical work of L. Wolniewicz and his coworkers on these topics [Citation1–3] were extremely useful in guiding our analysis, and so were numerous experimental and theoretical studies of isotopic effects near the dissociation thresholds of HD (see, e.g. Refs. [Citation4–11] and references therein).
HD is the simplest molecular system that possesses a permanent electric dipole moment. The nonvanishing electric dipole moment results from a breakdown of the Born-Oppenheimer approximation that can be attributed to the displacement of the centre-of-mass relative to the geometric centre of the nuclei. The rovibronic molecular Hamiltonian can be expressed as [Citation2,Citation12]
(1)
(1)
In Equation (Equation1
(1)
(1) ),
is the clamped-nuclei Hamiltonian,
specify the nuclear spatial arrangement in the laboratory-fixed frame, and
(2)
(2)
and
(3)
(3)
where
and
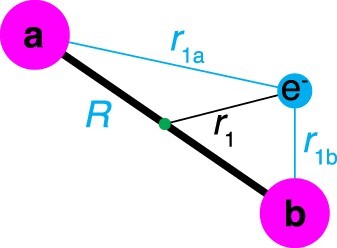
are the masses of nuclei a and b, respectively. All other symbols have their usual meaning and the labels of the particles are given in Figure .
Figure 1. Relevant distances in the HD molecular ion. The small green dot designates the geometric centre of the nuclei.
The Hamiltonian of HD differs from that of the homonuclear species H and D
only through the additional term
, which vanishes in homonuclear molecules and is the only term in Equation (Equation1
(1)
(1) ) that is not invariant to the symmetry operations of the D
point group. Specifically,
is not invariant with respect to the permutation of the nuclei a and b and has C
symmetry. This term causes a mixing of states of g and u symmetry (see, e.g. Refs. [Citation2,Citation12]) and couples ionisation channels differing in core rotational-angular-momentum quantum number
and electron-orbital-angular-momentum quantum number l by
[Citation13,Citation14]. Because of the mass ratio of H to D (and T), the nonadiabatic g/u-symmetry breaking in HD (and HT) is stronger than in any other isotopically substituted homonuclear diatomic molecule.
The rovibronic g/u-symmetry-breaking interaction is very small in low rovibrational states, but becomes important in high vibrational states near the dissociation thresholds of HD, H
+ D(1s) and D
+ H(1s), that are separated by the different ionisation energies of the atoms, i.e. by 29.843 cm
. These two dissociation thresholds can be associated with the lower (X
) and upper (A
) electronic states, respectively, and the theoretical description is similar to that introduced for the hyperfine-induced g/u mixing in H
presented in Ref. [Citation15], although the rovibronic g/u-mixing effect in HD
is approximately 900 times stronger.
The nonzero electric dipole moment of HD allows the measurement of rovibrational transitions in the infrared and microwave region and a variety of such transitions have been observed [Citation16–23]. In particular, Carrington and coworkers have studied the hyperfine structure of rovibrational levels of HD
in the vicinity of the first dissociation threshold and the effects of the asymmetric charge distribution in the centre-of-mass frame [Citation20].
Above the first dissociation threshold of HD, the g/u-mixing term
in the molecular Hamiltonian (Equation1
(1)
(1) ) is also responsible for electronic predissociation (type I predissociation in Herzberg's classification [Citation24]). The rovibrational levels of the A
state cannot predissociate in the cases of H
and D
because they are located below the dissociation threshold. In HD
, they are all located above the H
+ D(1s) dissociation threshold and are coupled to the H
+ D(1s) continuum, which reduces the lifetimes to the picosecond range. Although the decay through electronic predissociation is allowed above the lowest dissociation threshold, it does not always contribute significantly, so that some resonances are better described by elastic-scattering resonances i.e. shape and orbiting resonances, as discussed, e.g. in Refs. [Citation25–27].
All bound rovibronic states of HD associated with the X
state were calculated by Moss using a transformed Hamiltonian in combination with the artificial-channels scattering method [Citation28]. With this method, the effect of the g/u-mixing rovibronic term is removed from the Hamiltonian using a unitary transformation that results in effective nuclear charges and effective reduced masses in the electronic Hamiltonian. For the lowest vibrational states of HD
, variational calculations [Citation29] and pre-Born-Oppenheimer variational results including relativistic and QED corrections up to high order [Citation30–33] were reported.
Calculations, based on a variation-perturbation approach first used in HD by Wolniewicz and Orlikowski [Citation2,Citation3,Citation34], using hyperspherical coordinates [Citation35] and a modified adiabatic Hamiltonian [Citation36], were also reported (see Ref. [Citation37] for a review), but included more restrictive approximations than the calculations of Moss [Citation28]. However, these calculations could be extended to the energy region above the first dissociation threshold H
+ D(1s) and predicted the positions and widths of the quasibound states of HD
[Citation3,Citation25,Citation34,Citation35,Citation38].
Several quasibound states (shape resonances) of the X state with rotational quantum numbers
larger than 16 were observed by Carrington and coworkers [Citation39]. Their experimental method restricted the detection to states with lifetimes longer than a few nanoseconds so that only resonances trapped on the low-R side of large centrifugal barriers could be detected. Concerning the metastable levels of the A
state, Leach and Moss commented in their review article that ‘there seems to be no immediate prospect to experimentally observe these short-lived levels of the first excited electronic state’ [Citation37].
We present PFI-ZEKE photoelectron spectra of HD near the H + D and H + D
dissociative-ionisation thresholds recorded via the H
and B
intermediate states. These spectra reveal sharp transitions to the highest bound states of HD
with
between 16 and 21 and
as well as the onset of the dissociation continua. The effects of increasing g/u mixing with increasing
on the relative intensities in these spectra are discussed. By detecting the H
and D
fragments using mass-analysed threshold-ionisation (MATI) spectroscopy, we also observed the metastable rovibrational levels of the A
state for the first time. These levels are located between the two dissociation thresholds and are Feshbach resonances subject to fast electronic predissociation. We also observed three other resonances that are attributed to the X
,
and A
resonances, the first two of which are located below the second dissociation threshold D
+ H(1s).
2. Experimental setup and procedure
The experiments relied on the use of PFI-ZEKE photoelectron spectroscopy [Citation40] in combination with a resonant three-photon-excitation scheme from the ground X state of HD. The region around the first dissociative-ionisation threshold of HD, which is located 146,084.55541(37) cm
above the X
ground state of HD [Citation28,Citation41], was accessed using the resonant three-photon excitation sequence
(4)
(4)
via excited vibrational levels of the B
and either the
or the
intermediate states, see Figure . The same laser system, consisting of a broadly tunable VUV laser used to drive the B-X transition, a visible laser to induce the H
-B and B
-B transitions, and a UV laser to access the dissociative-ionisation threshold, was already used to study the highest bound states and shape resonances of H
and D
and is described in Refs. [Citation26,Citation27,Citation42,Citation43].
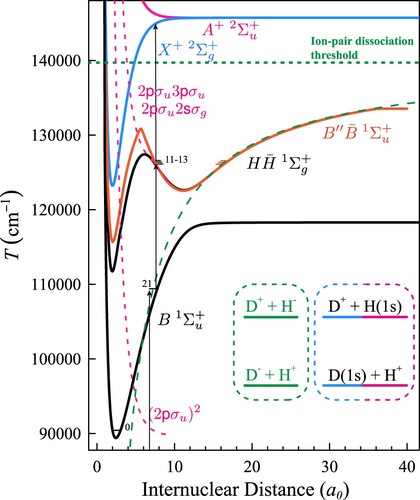
Figure 2. Potential-energy functions of the B , H
and B
states of molecular hydrogen and of the X
and A
states of the molecular-hydrogen cation. The dashed lines represent schematically the diabatic potential-energy functions of the repulsive states with configurations
,
and
(magenta) and of the H
D
/H
D
ion-pair states (green). The horizontal dotted green line gives the position the ion-pair-dissociation thresholds. The left inset indicates the two ion-pair dissociation thresholds D
+ H
and D
+ H
of HD, and the right inset the two dissociation thresholds D
+ H(1s) and D(1s) + H
of HD
. The blue and magenta colours highlight the mixed characters in the correlation to the X
and A
states. The vertical arrows indicate the photoexcitation sequence used to access the region of the dissociative-ionisation threshold from the X
ground state of HD.
The g/u-symmetry breaking in HD allowed the direct excitation, from the intermediate levels, of rovibrational levels of the B
state [Citation1,Citation44], which has (1s
)3p
character in the inner well and (2p
)2s
and ion-pair character in the outer well. Because of the ion-pair character of the outer-well states of the H
and B
state, their potential-energy curves are almost identical beyond
. Consequently, the g/u mixing is substantial and some levels of the B
state can be excited from the B state almost as efficiently as the corresponding levels of the H
state despite the fact that their nominal ungerade character makes the excitation forbidden in zero order.
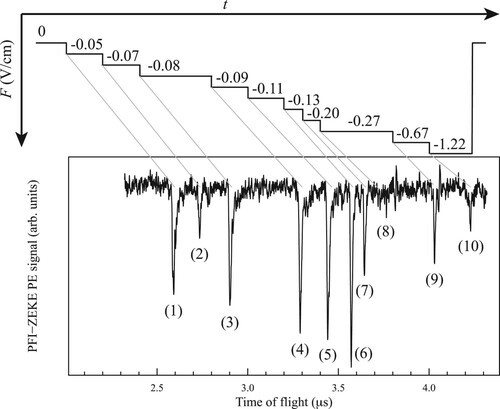
The PFI-ZEKE photoelectron spectra were recorded by monitoring the yield of electrons generated by delayed pulsed-field ionisation as a function of the wave number of the UV laser. The multipulse electric-field sequence used for field ionisation is displayed in the upper panel of Figure and consists of 10 electric-field steps with field strength increasing from to
V/cm. The electric fields also extracted the electrons toward a microchannel-plate (MCP) detector located a the end of a flight tube. The lengths of the individual pulses were chosen so as to be able to unambiguously relate each electron time-of-flight peak to the corresponding electric-field step in the sequence. Their strengths were selected to achieve a high resolution (about 0.15 cm
) in the spectra generated by pulses (2)–(5) and a high signal-to-noise ratio in the spectra recorded with the last pulses of the sequence. The lower part of Figure presents the time-of-flight spectrum of the electrons generated by the pulse sequence when carrying out the photoexcitation to a spectral position above the dissociative-ionisation thresholds, which makes it possible to generate a field-ionisation signal simultaneously with all field pulses. The labels (1) to (10) designate the groups of electrons generated by the 10 pulses of the sequence. The PFI-ZEKE photoelectron spectra presented in the next section correspond to the electron signals generated by the field pulses (2)–(5). The positions of the ionisation thresholds were corrected for the field-induced shifts, which were determined from calculations of the field-ionisation rates of the Rydberg-Stark states following the procedure described in Ref. [Citation45]. The field-corrected spectra were then added to improve the signal-to-noise ratio.
Figure 3. Upper Panel: Electric-field pulse sequence used to record the PFI-ZEKE photoelectron spectrum of HD in the vicinity of the dissociative-ionisation thresholds of HD. Lower panel: Electron time-of-flight spectrum obtained by collecting the electrons generated by the pulsed-field-ionisation sequence. The peak labels (1)–(10) designate the field pulses that led to the field ionisation of the corresponding Rydberg states, as indicated by the grey diagonal lines.
MATI spectra were also recorded in the vicinity of the dissociative-ionisation thresholds using a sequence of two electric-field pulses. The first, weak ( mV/cm) discrimination pulse served the purpose of sweeping prompt ions out of the photoexcitation volume whereas the second, stronger (800 mV/cm) pulse was used to field ionise high Rydberg states located below the bound and continuum states of HD
and extract the H
, D
and HD
ions toward the MCP detector. Below the D(1s) + H
dissociation threshold, only HD
ions corresponding to weakly bound vibrational levels of the X
and A
states can be observed in the MATI spectra for energetic reasons. H
and D
ions can only be observed above the D(1s) + H
and the D
+ H(1s) dissociation thresholds, respectively.
The UV wave number was calibrated using a wavemeter (absolute accuracy of 0.02 cm, relative accuracy of 0.015 cm
) and the line centres were determined using a Poisson-weighted nonlinear fit of a Gaussian line-shape model assuming a constant line width determined by the field-ionisation sequence. The relative positions of the rovibronic levels of HD
were extracted in a weighted linear least-squares fit from a redundant network of more than 350 transitions connecting different rovibrational levels of the
and
states to the rovibronic ionisation thresholds. The absolute term values of the HD
levels with respect to the X
ground state of HD were obtained by adding the calibrated UV wave numbers to the term values of the
or
levels reported by Reinhold et al. [Citation1] and compensating for the shifts of the ionisation thresholds induced by the pulsed field ionisation [Citation45]. This procedure resulted in typical absolute and relative uncertainties of 0.11 cm
and 0.02 cm
, respectively, for the rovibronic levels of HD
.
3. Experimental results
3.1. Structure and dynamics of the H and B intermediate states
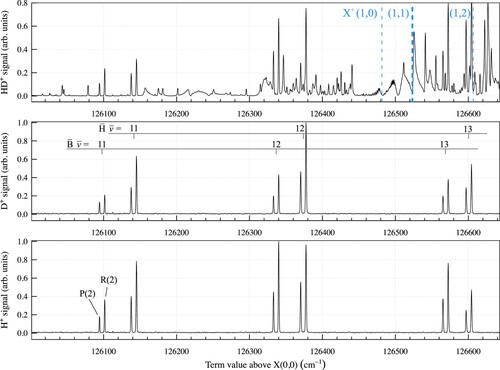
The (1+1') resonant two-photon ionisation spectrum of HD in the vicinity of the X levels of HD
recorded via the B
(20, 2) intermediate level is displayed in Figure . An electric field of 260 V/cm was applied 100 ns after the VUV and VIS excitation to (i) field ionise molecular Rydberg states of HD and (ii) extract all ions toward the MCP detector. HD
, D
and H
ion signals could be observed separately using the TOF spectrometer and the corresponding spectra are displayed in the top, middle and bottom panels, respectively.
Figure 4. Photoionisation spectrum of HD in the vicinity of the X levels of HD
(indicated by dashed vertical lines) recorded via the B (20, 2) level. The HD
, D
and H
ion signals are shown in the top, middle and bottom panels, respectively. The pairs of lines correspond to the P(2) and R(2) transitions to the
vibrational states of the
and
states. See text for details.
The dominant contributions to the HD signal in the top panel of Figure are from molecular Rydberg states, even though these states have low principal quantum numbers and cannot be field ionised by the 260 V/cm electric-field pulse. The HD
signal in this case is caused by (field-induced) autoionisation. In this spectral region, the Rydberg states excited from the B state, which has (1s
)(2p
) character at short range, are s and d Rydberg states converging on the X
level of HD
. Although HD does not have an inversion centre, the g/u symmetry of the electronic wavefunctions is a good symmetry within the Born-Oppenheimer approximation and is only broken by nonadiabatic interactions, as explained in the introduction. Consequently, the g/u symmetry remains useful as approximate symmetry in HD and can be used to explain intensity patterns. Moreover, HD, unlike H
and D
, is not subject to restrictions imposed by the Pauli principle. Starting from a rotational state with odd rotational angular momentum in the ground state (e.g. X
), we expect the strongest autoionising Rydberg series to be s and d Rydberg series converging on the X
state of HD
and such series can indeed be seen above 126,460 cm
in the top panel of Figure . Some intensity is also observed for the nd
Rydberg series, which gives rise to the broad rotational-autoionisation resonances with Fano-type lineshapes above the X
ionisation threshold. Rydberg series converging on higher vibrational levels of HD
also contribute to the spectrum depicted in the top panel of Figure .
The rovibrational levels of the and
outer-well states that we wanted to use as intermediate levels to access the region of the dissociative-ionisation thresholds of HD are difficult to recognise in the top panel of Figure but they are clearly visible in the middle and bottom panels, which display the D
and H
ion signals, respectively, observed in the region of the
vibrational levels. The rovibrational states in the
and
outer wells of the H
and B
states are known to predissociate to the H(2l) + D(1s) and H(1s) + D(2l) dissociation continua of lower electronic states of
and
symmetry [Citation46]. The H
and D
ions observed in the middle and bottom panels of Figure , respectively, result from predissociation of the rovibrational levels of the
and
states forming H and D atoms in n = 2 Rydberg states. These Rydberg states are then ionised by the VIS laser pulse in a multiphoton process to form H
and D
ions. Reinhold et al. found lifetimes shorter than 5 ns for the low vibrational levels of the H
state of HD compared to lifetimes of the order of 20 ns in H
and 50 ns in D
[Citation46]. They concluded that the radiative decay is stronger in HD because of the larger number of dipole-allowed transitions to lower states originating from g/u-symmetry mixing. Our observation of strong HD
, H
and D
signals following excitation to the
and
states indicates that autoionisation and predissociation are also important decay channels for vibrational levels in the range
, the g/u-symmetry mixing allowing nonadiabatic interactions with additional continua compared to H
and D
.
The spectra depicted in the middle and bottom panels of Figure are dominated by the P(2) and R(2) lines of the (11–13) – B(20) and
(11–13) – B(20) bands. The rovibrational levels of the H
and B
states are closely spaced, as expected from the large internuclear distances of the outer-well states. The degeneracy of the potential energies of the
and
states at long range (see Figure ) implies a close proximity of their vibrational levels and a significant mixing of the g/u character in HD caused by nonadiabatic interactions. The spectral lines associated with each value of v thus form two pairs, the lower and higher pairs corresponding to exitation of the
and
states, respectively. The
and
states have ion-pair character at large internuclear distance and can be represented as positive (gerade) and negative (ungerade) superposition of the H
D
(1s)
and H
(1s)
D
ion-pair configurations. The g/u mixing results in a superposition of these gerade and ungerade ion-pair configurations, which causes the (at least partial) localisation of the electrons on either the proton or the deuteron. Based on the difference in the ionisation energies and electron affinities of atomic hydrogen and deuterium, we expect the lower-lying pair of states, i.e. corresponding to the
state, to be correlated with the H
D
ion-pair configuration and the higher-lying pair of states (corresponding to the
state) to be correlated with the H
D
ion-pair configuration.
The relative intensities of the transitions to the levels of the
and
states observed in the three spectra depicted in Figure is determined by the complex interplay between the transition moments from the B(20) intermediate level and the competition between radiative decay and decay by predissociation and autoionisation. The B state of HD around v = 20 has dominant u character so that the absorption intensities are proportional to the g character of the
(11–13) and
(11–13) levels. These characters can be derived from the analysis of these states presented in Refs. [Citation1,Citation47] to be 0.86, 0.81, and 0.72 for the v = 11, 12 and 13 levels of the
state and 0.14, 0.19 and 0.28 for the v = 11, 12 and 13 levels of the
state, with almost no dependence on the rotational quantum number. These characters explain why the lines associated with the excitation of the
vibrational levels are overall stronger than the lines associated with the corresponding
vibrational levels. However, the observed intensity ratios are less pronounced than would be expected on the basis of the g characters, presumably because of differences in the radiative decay of the
and
states [Citation46].
The intensities of the transitions to the states of the
and
states observed in the HD
channel (top panel of Figure ) increase rapidly with increasing v value. This increase can be readily understood by considering the potential-energy curves depicted in Figure . In the spectral region under investigation, autoionisation must take place to the ionisation continua associated with the X
vibronic states of HD
for energetic reasons. The autoionisation rate is given by the overlap of the vibrational wavefunctions of the
and
states with the X
vibrational wavefunction and, consequently, by the probability of tunnelling through the barriers separating the two potential wells of the H
and B
states. This probability increases with increasing v value.
The relative intensities of the transitions to the and
states in the spectra depicted in the middle and lower panels of Figure indicate a slight preference for the
levels to predissociate to the H(1s) + D(n = 2) continua and for the
levels to predissociate to the D(1s) + H(n = 2) continua. This behaviour reflects the facts that the
state correlates with the H
D
ion-pair configuration and that the higher-lying
state is correlated with the H
D
ion-pair configuration, as mentioned above. Predissociation is a vibronic effect and it is unlikely that both electrons are affected. The dominant predissociation processes are therefore expected to be the one-electron charge-transfer (CT) processes
(5)
(5)
(6)
(6)
in accord with the trends in relative intensities observed in the lower two panels of Figure .
3.2. Bound levels of HD just below the dissociative-ionisation thresholds of HD
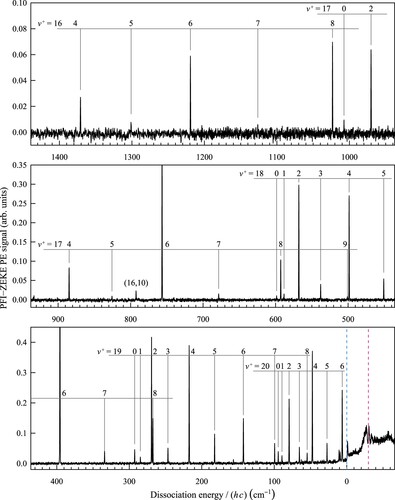
The PFI-ZEKE PE spectrum of HD recorded via the intermediate level is depicted in Figure . The spectrum consists of transitions to bound levels of HD
that can be grouped in rotational progressions associated with vibrational levels with
between 16 and 21 and
between 0 and 10. In H
or D
, the conservation of total parity and nuclear-spin symmetry implies that photoionisation to the X
state of H
of D
from a gerade intermediate state with even (odd) rotational-angular-momentum quantum numbers N exclusively yields ions in rotational levels of even (odd)
values [Citation48,Citation49]. This rotational photoionisation selection rule can be expressed as
. If the photoionisation is from an ungerade intermediate state, the selection rule is
. In HD, there are no restrictions imposed by the conservation of nuclear-spin symmetry and one has to consider the effects of g/u mixing both in the intermediate and the ionic states. Figure shows that both even- and odd-
levels of HD
are accessed from the
intermediate level but that the transitions to the even-
levels are much more intense than the transitions to the odd-
levels. In the rotational progressions associated with
and 17, the intensity ratio of the transitions to even and odd
values roughly reflects the 0.86:0.14 ratio of g and u character of the
intermediate state. This observation suggests that the
and 17 vibrational levels of the X
state of HD
have almost pure g character. With increasing value of
, however, the intensities of transitions to states of even and odd values of
become more and more similar, indicating that g/u mixing in the HD
ion becomes significant beyond
.
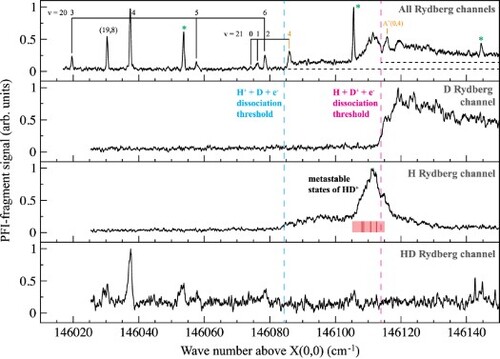
Figure 5. PFI-ZEKE photoelectron spectrum of HD recorded near the dissociative-ionisation threshold from the intermediate level. The H
+ D(1s) and D
+ H(1s) dissociation thresholds are indicated by dashed blue and red lines, respectively.
The PFI-ZEKE PE spectra of HD recorded from the (11, 2) and
(11, 4) intermediate states are compared in Figure . Both intermediate states have even rotational quantum numbers, but opposite nominal g/u symmetry and thus display the opposite
-propensity rule. To rule out that the Franck-Condon factors are the origin of the strong
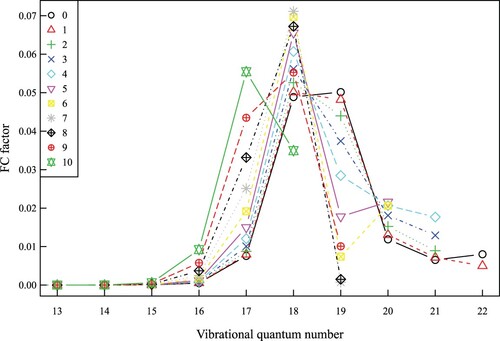
-dependent intensity alternations in the spectra presented in Figures and , we calculated them in the adiabatic approximation and present them in Figure (see discussion below concerning the adiabatic approximation). Within a rotational progression of a given vibrational state of HD
, the Franck-Condon factors are found to either smoothly increase (e.g. for
) or smoothly decrease (e.g. for
), but no dependence on the even/odd nature of
is observed.
Figure 6. Comparison of the PFI-ZEKE photoelectron spectrum of HD near the dissociative-ionisation threshold recorded from the (upper panel) and
(lower panel) levels. The H
+ D(1s) and D
+ H(1s) dissociation thresholds are indicated by dashed blue and red lines, respectively. Unassigned lines are marked with green asterisks. See text for details.
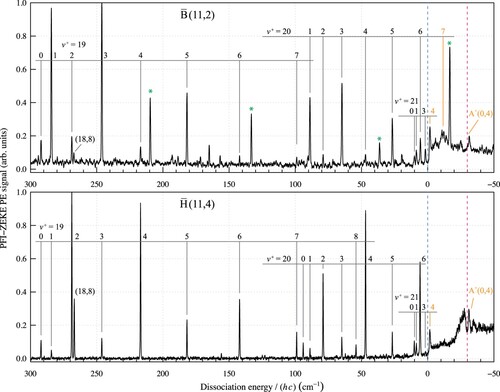
Figure 7. Franck-Condon factors for the excitation from the H
state to selected rotational levels (
) of the X
state of HD
. The lines connecting the data points are used to guide the eye.
The lines marked with asterisks in Figure could not be assigned. They show the same field-ionisation shifts as the lines that could unambiguoulsy be assigned to transitions to rovibrational levels of the X state, but do not correspond to the positions expected for transitions to these levels from the intermediate
or
states nor from the B state. Unlike the assigned lines, these lines can be eliminated by applying a prepulse in the pulsed-field ionisation sequence, and thus be distinguished from the transitions to the high-
levels discussed here. Moreover, the additional lines appear at different absolute energies when other rovibrational levels of the intermediate state are used in the multiphoton excitation sequence [Equation (Equation4
(4)
(4) )]. They may correspond to transitions from unknown levels which are populated through the radiative decay of the intermediate states.
The level positions, relative to the position of the X level, of the highest bound states of HD
determined experimentally are listed in the fourth column of Table . Comparison with the theoretical dissociation energies including relativistic and radiative corrections reported by Moss [Citation28] (fifth column) shows excellent agreement with our results, i.e. within the experimental uncertainties. The term values of all levels with respect to the X(0, 0) ground state of HD are listed in the last column. Their absolute uncertainties are larger (about 0.11 cm
) because of the uncertainties in the field-induced shift of the ionisation threshold and in the term values of the intermediate levels (see Section 2).
Table 1. Measured level positions (obs) of HD with respect to the X
(20, 4) level.
To assess the quality of the calculated Franck-Condon factors and to explore the effects of the g/u mixing on the level positions of the bound states of HD, we calculated them based on Equation (Equation1
(1)
(1) ) in the adiabatic approximation using the methods described in Refs. [Citation26,Citation43]. The comparison with the nonadiabatic dissociation energies reported by Moss [Citation28] is presented in Figure , which displays the differences between our values and those calculated by Moss. These differences correspond to the nonadiabatic corrections. Up to
the nonadiabatic corrections are comparable to the corrections obtained in H
and D
(see Table 2 of Ref. [Citation42] and Tables 1 and 2 of Ref. [Citation43]). In this case, the adiabatic potential-energy function of the X
state can be used to obtain reliable Franck-Condon factors. Whereas the nonadiabatic corrections almost vanish for the highest vibrational states of H
and D
, they increase very rapidly beyond
in the case of HD
. This behaviour is attributed to the fact that the single adiabatic potential function of the X
state fails to describe the distinct H
+ D(1s) and H(1s) + D
dissociation thresholds and has the same origin (g/u mixing) as the gradual evolution toward equal intensities of transitions to even- and odd-
levels with increasing
values discussed in the context of Figures and .
Figure 8. Nonadiabatic corrections to the dissociation energies of the bound states of HD obtained as differences between the adiabatic energies calculated in the present work and the nonadiabatic energies calculated by Moss [Citation28]. The lines connecting the data points are used to guide the eye.
![Figure 8. Nonadiabatic corrections to the dissociation energies of the bound states of HD+ obtained as differences between the adiabatic energies calculated in the present work and the nonadiabatic energies calculated by Moss [Citation28]. The lines connecting the data points are used to guide the eye.](/cms/asset/948a2742-0a82-4bee-93a8-fe237b6f24ff/tmph_a_2048108_f0008_oc.jpg)
3.3. Resonances
The PFI-ZEKE PE spectra recorded from the (11, 4) and
(11, 2) intermediate states and depicted in Figure also have structure in the dissociation continuum. In both cases, an increase of the signal is observed just above the first dissociation threshold (H
+ D(1s)). Both spectra also show a sharp feature just above each of the two (H
+ D(1s) and D
+ H(1s)) thresholds, which we assign to the X
and A
quasibound states, respectively. The sharp feature marked with an asterisk in the upper panel of Figure was found not to be a feature of the continuum but can be unambiguously identified as one of the spurious transitions discussed in Subsection 3.2.
The spectrum displayed in the upper panel of Figure reveals a weak, broad feature that we attribute to the X quasibound state. This feature is not visible in the lower panel because of the gerade symmetry of the H
state and the lower intensity of transitions to rotational states odd
values of when starting from even-N rotational levels of the
state.
The spectrum in the lower panel of Figure reveals a second broad resonance just below the second dissociation threshold (D + H(1s)) with a sharp decrease in signal intensity at the dissociation threshold. To elucidate the origin of this resonance, we recorded MATI spectra by monitoring the HD
, D
and H
signals resulting from the delayed pulsed-field ionisation in separate time-of-flight windows. These spectra are compared with the corresponding PFI-ZEKE PE spectrum in Figure . Below the first dissociation threshold (H
+ D(1s)), the lines observed in the PFI-ZEKE spectrum all appear in the HD
MATI spectrum and stem from the pulsed-field ionisation of high-n molecular Rydberg states of HD. Above the first threshold, the signal in the H
channel increases and corresponds to the field ionisation of H(nl) Rydberg states produced by dissociation. Above the H
+ D(1s) dissociation threshold, the HD
ion core thus dissociates and the Rydberg electron follows the charged fragment (here H
). The Rydberg electron thus acts as a spectator to the HD
-core dissociation. The broad feature that is observed in the PFI-ZEKE PE spectrum just below the second threshold also appears solely in the H
channel. Based on the calculations of Wolniewicz and Orlikowski [Citation3], we attribute this broad line to the overlapping A
Feshbach resonances marked by red bars below the H
MATI spectrum. A nonzero signal is only observed in the D
channel above the second dissociation threshold (H(1s) + D
) corresponding to excitation of molecular Rydberg states that dissociate into H(1s) and D(nl).
Figure 9. PFI-ZEKE photoelectron (top panel) and MATI (2nd panel: D; 3th panel: H
; bottom panel: HD
) spectra of HD recorded via the
(11, 2) intermediate state. The first and second dissociation thresholds are indicated by blue and red dashed lines, respectively. The calculated level positions of the A
metastable states from Ref. [Citation3] are indicated by red bars and their calculated overlapping widths by a red rectangle.
![Figure 9. PFI-ZEKE photoelectron (top panel) and MATI (2nd panel: D+; 3th panel: H+; bottom panel: HD+) spectra of HD recorded via the H¯(11, 2) intermediate state. The first and second dissociation thresholds are indicated by blue and red dashed lines, respectively. The calculated level positions of the A+ metastable states from Ref. [Citation3] are indicated by red bars and their calculated overlapping widths by a red rectangle.](/cms/asset/6c3a3d05-4d8b-47b9-b13d-d4c3453dbcc5/tmph_a_2048108_f0009_oc.jpg)
The resonance widths and positions observed experimentally are given in Table . They agree less well with the calculations than was the case in H [Citation26,Citation42] and D
[Citation43]. The agreement is nevertheless sufficient for these assignments to be made with some confidence. The assignments of (i) the A
resonance as shape resonance with H(1s) + D
character and (ii) the A
resonances as Feshbach resonances of H(1s) + D
character, and (iii) the X
and X
resonances as shape resonances of H
+ D(1s) character lend support to the classification of these resonances proposed by Davis and Thorson [Citation25].
Table 2. Observed positions and widths of the quasibound states of HD above the H
+ D(1s) dissociation threshold.
4. Conclusions
In this article, we have presented a study of the structure and nonadiabatic dynamics in HD and HD resulting from the breakdown of the g/u symmetry at long range. The observations concerned the level structure and dissociation dynamics of HD in the
and
outer-well states into H
+ D(1s) and H(1s) + D
fragments and of HD
near the dissociative-ionisation threhsolds H
+ D(1s) and H(1s) + D
.
The preferential formation of H and D
fragments in the dissociation of the
and
states, respectively, was interpreted as originating from the dominant role of one-electron-transfer processes over two electron processes [see Equations (Equation5
(5)
(5) ) and (Equation6
(6)
(6) )]
The determination of precise X rovibrational level energies for the weakly bound states of HD
just below the H
+ D(1s) and the comparison with adiabatic and nonadiabatic level energies enabled the observation of a sharp onset of nonadiabatic corrections beyond
caused by g/u-symmetry breaking. The separate identification of the H
+ D(1s) and H(1s) + D
dissociation thresholds in the middle panels of Figure enabled the determination of the relative positions of these thresholds (see also Ref. [Citation50]). The mass selectivity of the MATI spectra also permitted the unambiguous attribution of the spectral features observed in the continuum to either of the two dissociative ionisation channels.
The comparison of the dissociative photoionisation cross sections observed in the spectra recorded from the H and B
state in Figure leads to the following conclusions:
The spectrum recorded from the
In contrast, the spectra recorded from the
The A
This behaviour is particularly interesting: Both the intermediate and
states and the final ionic X
and A
states are of mixed g/u character, resulting in a partial (in the case of the intermediate states) or complete (in the case of the final states in the dissociation continua) localisation of the electron(s) on either the proton or the deuteron.
The dark dissociative-ionisation channels are the channels for which the two electrons would need to be excited, and the bright dissociative-ionisation channels those for which charge-transfer excitation takes place, which is a one-electron process [see Equations (Equation5(5)
(5) ) and (Equation6
(6)
(6) )]. These considerations are thus analogous to those used to explain the dissociation dynamics of the
and
.
The conclusions drawn in the present study concerning the dissociation dynamics of the and
states in HD, of the X
and A
levels in HD
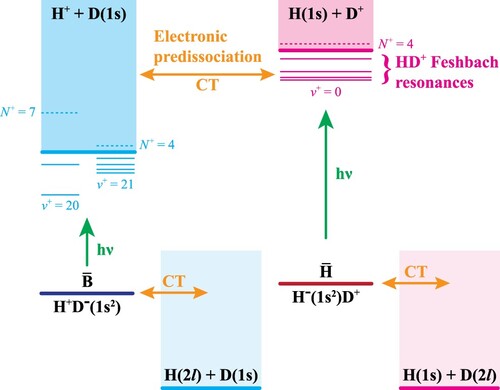
, and the intensities in the photoionisation and photoelectron spectra are all related to nonadiabatic g/u-symmetry breaking and are summarised schematically in Figure .
Figure 10. Schematic illustration of the dissociation dynamics in the and
states of HD and in the X
and A
states of HD
. The upper blue and magenta level schemes correspond to the weakly bound rovibrational levels of HD
and the dissociative-ionisation continua associated with the H
+ D(1s) and H(1s) + D
dissociation thresholds, respectively, which correlate adiabatically to the X
and A
electronic states of HD
. Resonances that can be classified as shape and Feshbach resonances are drawn as dashed and full horizontal lines, respectively. The lower pale blue and magenta dissociation continua are associated with the H(2l) + D(1s) and H(1s) and D(2l) dissociation continua of HD. The green and orange arrows indicate the bright one-electron charge-transfer excitation and the one-electron charge-transfer predissociation, respectively. See text for details.
The results presented in this article illustrate the fact that g/u-symmetry breaking makes the dissociative-ionisation dynamics in HD richer than in H and D
. Accurate calculations of the resonances in the dissociation continua of HD
observed for the first time in the present work would be desirable to confirm our assignments.
Disclosure statement
No potential conflict of interest was reported by the author(s).
Additional information
Funding
References
- E. Reinhold, W. Hogervorst, W. Ubachs and L. Wolniewicz, Phys. Rev. A 60 (2), 1258–1270 (1999). doi:10.1103/PhysRevA.60.1258.
- L. Wolniewicz and J.D. Poll, J. Chem. Phys. 73 (12), 6225–6231 (1980). doi:10.1063/1.440117.
- L. Wolniewicz and T. Orlikowski, Mol. Phys. 74 (1), 103–111 (1991). doi:10.1080/00268979100102091.
- W.R. Thorson, J. Mol. Spectrosc. 37 (2), 199–227 (1971). doi:10.1016/0022-2852(71)90293-1.
- I. Dabrowski and G. Herzberg, Can. J. Phys. 54 (5), 525–567 (1976). doi:10.1139/p76-060.
- J. Durup, J. Phys. (Paris) 39 (9), 941–950 (1978). doi:10.1051/jphys:01978003909094100.
- A. de Lange, E. Reinhold, W. Hogervorst and W. Ubachs, Can. J. Phys. 78 (5-6), 567–578 (2000). doi:10.1139/p00-026.
- A. de Lange, E. Reinhold and W. Ubachs, Int. Rev. Phys. Chem. 21 (2), 257–275 (2002). doi:10.1080/01442350210124515.
- T.P. Grozdanov and R. McCarroll, Phys. Scr. 80 (4), 048123 (2009). doi:10.1088/0031-8949/80/04/048123.
- J. Wang and Y. Mo, Phys. Rev. A 98 (6), 062509 (2018). doi:10.1103/PhysRevA.98.062509.
- J. Wang and Y. Mo, Phys. Rev. A 101 (5), 053418 (2020). doi:10.1103/PhysRevA.101.053418.
- A. Carrington and R.A. Kennedy, in Ions and Light, edited by M.T. Bowers (Academic Press, Orlando, 1984), pp. 393–442.
- F. Merkt, H. Xu and R.N. Zare, J. Chem. Phys. 104 (3), 950–961 (1996). doi:10.1063/1.470818.
- D. Sprecher and F. Merkt, J. Chem. Phys. 140 (12), 124313 (2014). doi:10.1063/1.4868024.
- M. Beyer and F. Merkt, J. Chem. Phys. 149 (21), 214301 (2018). doi:10.1063/1.5046147.
- W.H. Wing, G.A. Ruff, W.E. Lamb Jr. and J.J. Spezeski, Phys. Rev. Lett. 36 (25), 1488–1491 (1976). doi:10.1103/PhysRevLett.36.1488.
- A. Carrington and J. Buttenshaw, Mol. Phys. 44 (2), 267–285 (1981). doi:10.1080/00268978100102431.
- A. Carrington, J. Buttenshaw and R.A. Kennedy, Mol. Phys. 48 (4), 775–780 (1983). doi:10.1080/00268978300100571.
- A. Carrington and R.A. Kennedy, Mol. Phys. 56 (4), 935–975 (1985). doi:10.1080/00268978500102821.
- A. Carrington, I.R. McNab, C.A. Montgomerie-Leach and R.A. Kennedy, Mol. Phys. 72 (4), 735–762 (1991). doi:10.1080/00268979100100531.
- A. Carrington, C.A. Leach, A.J. Marr, R.E. Moss, C.H. Pyne, M.R. Viant, Y.D. West, R.A. Kennedy and I.R. McNab, Chem. Phys. 166 (1), 145–166 (1992). doi:10.1016/0301-0104(92)87015-2.
- S. Alighanbari, G.S. Giri, F.L. Constantin, V.I. Korobov and S. Schiller, Nature 581 (7807), 152–158 (2020). doi:10.1038/s41586-020-2261-5.
- S. Patra, M. Germann, J.P. Karr, M. Haidar, L. Hilico, V.I. Korobov, F.M.J. Cozijn, K.S.E. Eikema, W. Ubachs and J.C.J. Koelemeij, Science 369 (6508), 1238–1241 (2020). doi:10.1126/science.aba0453.
- G. Herzberg, Molecular Spectra and Molecular Structure, Volume I, Spectra of Diatomic Molecules, 2nd ed. (Krieger Publishing Company, Malabar, 1989).
- J.P. Davis and W.R. Thorson, Can. J. Phys. 56 (8), 996–1020 (1978). doi:10.1139/p78-133.
- M. Beyer and F. Merkt, Phys. Rev. Lett. 116 (9), 093001 (2016). doi:10.1103/PhysRevLett.116.093001.
- M. Beyer and F. Merkt, Phys. Rev. X 8 (3), 031085 (2018). doi:10.1103/PhysRevX.8.031085.
- R.E. Moss, Mol. Phys. 78 (2), 371–405 (1993). doi:10.1080/00268979300100291.
- R.E. Moss and I.A. Sadler, Mol. Phys. 68 (5), 1015–1031 (1989). doi:10.1080/00268978900102711.
- V.I. Korobov, Phys. Rev. A 70 (1), 012505 (2004). doi:10.1103/PhysRevA.70.012505.
- V.I. Korobov, Phys. Rev. A 74 (5), 052506 (2006). doi:10.1103/PhysRevA.74.052506.
- V.I. Korobov, L. Hilico and J.P. Karr, Phys. Rev. A 89 (3), 032511 (2014). doi:10.1103/PhysRevA.89.032511.
- V.I. Korobov and J.P. Karr, Phys. Rev. A 104 (3), 032806 (2021). doi:10.1103/PhysRevA.104.032806.
- T. Orlikowski, Mol. Phys. 81 (3), 667–673 (1994). doi:10.1080/00268979400100441.
- A. Igarashi and C.D. Lin, Phys. Rev. Lett. 83 (20), 4041–4044 (1999). doi:10.1103/PhysRevLett.83.4041.
- B.D. Esry and H.R. Sadeghpour, Phys. Rev. A 60 (5), 3604–3617 (1999). doi:10.1103/PhysRevA.60.3604.
- Ch.A. Leach and R.E. Moss, Ann. Rev. Phys. Chem. 46 (1), 55–82 (1995). doi:10.1146/physchem.1995.46.issue-1.
- B.D. Esry, H.R. Sadeghpour, E. Wells and I. Ben-Itzhak, J. Phys. B: At. Mol. Opt. Phys. 33 (23), 5329 (2000). doi:10.1088/0953-4075/33/23/306.
- A. Carrington, I.R. McNab and C.A. Montgomerie, Chem. Phys. Lett. 149 (3), 326–329 (1988). doi:10.1016/0009-2614(88)85035-8.
- K. Müller-Dethlefs and E.W. Schlag, Ann. Rev. Phys. Chem. 42 (1), 109–136 (1991). doi:10.1146/physchem.1991.42.issue-1.
- D. Sprecher, J. Liu, Ch. Jungen, W. Ubachs and F. Merkt, J. Chem. Phys. 133 (11), 111102 (2010). doi:10.1063/1.3483462.
- M. Beyer and F. Merkt, J. Mol. Spectrosc. 330, 147–157 (2016). doi:10.1016/j.jms.2016.08.001.
- M. Beyer and F. Merkt, J. Phys. B: At. Mol. Opt. Phys. 50 (15), 154005 (2017). doi:10.1088/1361-6455/aa7ac9.
- E. Reinhold, W. Hogervorst and W. Ubachs, Chem. Phys. Lett. 296 (3), 411–416 (1998). doi:10.1016/S0009-2614(98)01047-1.
- U. Hollenstein, R. Seiler, H. Schmutz, M. Andrist and F. Merkt, J. Chem. Phys. 115 (12), 5461–5469 (2001). doi:10.1063/1.1396856.
- E. Reinhold, W. Hogervorst and W. Ubachs, J. Chem. Phys. 112 (24), 10754–10760 (2000). doi:10.1063/1.481719.
- L. Wolniewicz, J. Chem. Phys. 108, 1499 (1998). doi:10.1063/1.475521.
- J. Xie and R.N. Zare, J. Chem. Phys. 93 (5), 3033–3038 (1990). doi:10.1063/1.458837.
- R. Signorell and F. Merkt, Mol. Phys. 92 (5), 793–804 (1997). doi:10.1080/002689797169745.
- M. Beyer and F. Merkt, J. Chem. Phys. 149 (3), 031102 (2018). doi:10.1063/1.5043186.