
 ?Mathematical formulae have been encoded as MathML and are displayed in this HTML version using MathJax in order to improve their display. Uncheck the box to turn MathJax off. This feature requires Javascript. Click on a formula to zoom.
Abstract
Laser measurements of the intensity of near-infrared water absorption line at 10,670.1 cm
are made using three different Herriott cells. These measurements determine the line intensity with an standard deviation below of 0.3% by consideration of the new geometrically derived formula for the optical path length without approximations. This determination together with the current accepted value lead to an overall uncertainty of 0.7% of the experimentally assessed line intensity which is compared with previous ab initio predictions. It is found that steady improvements in both the dipole moment surface (DMS) and the potential energy surface (PES) used in the theoretical studies lead to a systematically better agreement with the observation, with the most recent prediction agreeing closely with the experiment.
GRAPHICAL ABSTRACT
1. Introduction
All molecules can be arguably divided into three unequal categories. To the first group belong two-electron systems, such as H, HHe
and H
. The second group comprises 10-electron systems which includes HF, water, ammonia and methane as well as H
O
, NH
and CH
. The third group consists of the great multitude of remaining molecules. Why do we make such an unequal distribution? This division of species is based on the relative simplicity and importance of the species considered.
The fundamental works of Wolniewicz [Citation1, Citation2] on the H molecule represent the beginning of solving the ab initio electronic structure problem for two-electron systems. Modern developments built on work by Wolniewicz [Citation3–5] includes the papers by Pachucki, Komasa and co-workers [Citation6–8], which demonstrate excellent continuation of Wolniewicz's earlier work. Indeed, it has been said [Citation9–12] that state-of-the-art ab initio calculations [Citation13, Citation14] represent a solution for the H
molecular ion, although there are a number of studies showing that further work is required on this important [Citation15] and fundamental ion [Citation16–24].
Ten-electron systems have a particular significance because of the importance of many of them in the atmosphere of the Earth, solar system planets and exoplanets. Clearly, the ab initio solution for molecules, belonging to this second group requires greater computational efforts and remains much further from a satisfactory or final solution, than the for molecules belonging to the two-electron group. The ab initio predictions of the rovibrational energy levels of water reached the 1 cm level in [Citation25] and 0.1 cm
for stretching states in [Citation26], rising to 0.3 cm
when highly excited bending modes are considered. However, there are still many improvements needed to reach the level of accuracy achieved by Wolniewicz for H
calculations [Citation1, Citation2].
Recent focus has turned towards developing theoretical models which give accurate predictions for the transition intensities, see [Citation27] for example. These predictions are important because experimental determinations of the many lines required for atmospheric and other models are often only accurate to a few percent. Furthermore, precise intensity measurements are suggesting novel uses for the spectroscopy of molecules [Citation28].
However, tests of accurate ro-vibrational transition intensities require measurements with corresponding or even better accuracy. The first sub-percent agreement between theory and experiment was achieved for water line intensities in the calculations of Lodi et al. (LTP) [Citation29]. The LTP dipole moment surface (DMS) was used to compute the water line intensities for comparisons with the first sub-percent accurate measurements by Hodges and Lisak [Citation30]. However, subsequent measurements of line intensities for some other water bands [Citation31] disagreed with the LTP predictions by up to 5%. Further improvements in the calculations resulted in the sub-percent agreement with these newly measured line intensities [Citation32].
A detailed comparison between theoretical predictions and high accuracy measurements by Birk et al. [Citation33] suggested that while agreement for some bands was satisfactory (about 1%), this was not true for all bands. In particular, Birk et al. found that for high overtone transitions in the near-infrared or optical theory only agreed with their near IR Fourier Transform Spectrometer (FTS) measurements with an accuracy of about 2%. Since then further improvements have been achieved in both the theoretical techniques [Citation34] and the corresponding calculations [Citation32, Citation35]. Such improvements need to be tested against ever more accurate experimental results and it is such a test that we present here.
In this paper, we present three experimental determinations of the intensity of near IR overtone line of HO. These measurements are compared to the generally adopted value from the FTS measurements of Birk et al. [Citation33] leading to a sub-per cent uncertainty of the experimentally assessed intensity. The experimental results are also compared to various theoretical predictions.
2. Experimental set-up
Figure gives a schematic overview of the experimental set-up used to make high accuracy measurements of the intensity of the HO (201) 3
– (000) 2
line.
Figure 1. A schematic drawing of the experimental set-up.
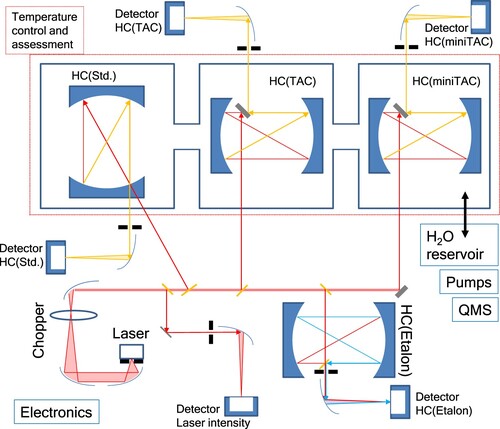
A tunable diode laser (Diode: Laser Components; controller: Stanford Research Systems LC501) was used to generate the IR light at 10,670 cm. To suppress interfering influences, such as caused by stray light, the laser beam was chopped at 2 kHz, while the five detector signals were each recorded phase-sensitive with lock-in amplifiers (Stanford Research Systems SR850). All MCT-detectors used were of the same type (Teledyne Judson HgCdTe Photodiode: J23TE2-66C-R01M). The linearity of all detectors was measured extensively beforehand with a set of neutral density filters, and no deviation was detectable even for the maximum laser power used. The possible influence of the detector nonlinearities was, therefore, considered as negligible for the uncertainty budget, being well below one percent. As illustrated in Figure , the two partial beams running downward were used to characterise the properties of the laser emission. Here, the first partial beam aimed at ‘Detector Laser intensity’ is used to determine the intensity fluctuations of the laser and the second partial beam downwards is used for the calibration of the frequency tuning of the laser emission by means of an unbalanced Michelson interferometer in the form of an additional Herriott cell (‘HC(Etalon)’: FSR =
cm
). Each of the three upwards-pointing partial beams was used to probe its Herriott cell inside the vacuum chamber and was then focused onto the corresponding detector by means of an off-axis paraboloid.
The pressure inside the vacuum chamber was measured with three different gauges, depending on the pressure range: Digiquartz Model 745 from Paroscientific up to 1000 mbar, Baratron from MKS up to 13 mbar and an ionisation gauge to assess the residual pressure of mbar after 12 h of evacuation. The H
O introduced into the measurement chamber was taken from the headspace of a Mill-Q water supply limiting the maximum H
O pressure to about 13 mbar according to the ambient temperature. The temperature of the vacuum chamber was measured with six PT100 sensors, that were connected to the chamber walls, leading to a total temperature uncertainty of
mK (k=1). The gas purity was probed with a mass spectrometer (MKS Microvision-ip1000c).
The experimentally determined HO line strengths were measured using three different Herriott cells to increase sensitivity due to the extended optical path length. Herriott cells consist of two spherical mirrors with concave surfaces facing each other [Citation36, Citation37]. Typically, the coupling of the laser radiation used into and out of the cell is done via one or more corresponding holes in the mirrors. In the first cell ‘
’ both occurred via the same hole in one of the two mirrors. Transverse coupling, for example, via a thin plate with reflective surfaces on both sides, is also possible and was used for the cells two: ‘
’ and three: ‘
’. The optical path length realised inside the Herriott cell for multiple reflections for a complete round trip with N reflections per mirror depends on the distance ‘D’ of the mirrors and their effective radii of curvature ‘ROC’. The ratio of mirror distance and radius of curvature gives information about the potentially closed configuration and the corresponding number of reflections. The geometrically derived formula
(1)
(1) describes exactly for which mirror distances closed configurations exist. Here, U describes the number of
-twists with respect to the centre line between the two Herriott cell mirrors and
is given by
, with
as the radius of the spot patterns generated on the mirrors. More details are given by Rubin [Citation38]. The optical path lengths used are specified in Table .
Table 1. Optical path lengths for each Herriott cells (HC); N is the number of reflections and D the mirror to mirror separation.
3. Line intensity measurement results
The HO absorption line strength measurements were made at 296 K. Accordingly, the line strength was determined with the following formula:
(2)
(2) The H
O pressure range between 0 mbar and 13 mbar was covered leading to the results listed in Table .
Table 2. Measured line intensities at 296 K of the water absorption line at 10,670.1 cm.
Table lists the quantities and uncertainty contributions used to estimate the uncertainty in the HO absorption line strength assessments.
Table 3. Quantities and uncertainty contributions (with k=1) for the measured line strength intensities leading to a relative uncertainty of =1.16%.
4. Calculation of line intensities
There have been a series of efforts to improve predicted intensities [Citation39–45]. The studies rely on the accurate solution of the nuclear-motion Schrödinger equation, the use of high quality potential energy surface (PESs), and dipole moment surfaces (DMSs) from ab initio electronic structure calculations. For the DMS, the calculation of ab initio values at multiple geometries and subsequent fitting of these points to the analytical form to reproduce these points with the typical accuracy of Debye is a standard procedure. For the PES just the ab initio calculations of the points and their fit to the corresponding analytical form is not sufficient. As shown in [Citation46], the improvement of the PES from one which can be used to reproduce the rovibrational energy levels of water with an accuracy of 0.1 cm
to one giving differences of 0.025 cm
can change the values of the calculated intensities by up to 2%. At present, no purely ab initio PES reproduces the observed ro-vibrational energy levels of water to better than 0.1 cm
. For this reason the procedure of starting from a high quality ab initio PES and then improving it by fitting to the experimental energy levels has been widely adopted [Citation35, Citation46–51]. For H
O, this technique has been used to give close to experimental accuracy of 0.01 cm
[Citation35, Citation46]. As shown below, such an accuracy is important for obtaining subsequent sub-percent accuracy in line intensity calculations.
In this work we compare results of three attempts to make high accuracy predictions of HO line intensities. The first of these used the ‘Bubukina’ PES of Bubukina et al. [Citation50] constructed by fitting to ro-vibrational energy levels up to 25,000 cm
, which were reproduced with a standard deviation of 0.022 cm
. The second PES is the improved PES15K [Citation46] which only fitted to ro-vibrational energy levels below 15,000 cm
, which were reproduced with an accuracy of 0.011 cm
. The improved PES15K PES has already been shown to result in a significant improvement of the calculated intensities [Citation46]. Finally, we consider the recently constructed HOT_WAT PES of Conway et al. [Citation35] fitted ro-vibrational energies over the entire range of their availability which is almost up to dissociation [Citation52]. We note that the transition frequency of the line at 10,670.1 cm
discussed in the present paper is reproduced best by this PES to within only 0.001 cm
.
Experience has shown that it is best to use ab initio DMSs [Citation53]. There has been a steady improvement in both calculation and fitting ab initio DMSs over the years [Citation29, Citation32, Citation54–56]. Here, we consider the LTP2011 DMS of LTP [Citation29] which is based on a set of 2000 internally contracted multi-reference configuration interaction (IC-MRCI) points calculated with an aug-cc-pCV6Z basis set as energy derivatives (ED). Relativistic corrections to the dipoles were obtained in a similar manner by computing the derivatives with respect to the external electric field strength of the mass-velocity, one-electron Darwin (MVD1) relativistic corrections to the IC-MRCI energies. This DMS gives sub-percent accuracy for some bands but has been shown to give predictions a few percent off for some bands [Citation33]. Second, we consider the CKAPTEN DMS of Conway et al. [Citation32] which was calculated using a similar procedure but with relativistic corrections obtained using a Douglas–Kroll–Hess Hamiltonian to order two (DKH2). The number of points were significantly increased to about 17500 and an improved fit function used giving a better overall fit. For HOT_WAT and CKAPTEN, the average deviation of the predicted intensities for the (201) band considered here compared to the measured transition intensities of Birk et al. [Citation33] is only 0.4%.
5. Comparison with theoretical calculations
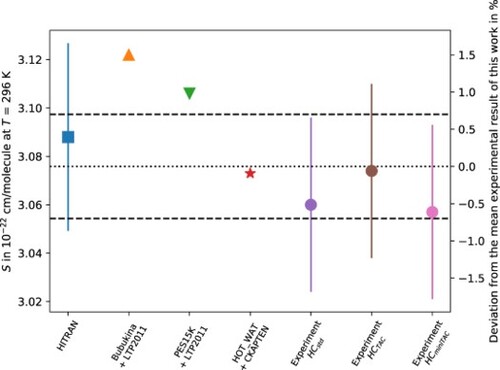
The comparison between our measurements and the theoretical calculations described above are given in Table and Figure . The first row compares the three measurements of this work with the value recommended in the HITRAN database [Citation57], which actually comes from the FTS measurements of Birk et al. [Citation33] and has uncertainty of 1%. The current measured results considering the new formula for the optical path length have a mean value of cm/molecule with a standard deviation of 0.3%. Since most of their uncertainty contributions are considered as ‘type B’ uncertainties with respect to the GUM (Guide to the expression of uncertainty in measurement), the combined value (literature plus the current three results) for the experimentally assessed line strength is
cm/molecule with a standard uncertainty of 0.7%.
Figure 2. Comparison of measured intensities and theoretical calculations. The dashed horizontal lines represent the mean experimentally assessed line strength of S(293 K) = cm/molecule with a standard uncertainty of 0.7%.
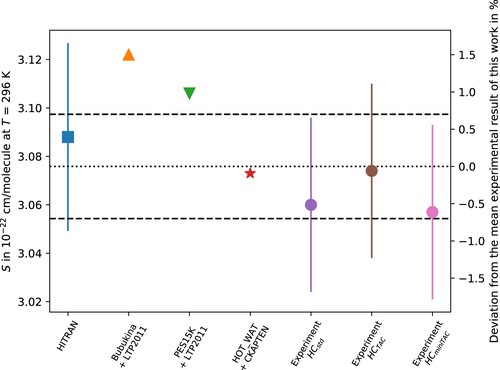
Table 4. Comparison of the combined experimental result with the theoretical calculations. Intensities, S, at 296 K are give in units of cm/molecule.
The final three rows of Table compare with theoretical predictions. The first two of these both use the LTP2011 DMS [Citation46]; agreement improves with use of the better wavefunctions generated using the more accurate PES15K PES. The final row compares with the most recent result using both an improved PES and the CKAPTEN DMS [Citation32]. The intensity predicted with these calculations lies within the experimental uncertainties and differ by less than 0.1% from the mean measured value. The use of the CKAPTEN DMS gives a significant improvement over LTP2011.
This is a first step and is very important, though clearly we need the expansion in two directions. First, the measurements of intensities of more lines, belonging to the different vibrational bands. Second, the higher overtones journey towards higher frequencies from near IR towards optical region and even UV with the sub-percent accuracy is necessary.
6. Conclusions
We present new accurate measurements of the intensity of the water absorption line in the (201) band at 10,670.1 cm
. The combined measurement result gives an intensity S(293 K) =
cm/molecule with an uncertainty of 0.7%. Comparisons with high level theoretical predictions of this transition intensity show systematically improved agreement as the level of theoretical treatment of both the dipole moment and potential energy surfaces are improved. The best calculation gives predictions which lie within the experimental uncertainty. This comparison suggests that the most recent theory is able to provide excellent results for higher stretching overtone although further high accuracy experimental studies would be needed to confirm this situation. The next step is to extend this work to higher overtones and frequencies extending into the optical region and even the near-UV. In this context, we note that recent cavity ring down spectroscopy measurements by Vasilchenko et al. [Citation58] suggest that further work is needed to get equally reliable predicted intensities for the very weak bending overtones in the red region of spectrum.
Disclosure statement
No potential conflict of interest was reported by the authors.
Additional information
Funding
References
- L. Wolniewicz, J. Chem. Phys. 99, 1851 (1993). doi:10.1063/1.465303
- L. Wolniewicz, J. Chem. Phys. 103, 1792 (1995). doi:10.1063/1.469753
- L. Wolniewicz and J. Hinze, J. Chem. Phys. 101, 9817 (1994). doi:10.1063/1.467947
- A. Alijah, J. Hinze and L. Wolniewicz, Methods Protoc. 85, 1105 (1995). doi:10.1080/00268979500101701
- A. Alijah, L. Wolniewicz and J. Hinze, Methods Protoc. 85, 1125 (1995). doi:10.1080/00268979500101711
- K. Pachucki and J. Komasa, J. Chem. Phys. 130, 164113 (2009). doi:10.1063/1.3114680
- J. Komasa, K. Piszczatowski, G. Lach, M. Przybytek, B. Jeziorski and K. Pachucki, J. Chem. Theory Comput. 7, 3105 (2011). doi:10.1021/ct200438t
- J. Rychlewski, W. Cencek and J. Komasa, Chem. Phys. Lett. 229, 657–660 (1994). doi:10.1016/0009-2614(94)01108-7
- S. Mielke, K. Peterson, D. Schwenke, B. Garrett, D. Truhlar, J. Michael, M. Su and J. Sutherland, Phys. Rev. Lett. 91, 063201 (2003). doi:10.1103/PhysRevLett.91.063201
- C. Jungen and S.T. Pratt, Phys. Rev. Lett. 102, 023201 (2009). doi:10.1103/PhysRevLett.102.023201
- J. Varju, M. Hejduk, P. Dohnal, M. Jilek, T. Kotrik, R. Plasil, D. Gerlich and J. Glosik, Phys. Rev. Lett. 106, 203201 (2011). doi:10.1103/PhysRevLett.106.203201
- H. Chen, C. Hsiao, J. Peng, T. Amano and J. Shy, Phys. Rev. Lett. 109, 263002 (2012). doi:10.1103/PhysRevLett.109.263002
- O.L. Polyansky and J. Tennyson, J. Chem. Phys. 110, 5056 (1999). doi:10.1063/1.478404
- J. Tennyson, P. Barletta, M.A. Kostin, O.L. Polyansky and N.F. Zobov, Spectrochim. Acta A 58, 663 (2002). doi:10.1016/S1386-1425(01)00663-1
- S. Miller, T.R. Geballe, T. Stallard and J. Tennyson, Rev. Mod. Phys. 92, 035003 (2020). doi:10.1103/RevModPhys.92.035003
- M. Pavanello, L. Adamowicz, A. Alijah, N.F. Zobov, I.I. Mizus, O.L. Polyansky, J. Tennyson, T. Szidarovszky, A.G. Császár, M. Berg and A. Petrignani, Phys. Rev. Lett. 108, 023002 (2012). doi:10.1103/PhysRevLett.108.023002
- M. Pavanello, L. Adamowicz, A. Alijah, N.F. Zobov, I.I. Mizus, O.L. Polyansky, J. Tennyson, T. Szidarovszky and A.G. Császár, J. Chem. Phys. 136, 184303 (2012). doi:10.1063/1.4711756
- L.G. Diniz, J.R. Mohallem, A. Alijah, M. Pavanello, L. Adamowicz, O.L. Polyansky and J. Tennyson, Phys. Rev. A 88, 032506 (2013). doi:10.1103/PhysRevA.88.032506
- L. Lodi, O.L. Polyansky, A.A.J. Tennyson and N.F. Zobov, Phys. Rev. A 89, 032505 (2014). doi:10.1103/PhysRevA.89.032505
- A. Alijah, J. Fremont and V.G. Tyuterev, Phys. Rev. A 92, 012704 (2015). doi:10.1103/PhysRevA.92.012704
- M. Marquez-Mijares, O. Roncero, P. Villarreal and T. Gonzalez-Lezana, Few-Body Syst. 59, 14 (2018). doi:10.1007/s00601-018-1332-8
- A. Muolo, E. Matyus and M. Reiher, J. Chem. Phys. 149, 184105 (2018). doi:10.1063/1.5050462
- A. Muolo, E. Mátyus and M. Reiher, J. Chem. Phys. 151, 154110 (2019). doi:10.1063/1.5121318
- R. Jaquet and M. Lesiuk, J. Chem. Phys. 152, 104109 (2020). doi:10.1063/1.5144293
- O.L. Polyansky, A.G. Császár, S.V. Shirin, N.F. Zobov, P. Barletta, J. Tennyson, D.W. Schwenke and P.J. Knowles, Science 299, 539 (2003). doi:10.1126/science.1079558
- O.L. Polyansky, R.I. Ovsyannikov, A.A. Kyuberis, L. Lodi, J. Tennyson and N.F. Zobov, J. Phys. Chem. A 117, 9633–9643 (2013). doi:10.1021/jp312343z
- L. Lodi and J. Tennyson, J. Quant. Spectrosc. Radiat. Transf. 113, 850 (2012). doi:10.1016/j.jqsrt.2012.02.023
- K. Jousten, J. Hendricks, D. Barker, K. Douglas, S. Eckel, P. Egan, J. Fedchak, J. Flügge, C. Gaiser, D. Olson and J. Ricker, Metrologia 54, S146 (2017). doi:10.1088/1681-7575/aa8a4d
- L. Lodi, J. Tennyson and O.L. Polyansky, J. Chem. Phys. 135, 034113 (2011). doi:10.1063/1.3604934
- D. Lisak, D.K. Havey and J.T. Hodges, Phys. Rev. A 79, 052507 (2009). doi:10.1103/PhysRevA.79.052507
- V.T. Sironneau and J.T. Hodges, J. Quant. Spectrosc. Radiat. Transf. 152, 1 (2015). doi:10.1016/j.jqsrt.2014.10.020
- E.K. Conway, A.A. Kyuberis, O.L. Polyansky, J. Tennyson and N. Zobov, J. Chem. Phys. 149, 084307 (2018). doi:10.1063/1.5043545
- M. Birk, G. Wagner, J. Loos, L. Lodi, O.L. Polyansky, A.A. Kyuberis, N.F. Zobov and J. Tennyson, J. Quant. Spectrosc. Radiat. Transf. 203, 88 (2017). doi:10.1016/j.jqsrt.2017.03.040
- E.K. Conway, I.E. Gordon, O.L. Polyansky and J. Tennyson, J. Chem. Phys. 152, 024105 (2020). doi:10.1063/1.5135931
- E.K. Conway, I.E. Gordon, J. Tennyson, O.L. Polyansky, S.N. Yurchenko and K. Chance, Atmos. Chem. Phys. 20, 10015 (2020). doi:10.5194/acp-20-10015-2020
- D. Herriott, H. Kogelnik and R. Kompfner, Appl. Opt. 3, 523 (1964). doi:10.1364/AO.3.000523
- D.R. Herriott and H.J. Schulte, Appl. Opt. 4, 883 (1965). doi:10.1364/AO.4.000883
- T.M. Rubin, Ph.D. thesis, Freie Universität Berlin, (2017). doi:10.17169/refubium-6520
- S. Langhoff and J. Bauschlicher, J. Chem. Phys. 102, 5220 (1995). doi:10.1063/1.469247
- D.W. Schwenke and H. Partridge, J. Chem. Phys. 113, 6592 (2000). doi:10.1063/1.1311392
- X. Huang, R. Freedman, S. Tashkun, D. Schwenke and T. Lee, J. Quant. Spectrosc. Radiat. Transf.130, 134–46 (2013). doi:10.1016/j.jqsrt.2013.05.018
- A. Nikitin, M. Rey and V. Tyuterev, Chem. Phys. Lett. 565, 5 (2013). doi:10.1016/j.cplett.2013.02.022
- G. Li, I. Gordon, L. Rothman, Y. Tan, S.-M. Hu, S. Kassi, A. Campargue and E. Medvedev, Astrophys. J. Suppl. Ser. 216, 15 (2015). doi:10.1088/0067-0049/216/1/15
- V. Tyuterev, A. Barbe, D. Jacquemart, C. Janssen, S. Mikhailenko and E. Starikova, J. Chem. Phys. 150, 184303 (2019). doi:10.1063/1.5089134
- J. Chang, L. Guo, R. Wang, J. Mou, H. Ren, J. Ma and H. Guo, J. Phys. Chem. A 123, 4232 (2019). doi:10.1021/acs.jpca.9b02662
- I.I. Mizus, A.A. Kyuberis, N.F. Zobov, V.Y. Makhnev, O.L. Polyansky and J. Tennyson, Philos. Trans. R. Soc. Lond. A 376, 20170149 (2018). doi:10.1098/rsta.2017.0149
- D.W. Schwenke, J. Phys. Chem. A 105, 2352 (2001). doi:10.1021/jp0032513
- S.V. Shirin, O.L. Polyansky, N.F. Zobov, P. Barletta and J. Tennyson, J. Chem. Phys. 118, 2124 (2003). doi:10.1063/1.1532001
- S.V. Shirin, N.F. Zobov, R.I. Ovsyannikov, O.L. Polyansky and J. Tennyson, J. Chem. Phys. 128, 224306 (2008). doi:10.1063/1.2927903
- I. Bubukina, N. Zobov, O. Polyansky, S. Shirin and S. Yurchenko, Opt. Spectrosc. 110, 160–166 (2011). doi:10.1134/S0030400X11020032
- O.L. Polyansky, A.A. Kyuberis, N.F. Zobov, J. Tennyson, S.N. Yurchenko and L. Lodi, Mon. Not. R. Astron. Soc. 480, 2597 (2018). doi:10.1093/mnras/sty1877
- T. Furtenbacher, R. Tóbiás, J. Tennyson, O.L. Polyansky and A.G. Császár, J. Phys. Chem. Ref. Data 49, 033101 (2020). doi:10.1063/5.0008253
- L. Lodi and J. Tennyson, J. Phys. B 43, 133001 (2010). doi:10.1088/0953-4075/43/13/133001
- H. Partridge and D.W. Schwenke, J. Chem. Phys. 106, 4618 (1997). doi:10.1063/1.473987
- D.W. Schwenke and H. Partridge, J. Chem. Phys. 113, 6592 (2000). doi:10.1063/1.1311392
- L. Lodi, R.N. Tolchenov, J. Tennyson, A.E. Lynas-Gray, S.V. Shirin, N.F. Zobov, O.L. Polyansky, A.G. Császár, J. van Stralen and L. Visscher, J. Chem. Phys. 128, 044304 (2008). doi:10.1063/1.2817606
- I.E. Gordon, L.S. Rothman, R.J. Hargreaves, R. Hashemi, E.V. Karlovets, F.M. Skinner, E.K. Conway, C. Hill, R.V. Kochanov, Y. Tan and P. Wcisło, J. Quant. Spectrosc. Radiat. Transf. 277, 107949 (2022). doi:10.1016/j.jqsrt.2021.107949
- S. Vasilchenko, S.N. Mikhailenko and A. Campargue, J. Quant. Spectrosc. Radiat. Transf. 275, 107847 (2021). doi:10.1016/j.jqsrt.2021.107847