
 ?Mathematical formulae have been encoded as MathML and are displayed in this HTML version using MathJax in order to improve their display. Uncheck the box to turn MathJax off. This feature requires Javascript. Click on a formula to zoom.
Abstract
Molecular hydrogen ions in weakly bound states close to the first dissociation threshold are attractive quantum sensors for measuring the proton-to-electron mass ratio and hyperfine-induced ortho-para mixing. The experimental accuracy of previous spectroscopic studies relying on fast ion beams could be improved by using state-of-the-art ion trap setups. With the electric-dipole moment vanishing in H and preventing fast spontaneous emission, radiative lifetimes of the order of weeks are found. We include the effect of black-body radiation that can lead to photodissociation and rovibronic state redistribution to obtain effective lifetimes for trapped ion experiments. Rate coefficients for bound-bound and bound-continuum processes were calculated using adiabatic nuclear wave functions and nonadiabatic energies, including relativistic and radiative corrections. Effective lifetimes for the weakly bound states were obtained by solving a rate equation model and lifetimes in the range of 4–523 and >215 ms were found at room temperature and liquid nitrogen temperature, respectively. Black-body induced photodissociation was identified as the lifetime-limiting effect, which guarantees the purity of state-selectively generated molecular ion ensembles. The role of hyperfine-induced g/u-mixing, which allows pure rovibrational transitions, was found to be negligible.
GRAPHICAL ABSTRACT
1. Introduction
The hydrogen molecular ion (HMI) is the simplest molecular system and can be used to test quantum electrodynamics and to determine fundamental constants by comparing experimental and theoretical transition frequencies [Citation1,Citation2]. While ab initio theory reached a level of relative accuracy for H
and HD
[Citation3,Citation4], a comparable experimental accuracy has only been achieved for the HD
isotopologue [Citation1,Citation2,Citation5]. In these experiments, rovibrationally-cold HD
ions are held in a radio-frequency trap and sympathetically cooled to reach the Lamb-Dicke regime in order to suppress Doppler effects during the spectroscopic interrogation.
Cooling the rovibrational degrees of freedom of the hot HD ions produced by electron bombardment relies on spontaneous emission; a process that is only possible in the heteronuclear isotopologues, because of the electric-dipole moment originating from the mass and charge asymmetry [Citation6]. The absence of that very dipole moment for the homonuclear isotopologues has far-reaching consequences regarding the ion production, as well as the multitude of strong transitions available for spectroscopic studies: (i) with radiative lifetimes of the order of weeks [Citation7], any rovibrational state distribution produced during electron bombardment will be conserved, drastically reducing the number of available ions participating in a single spectroscopic transition, and (ii) strong electric-dipole allowed transitions exist only between different electronic states.
Carrington and coworkers succeeded in measuring rovibronic transitions between weakly bound states of the ground (X) and first excited (A
) electronic states of H
just below the H(1s) + H
dissociation threshold [Citation8–12]. A fast ion beam with high current was used to compensate for the small number of ions per quantum state and having the transition frequencies in the microwave range helped limit the Doppler broadening. To avoid interaction broadening, the ion beam was directed through a sufficiently long microwave waveguide and the observation of forward and back-reflected modes allowed the cancellation of the first-order Doppler shifts. This resulted in an FWHM of 0.6 MHz and an absolute accuracy of the order of 0.5 MHz (relative accuracy
).
In a new generation of measurements, we aim at improving the accuracy of the transition frequencies between the weakly bound states, which have been found to show an enhanced sensitivity on the proton-to-electron mass ratio [Citation13], by employing a similar ion trap setup as used in Ref. [Citation2]. The suppression of Doppler-related effects and the careful control of magnetic fields over a small trap volume have been shown to allow to reach Hertz-level accuracy [Citation14].
This leaves the question of how to increase the population in individual quantum levels of the HMI, preferably creating the ions selectively in a single weakly bound rovibronic level. Such a state-selected ion generation can be achieved using mass-analysed threshold ionisation (MATI) [Citation15]: this involves photoexcitation with a laser, slightly red-detuned from the targeted level in the ion , which will lead via direct ionisation and auto-ionisation to ions in lower lying states
as well as high-n Rydberg states converging to the
threshold. The prompt ions in unwanted states can be spatially separated from the neutral molecules in the Rydberg states, which are subsequently field-ionised to selectively provide ions in the state
for subsequent experiments [Citation16].
In order to apply MATI for the efficient production of the weakly bound states in the vicinity of the dissociation threshold, a multi-step excitation pathway has to be employed to gradually increase the bond length from (X
) to
(X
), as shown in the photoelectron spectroscopic studies by Beyer and Merkt for H
, HD and D
[Citation17–19]. The crucial ingredient for the excitation of weakly bound ions, starting from the vibronic ground state of neutral molecular hydrogen, was the use of the long-range
and
intermediate states, first observed and characterised by W. Ubachs and his coworkers [Citation20–22]. These states belong to the class of ion-pair states [Citation23] and are characterised by large bond lengths and mixed electronic character (regarding the orbital-angular momentum ℓ in a single-centre description), allowing for the efficient generation of weakly bound molecular ions with N = 0−10.
Previous theoretical studies on the radiative lifetimes of the weakly bound states have shown lifetimes in excess of hundreds of seconds [Citation7,Citation24], even when including the effect of ortho-para or g/u-mixing due to the hyperfine structure [Citation25], making them very attractive for precision measurements. However, neither of these studies addressed the effect of photodissociation and state redistribution induced by black-body radiation (BBR). The peak of the black-body spectrum (BBS) at room temperature is located at around 17 THz, overlapping with the electric-dipole spectrum of the weakly bound states and supporting the possibility of having a perceptible effect on the lifetimes and the state distribution of the selectively prepared ions.
In the following, we present a theoretical study on the effective lifetimes of HMI in weakly bound states, taking the effects of BBR and g/u-mixing into account. Section 2 shows the calculation of the Einstein coefficients for bound-bound and bound-continuum transitions, required to solve the rate equations for the HMI. Effective lifetimes and the time evolution of the state distributions are shown in Section 3 and in Section 4 the results are discussed in view of the planned precision measurements mentioned above.
2. Theory
2.1. Level structure
In this study, we consider electric-dipole transitions between rovibrational levels of the electronic ground and excited state X and A
, respectively. To determine the transition strengths, the vibrational wave functions are obtained by solving the nuclear Schrödinger equation
(1)
(1) where μ is the nuclear-reduced mass and R is the internuclear distance.
is the Born-Oppenheimer (BO) potential energy curve with the adiabatic correction added and was taken from Ref. [Citation26]. Atomic units and the values of the fundamental constants from 2018 CODATA [Citation27] were used. The integration is performed using the renormalised Numerov method [Citation28] with a radial step size of
, resulting in dissociation energies in agreement with the ones given in Ref. [Citation24]. Small deviations below 1 cm
originate from disregarding nonadiabatic, relativistic and QED effects in the current calculation, which tend to vanish for the dissociation energies of the weakly bound states, as the molecular corrections approach the atomic values. The rate coefficients in Section 2.3 are obtained using the adiabatic nuclear wave functions, but employing the exact nonadiabatic energies (including relativistic and radiative corrections) from Ref. [Citation24].
The X state has 19 vibrational states with at least 4 rotational levels,
, and v = 19, which has only 2 rotational levels, N = 0 and N = 1. The repulsive A
state supports one vibrational state, v = 0, with three rotational levels,
. A v = 1 halo state exists when the hyperfine structure is neglected [Citation18,Citation29] but was disregarded in the current work because of an insignificant Franck-Condon overlap. The relevant weakly bound states are depicted in the energy-level diagram in Figure , where it can be seen that the X
levels lie above the A
manifold, allowing for spontaneous emission. Rovibrational states of X
with
and
are considered, with the range of v based on the value of the Franck-Condon factor, which rapidly decreases from
for A
X
to
for A
X
.
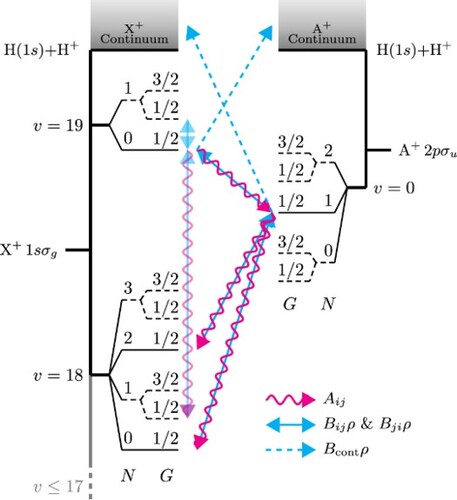
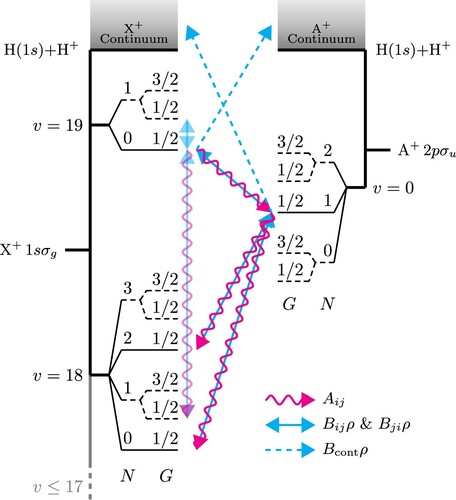
Figure 1. Energy-level diagram of the weakly bound states of H. The ground electronic state, X
, is depicted on the left-hand side, displaying the dissociation continuum on the top and the two highest vibrational levels. Levels with v = 13−17 are not shown for clarity but are taken into account in the calculation On the right-hand side, the first excited electronic state, A
, is shown with a single vibrational level, v = 0, and the dissociation continuum. For both electronic states, the rotational levels denoted with a dashed line are the ortho-levels with I = 1. The arrows represent a simplified version of the transitions present for para-H
with the whole population starting in the X
(
) level; wavy red lines indicate spontaneous emission, the double-headed solid blue lines show stimulated emission and absorption, and the single-headed dashed blue line stands for absorption into the continuum (all states experience absorption into the continuum, but only a few are explicitly shown). The forbidden transitions, allowed by g/u-mixing, are also shown. Neglecting spin-rotation interactions, the levels F are degenerate and not shown.
The dissociation continua of the X and A
state, indicated as a shaded area at the top of Figure , play a crucial role in the present calculation. The continuum wave functions are obtained using outward integration of Equation (Equation1
(1)
(1) ) and are energy normalised by scaling their amplitude to
with
, and ϵ being the kinetic energy of the continuum state [Citation30]. The energy-normalised continuum wave functions have dimensions of [(Length Energy)
]. To adequately account for the photodissociation of the X
and X
states, the continuum of A
is taken into account with
.
The hyperfine structure of the rovibrational levels in H is described using Hund's case
with the coupling scheme:
The coupling of
and
to form
is caused by the Fermi contact interaction,
(2)
(2) which is the leading term in the hyperfine Hamiltonian with
of the order of
MHz. The coupling constants were computed using the adiabatic nuclear wave functions and the electron densities from Ref. [Citation18] (see Tables and in Appendix 1). For X
we find excellent agreement with the experimentally determined value from Ref. [Citation10].
The two nuclear-spin modifications para, with I = 0, and ortho, with I = 1, combine with even (odd) and odd (even) rotational levels of the X (A
) state, respectively, as imposed by the Pauli principle. The rotational levels of ortho-H
are indicated using dashed lines in Figure . The Fermi contact interaction in Equation (Equation2
(2)
(2) ) splits each rotational level in ortho-H
in a
and
component, whereas no splitting appears for para-H
with
. The couplings of the electron and nuclear spins to the molecular rotation are weak and were neglected, which leads to a degeneracy of all F components for a given
pair.
Close to the dissociation limit, the hyperfine interaction becomes comparable to the splitting of the gerade and ungerade electronic states, which leads to g/u-mixing (or ortho-para mixing) of levels with and the same value of N [Citation31].
2.2. Line strengths
To calculate the population redistribution induced by BBR, we evaluate the line strength for the electric-dipole transition from lower state to upper state
, defined as [Citation32]
(3)
(3) which was expressed in a rotational and vibronic part in the second line, with the electric-dipole transition moment
. The quantum numbers
or ϵ indicate if the upper state is bound or a continuum state. For clarity, the quantum numbers
and I = 0, 1 are not explicitly written and the vibrational quantum number v is replaced with ϵ for continuum states. After transforming to the molecular-fixed coordinate system, the rotational integral can be obtained by making use of the following matrix element [Citation33,Citation34]
(4)
(4)
For transitions, q = 0, and these matrix elements vanish unless
and
. For isotropic excitation (BBR is unpolarised) and emission, Equation (Equation4
(4)
(4) ) is summed over p, M and
, and the Hönl-London factor
including hyperfine structure is obtained as:
(5)
(5) In the following, the Hönl-London factor for a rotational line without and with spin is considered.
Neglecting spin, with and F = N, Equation (Equation5
(5)
(5) ) simplifies to the more common expression
(6)
(6) For the general case in Equation (Equation5
(5)
(5) ), we establish the sum rule
(7)
(7) using the orthogonality of the 6-j symbols [Citation34,Citation35]. Notice, that the right-hand side of this equation depends on spin only through the factor of
. When I = 0,
, and the spin-independent Hönl-London factor is recovered, multiplied with the electron spin degeneracy factor
[Citation35,Citation36].
The vibronic matrix elements of were calculated using the adiabatic nuclear wave functions from Equation (Equation1
(1)
(1) ) and the electric-dipole transition moment,
from Ref. [Citation26]. For bound-bound transitions we have
(8)
(8) and the transition moments for pure rovibrational transitions due to g/u-mixing were taken from Ref. [Citation25].
For bound-continuum transitions to a dissociative state with kinetic energy ϵ, for instance, XA
, the matrix elements of
are given by
(9)
(9) where
are continuous functions of the photon energy,
(10)
(10) and
is the binding energy of the bound state. Notice that since the continuum wave functions are energy-normalised, this transition moment has units of
.
Finally, Equation (Equation3(3)
(3) ) can be written for our specific case as
(11)
(11) The photodissociation cross-section (PDCS) in atomic units (
) is given by [Citation10,Citation36]
(12)
(12) and is obtained by summing over all
and
. Using Equation (Equation7
(7)
(7) ), the total state degeneracy factor
in the denominator simplifies to
.
2.3. Einstein coefficients and rate equations
To determine the time evolution of an ion ensemble prepared in a single initial state, we solve the rate equations of the form
(13)
(13) where the notation has been shortened, where appropriate, such that the indices i and j stand for any state
,
is the number of ions in the state j,
is the rate of spontaneous emission for the transition
,
is the rate of stimulated emission,
is the rate of absorption, and
is the rate of absorption to the continuum.
The rate of spontaneous emission in atomic units () is given by
(14)
(14) where
is the degeneracy of the initial state. It can be shown that this equation determines the decay rate of, both, a rotational line without spin using the Hönl-London factor from Equation (Equation6
(6)
(6) ) with
, and a hyperfine level F using Equation (Equation4
(4)
(4) ) with
[Citation37]. However, to obtain the decay rate for a rotational line with spin it is necessary to sum over the fine or hyperfine structure levels F and
[Citation32,Citation37,Citation38], that is,
(15)
(15) where
[Citation35]. This can be simplified to
(16)
(16) Similar to the PDCS the dependence on G cancels out so that different hyperfine levels G from a rovibrational state (vN) decay at the same rate to another state
. The combination of Hönl-London factor and initial state degeneracy in Equation (Equation14
(14)
(14) ) for different cases can be summarised as follows:
(17)
(17) where the first line is for a spin-less rotational line, the second line is for a rotational line with electronic spin and I = 0, the third line is for a rotational line with nuclear spin, the fourth line is for a hyperfine level F, and the last line is for a Zeeman component of the hyperfine structure.
The rate of stimulated emission in Equation (Equation13
(13)
(13) ) has the same units as
and is related to the Einstein
coefficient through the photon density,
, that is,
(18)
(18) where
is given in atomic units
by
(19)
(19)
(20)
(20) with atomic units
.
For absorption, the rate coefficient is expressed as
(21)
(21) The rate of absorption to the continuum – or photodissociation rate –,
, was calculated using Equation (Equation18
(18)
(18) ) and Equation (Equation19
(19)
(19) ) considering the
-dependent electric-dipole moment, as in Equation (Equation12
(12)
(12) ). Then, we integrated with respect to
and summed over the possible
values in the continuum, to obtain
(22)
(22)
This equation is equivalent to the photodissociation rate [Citation39], , where I is the radiation intensity distribution. Numerical integration of this equation is performed using Gauss-Legendre quadrature with 4000 energy steps in the range
.
3. Results
Figure (a) displays the A – X
stick spectrum with the line strengths according to Equation (Equation11
(11)
(11) ), which agree with those of Ref. [Citation40] within 0.03%. The transitions appear grouped in vibrational bands and spread over a frequency range from 14 GHz to 62 THz. In the low-frequency region, the transitions involving the two highest vibrational levels of the ground state (v = 18, 19) exhibit the largest line strengths, up to 338
. This is caused by the favourable Franck-Condon factors and the large transition dipole moment (proportional to the internuclear distance), which is characteristic of charge-transfer transitions [Citation41]. It can be noticed, that the spacing between individual rotational lines and vibrational bands becomes comparable when approaching the dissociation threshold, indicating the breakdown of the BO approximation and a reversal of the typical hierarchy of motion.
Figure 2. (a) Bound-bound A – X
stick spectrum of H
, with the labels indicating the vibrational bands. The forbidden transitions (allowed by g/u-mixing) are indicated as dashed lines. (b) Photodissociation cross-section for X
(solid line) and A
(dash-dotted line). For comparison, X
is also shown. (c) Black-body photon density at room (solid line) and at liquid nitrogen (dashed line) temperature. See text for details.
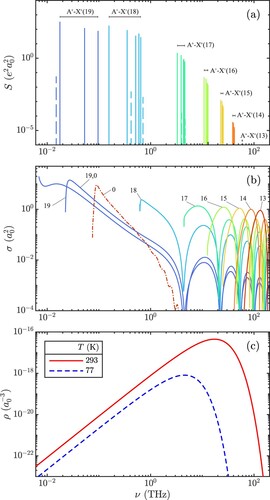
The dashed lines in Figure (a) indicate the transitions, which appear because of intensity borrowing due to the g/u-mixing. The strongest additional line is attributed to the purely rotational X(19,0)-(19,1) transition, which was experimentally observed by Critchley and coworkers [Citation42].
The PDCS for X and A
as obtained from Equation (Equation12
(12)
(12) ) is shown in Figure (b). For clarity, we omitted the PDCS of the levels with
, which shows a similar shape. The largest N-dependence of the PDCS is expected for X
(19) and can be seen to be of the order of
, by comparing the curves for X
(19,0) and X
(19,1). For lower vibrational states, the difference in the PDCS vanishes – in accordance with the BO approximation. Three relevant characteristics of the PDCS can be noticed: (i) A threshold appears, located at the dissociation energy of the rovibrational level, which increases with decreasing v, (ii) They possess a global maximum close to their threshold, and (iii) Successive local maxima decrease in amplitude.
Employing Equation (Equation20(20)
(20) ), Figure (c) illustrates the BBS photon density at room temperature (293 K) and at liquid nitrogen temperature (77 K), with maxima at 17 and 4 THz, respectively. A comparison of Figure (a–c) clearly exemplifies the importance of BBR induced processes for bound-bound and bound-continuum transitions involving the weakly bound states, with the BBS peak overlapping with the maximum of the PDCS of the levels X
.
To study the time evolution of the ion's rovibronic state distribution under the influence of BBR, the rate equations in Equation (Equation13(13)
(13) ) were solved for different initial conditions, corresponding to having all ions in a single rovibronic state.
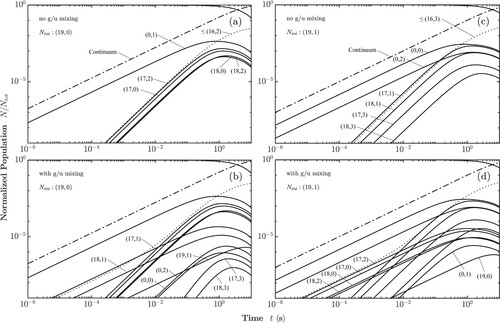
Figure and Figure display the internal state distributions as a function of time, with the population being initially in the X(19,0) and X
(19,1) state at 293 and 77 K, respectively. The possible excitation and decay pathways for ions initially in the X
(19,0) state are indicated in Figure , where X
states are not shown for clarity but are connected in the same way as X
(18). Solving the corresponding rate equations for T = 293 K leads to the normalised populations as shown in Figure (a). As dictated by the electric-dipole selection rules, the X
(19,0) population can only be transferred to the A
(0,1) bound state, or into the A
dissociation continuum, with the latter process being much more efficient. Subsequently, the A
(0,1) state is transferred to the lower lying X
levels via spontaneous and stimulated emission. Whereas stimulated emission is dominant at 293 K for transitions down to X
(17,2), spontaneous emission becomes the dominant process for the population of the level X
(17,0) and below. Numerical values of the rate coefficients can be found in Tables – in Appendix 2. After a few hundred milliseconds, the population of the initially unpopulated bound states reaches a maximum, before ultimately approaching zero because of BBR-induced photodissociation. A noteworthy exception are X
states with
, approximately 0.001% of the initial population, which are trapped because the BBR does not provide enough photon flux at these high frequencies.
Figure 3. Time evolution of the rovibronic state populations at 293 K with the ions selectively prepared in: (a) Para-X with no g/u-mixing. (b) Para-X
including g/u-mixing. Labels are added to the now-accessible ortho-states and the repeated labels from panel (a) are omitted. (c) Ortho-X
without g/u-mixing. (d) Ortho-X
with g/u-mixing.
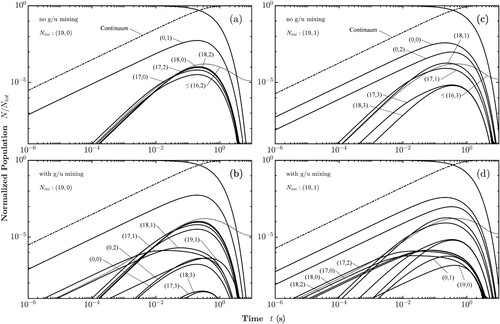
Figure 4. Time evolution of the rovibronic state populations at 77 K with the ions selectively prepared in: (a) Para-X with no g/u-mixing. (b) Para-X
including g/u-mixing. Labels are added to the now-accessible ortho-states and the repeated labels from panel (a) are omitted. (c) Ortho-X
without g/u-mixing. (d) Ortho-X
with g/u-mixing.
All states populated during the decay of X(19,0) are para-H
states with
, unless the g/u-mixing is taken into account. The mixing of gerade and ungerade levels allows pure rovibrational transitions, which were included in the rate equations, and the results are shown in Figure (b) for X
, where it can be seen that also ortho-H
states attain non zero population (only the
component, as we have
). The forbidden transitions lead to population in X
, X
, and X
, and eventually through absorption and emission via the A
states also to some population in X
and X
. Despite the effect of the g/u-mixing, the decay of the initial state is not significantly affected, because the line strengths of the forbidden transitions are too small to compete with direct photodissociation. The maximum population in the intermediately populated ortho-states remains two orders of magnitude smaller than the maximum population acquired by the intermediate para-states.
Figure (c,d) considers the state redistribution with and without g/u-mixing starting in the X level. The overall behaviour is similar to the one discussed for X
, with the main difference that the initial state with N = 1 has now two bound states to transfer to, A
and A
. It can be seen that the states X
and X
attain a larger population than the states X
and X
, as the latter states can be only reached from level A
.
The rovibronic state evolution at 77 K is presented in Figure . Most results are qualitatively the same as for room temperature; however, two main differences can be identified: (i) Photodissociation rates are reduced compared to room temperature so that the bound-bound redistribution becomes more important and intermediate levels reach around 3% of the initial population. (ii) The vibrational state with the largest acquired population is X instead of X
. This is because the population transfer between A
and X
at 293 K is mainly driven by stimulated emission. However, at 77 K, this rate of stimulated emission is about 33% lower and the redistribution is mostly driven by spontaneous emission, which favours population transfer to the X
level.
The lifetime of a quantum state can be calculated from the spontaneous emission rate as
(23)
(23)
In the presence of resonant radiation, an effective lifetime can be defined that also takes into account stimulated emission and absorption [Citation43]:
(24)
(24)
These effective lifetimes were calculated for all weakly bound states by solving the rate equations and determining the time at which the normalised population of the initial state reached 1/e. Estimation of the effective lifetimes was obtained using Equation (Equation24(24)
(24) ) and was found to agree with the numerical results within 3%. The results for 293 and 77 K are presented in Tables and , respectively, and are displayed in Figure . The following observations can be made: (i) At 293 K, the lifetimes range from 4 ms for X
to 523 ms for X
, whereas at 77 K, they range from 216 ms for X
– two orders of magnitude more – to 1 min for X
or days for X
. (ii) The lifetimes of the various rotational levels for a particular vibrational state are very similar. (iii) The lifetimes of the A
states are not significantly affected by the change in temperature. (iv) The effect of the g/u-mixing is insignificant.
Figure 5. Effective lifetimes of the weakly bound states of H. A line is drawn connecting states with N = 0; dashed blue line for 77 K, solid orange line for 293 K and dash-dotted red line for 400 K.
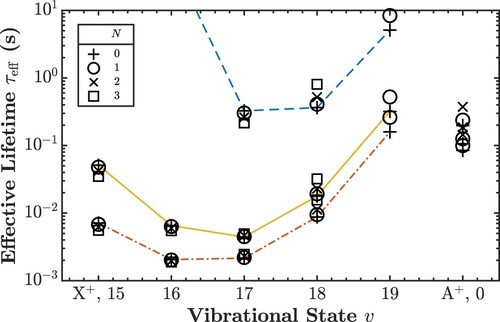
Table 1. Effective lifetimes of the weakly bound states of H at 293 K. Level v = 0 corresponds to A
, the other levels to X
.
Table 2. Effective lifetimes of the weakly bound states of H at 77 K. Level v = 0 corresponds to A
, the other levels to X
.
It should be noticed that for states with , the effective lifetime from Equation (Equation24
(24)
(24) ) becomes
, so absorption to the continuum is the determining factor for the lifetime.
To estimate the error in the rate constants and the calculated effective lifetimes, we determine the sensitivity of A and regarding the following approximations: (i) Using BO vibrational wave functions and energies results in a change of
and
. (ii) Using adiabatic wave functions and energies leads to
and
. (iii) Using adiabatic wave functions and nonadiabatic energies including relativistic and radiative corrections from Ref. [Citation24], but increasing the stepsize of the potential to
, we obtain
and
.
4. Discussion and outlook
This work sought to calculate the rovibronic population redistribution induced by BBR to determine the viability of conducting microwave spectroscopy of the weakly bound states of state-selectively produced, trapped H ions. The necessity to include the effect of BBR for estimating effective lifetimes is motivated by the overlap of the BBR spectrum at room temperature with the A
-X
electronic spectrum of H
.
We presented the time evolution of the internal state distribution for room temperature and liquid nitrogen temperature. Interestingly, it was found that the largest contribution to the population redistribution comes from absorption to the continuum, given by . These coefficients are one to two orders of magnitude larger than A and
at 293 K, and of the same order of magnitude at 77 K. The rovibrational level with the largest photodissociation rate is X
with
at 293 K and, in contrast,
and
for A
X
.
As the main result of this work, we find effective lifetimes of the order of milliseconds at 293 K, which can be increased to hundreds of milliseconds or even seconds at 77 K. This finding is in agreement with the measurements reported in Refs. [Citation8,Citation9,Citation11,Citation44], which demonstrated the possibility of conducting molecular ion-beam experiments in the microwave range with an interaction time of 0.3 µs.
More importantly, the found lifetimes of the highly excited, weakly bound states will allow for state-of-the-art ion trap experiments with millisecond interaction times, similar to the ones carried out using the vibrational ground state in HD. Specifically, the lifetimes are sufficiently long to enable transport and trap-loading of the ions, prepared in a separate photoexciation region. The X
(v=19) levels are identified as optimal ‘transfer states’ by having the longest lifetimes among the weakly bound states at room and liquid nitrogen temperature. Once the ions are moved into the trap, the population could be transferred to different science states by adiabatic passage using microwave radiation. We also determined effective lifetimes at 400 K, which are shown in Figure and listed in Table , for the case of elevated temperatures in the trap region, which might be caused by rf heating. Compared to room temperature, the lifetimes are reduced by about a factor of two.
Table 3. Effective lifetimes of the weakly bound states of H at 400 K. Level v = 0 corresponds to A
, the other levels to X
.
The effect of g/u-mixing experienced mainly by the X and X
levels was found to reduce their fluorescence lifetime by 30% to about 1000 s [Citation45]. In this work, we found that the effect of g/u-mixing is negligible when the interaction with BBR is included: the effective lifetime of X
is reduced by only 210 µs, about 0.011%, and the effective lifetime of X
is reduced by merely 60 µs, about 0.001%.
Other compelling findings of this study are the following: (i) The lifetime of A does not significantly vary with temperature and barely doubles when going from 293 to 77 K. This is because the state has a vanishing PDCS well before the peak of the BBS and the contribution from dissociation mostly comes from the GHz region, where the BBS does not decrease as drastically with temperature as in the THz region (see Figure ). This may set a limit on the interaction time of experiments relying on this state; (ii) The states of X
cannot decay via electric-dipole transitions and their lifetime from electric-quadrupole transitions are on the order of days, nonetheless, as a consequence of BBR, they have an effective lifetime even shorter than the higher vibrational levels; (iii) For an initial population of
ions in X
levels (see Figure ), only one ion is expected to reach A
by the time this state reaches its maximum population, while most of the total population is transferred to the continuum. This means, that the high purity of state-selectively prepared molecular ion ensembles is conserved, enabling a high signal-to-noise ratio.
Experiments with trapped H ions relying on weaker two-photon or electric-quadrupole transitions can make use of more strongly bound X
states, for which BBR-induced photodissociation is irrelevant. Several such studies are currently pursued, in one case H
ions are produced in the vibrational ground state X
by photoionisation inside a rf trap [Citation46], whereas in the other case a single H
ion is injected into a Penning trap, which allows to determine the rovibrational state before driving a spectroscopic transition [Citation47].
Disclosure statement
No potential conflict of interest was reported by the author(s).
Additional information
Funding
References
- S. Alighanbari, G.S. Giri, F.L. Constantin, V.I. Korobov and S. Schiller, Nature 581, 152–158 (2020). doi:10.1038/s41586-020-2261-5
- S. Patra, M. Germann, J.-P. Karr, M. Haidar, L. Hilico, V.I. Korobov, F.M.J. Cozijn, K.S.E. Eikema, W. Ubachs and J.C.J. Koelemeij, Science 369, 1238–1241 (2020). doi:10.1126/science.aba0453
- V.I. Korobov, L. Hilico and J.-P. Karr, Phys. Rev. A 89, 032511 (2014). doi:10.1103/PhysRevA.89.032511
- V.I. Korobov, L. Hilico and J.-P. Karr, Phys. Rev. Lett. 118, 233001 (2017). doi:10.1103/PhysRevLett.118.233001
- J.C.J. Koelemeij, B. Roth, A. Wicht, I. Ernsting and S. Schiller, Phys. Rev. Lett. 98, 173002 (2007). doi:10.1103/PhysRevLett.98.173002
- P. Bunker, Chem. Phys. Lett. 27, 322–324 (1974). doi:10.1016/0009-2614(74)90233-4
- J.M. Peek, A. Hashemi-Attar and C.L. Beckel, J. Chem. Phys. 71, 5382 (1979). doi:10.1063/1.438353
- A. Carrington, I.R. McNab and C.A. Montgomerie, Chem. Phys. Lett. 160, 237–242 (1989). doi:10.1016/0009-2614(89)87589-X
- A. Carrington, I.R. McNab, C.A. Montgomerie and J.M. Brown, Mol. Phys. 66, 1279–1289 (1989). doi:10.1080/00268978900100881
- A. Carrington, C.A. Leach, R.E. Moss, T.C. Steimle, M.R. Viant and Y.D. West, J. Chem. Soc. Faraday Trans. 89, 603 (1993). doi:10.1039/ft9938900603
- A. Carrington, C.A. Leach, A.J. Marr, R.E. Moss, C.H. Pyne and T.C. Steimle, J. Chem. Phys. 98, 5290–5301 (1993). doi:10.1063/1.464928
- A. Carrington, C.A. Leach and M.R. Viant, Chem. Phys. Lett. 206, 77–82 (1993). doi:10.1016/0009-2614(93)85520-X
- L. Augustovičová, P. Soldán, W.P. Kraemer and V. Špirko, MNRAS 439, 1136–1139 (2014). doi:10.1093/mnras/stu060
- S.C. Menasian, Ph.D. thesis, School University of Washington, Seattle, 1973.
- L. Zhu and P. Johnson, J. Chem. Phys. 94, 5769–5771 (1991). doi:10.1063/1.460460
- S. Mackenzie and T. Softley, J. Chem. Phys. 101, 10609–10617 (1994). doi:10.1063/1.467875
- M. Beyer and F. Merkt, Phys. Rev. Lett. 116, 093001 (2016). doi:10.1103/PhysRevLett.116.093001
- M. Beyer and F. Merkt, Phys. Rev. X 8, 031085 (2018). doi:10.1103/PhysRevX.8.031085
- M. Beyer and F. Merkt, Mol. Phys. e2048108 (2022). doi:10.1080/00268976.2022.2048108
- E. Reinhold, W. Hogervorst and W. Ubachs, Phys. Rev. Lett. 78, 2543–2546 (1997). doi:10.1103/PhysRevLett.78.2543
- E. Reinhold, W. Hogervorst, W. Ubachs and L. Wolniewicz, Phys. Rev. A 60, 1258–1270 (1999). doi:10.1103/PhysRevA.60.1258
- A. de Lange, W. Hogervorst, W. Ubachs and L. Wolniewicz, Phys. Rev. Lett. 86, 2988–2991 (2001). doi:10.1103/PhysRevLett.86.2988
- E. Reinhold and W. Ubachs, Mol. Phys. 103, 1329–1352 (2005). doi:10.1080/00268970500050621
- R.E. Moss, Mol. Phys. 80, 1541–1554 (1993). doi:10.1080/00268979300103211
- P.R. Bunker and R.E. Moss, Chem. Phys. Lett. 316, 266–270 (2000). doi:10.1016/S0009-2614(99)01301-9
- M. Beyer and F. Merkt, J. Mol. Spectrosc. 330, 147–157 (2016). doi:10.1016/j.jms.2016.08.001
- E. Tiesinga, P.J. Mohr, D.B. Newell and B.N. Taylor, J. Phys. Chem. Ref. Data. 50, 033105 (2021). doi:10.1063/5.0064853
- B.R. Johnson, J. Chem. Phys. 67, 4086 (1977). doi:10.1063/1.435384
- J. Carbonell, R. Lazauskas, D. Delande, L. Hilico and S. Kiliç, Europhys. Lett. 64, 316 (2003). doi:10.1209/epl/i2003-00176-1
- E. Merzbacher, Quantum Mechanics (Jones & Bartlett Publishers, 1961).
- M. Beyer and F. Merkt, J. Chem. Phys. 149, 214301 (2018). doi:10.1063/1.5046147
- M. Larsson, Astron. Astrophys. 128, 291 (1983).
- J.M. Brown and A. Carrington, Rotational Spectroscopy of Diatomic Molecules (Cambridge University Press, 2003).
- R.N. Zare, Angular Momentum: Understanding Spatial Aspects in Chemistry and Physics (John Wiley & Sons, New York, 1988).
- J.K. Watson, J. Mol. Spectrosc. 252, 5–8 (2008). doi:10.1016/j.jms.2008.04.014
- H. Lefebvre-Brion and R.W. Field, The Spectra and Dynamics of Diatomic Molecules: Revised and Enlarged Edition (Elsevier, 2004).
- E.E. Whiting, Ph.D. thesis, School York University, Ontario, 1972.
- A. Thorne, Spectrophysics (Chapman and Hall, 1974).
- J. Koelemeij, Phys. Chem. Chem. Phys. 13, 18844 (2011). doi:10.1039/c1cp21204d
- M.H. Howells and R.A. Kennedy, Chem. Phys. Lett 184, 521–525 (1991). doi:10.1016/0009-2614(91)80028-V
- R.S. Mulliken, J. Chem. Phys. 7, 20–34 (1939). doi:10.1063/1.1750319
- A.D.J. Critchley, A.N. Hughes and I.R. McNab, Phys. Rev. Lett. 86, 1725–1728 (2001). doi:10.1103/PhysRevLett.86.1725
- W. Demtröder, Laser Spectroscopy 1: Basic Principles (Springer, 2014).
- A. Carrington, Science 274, 1327–1331 (1996). doi:10.1126/science.274.5291.1327
- R.E. Moss, Chem. Phys. Lett. 206, 83–90 (1993). doi:10.1016/0009-2614(93)85521-O
- J. Schmidt, T. Louvradoux, J. Heinrich, N. Sillitoe, M. Simpson, J.-P. Karr and L. Hilico, Phys. Rev. Appl. 14, 024053 (2020). doi:10.1103/PhysRevApplied.14.024053 2008.11407.
- B. Tu, F. Hahne, I. Arapoglou, A. Egl, F. Heiße, M. Höcker, C. König, J. Morgner, T. Sailer, A. Weigel, R. Wolf and S. Sturm, Adv. Quantum Technol. 4, 2100029 (2021). doi:10.1002/qute.v4.72104.03719.
Appendices
Appendix 1.
Coupling constant for the Fermi contact interaction
The Fermi coupling constants of the weakly bound states were obtained by averaging the electron density at the position of the nuclei using the rovibrational wave functions obtained in Section 2.1, that is,
(A1)
(A1) where
(A2)
(A2) which was taken from Ref. [Citation18], and η indicating the electronic state. The results are listed in Tables and .
Appendix 2.
Numerical results from the electric-dipole moment
The numerical results for the bound-bound line strengths and the Einstein rate coefficients computed in Section 2 are summarised in Tables –. Absorption rate coefficients for the excitation into the continuum are presented in Tables and .
Table B1. Effective coupling constants of the Fermi interaction for the weakly bound states of H in X
.
Table B2. Effective coupling constants of the Fermi interaction for the weakly bound states of H in A
.
Table C1. Bound-bound line strengths and Einstein rate coefficients of the weakly bound states of H for transitions involving A
.
Table C2. Bound-bound line strengths and Einstein rate coefficients of the weakly bound states of H for transitions involving A
.
Table C3. Bound-bound line strengths and Einstein rate coefficients of the weakly bound states of H for transitions involving A
.
Table C4. Continuum absorption rates of the weakly bound states of H at 293 K.
Table C5. Continuum absorption rates of the weakly bound states of H at 77 K.