
 ?Mathematical formulae have been encoded as MathML and are displayed in this HTML version using MathJax in order to improve their display. Uncheck the box to turn MathJax off. This feature requires Javascript. Click on a formula to zoom.
Abstract
We consider several molecules characterised by π-electron conjugation whose extent changes along a flexible torsional coordinate, and which represent the monomer units of polymorphic molecular crystals. Delocalisation error in density functional theory (DFT) adversely impacts conformational energies in these species, overstabilising the conformation that maximises conjugation length and leading to incorrect relative energies for the corresponding crystal polymorphs. We demonstrate that density-corrected (DC-)DFT, in which a DFT exchange-correlation functional is evaluated using a Hartree–Fock density, significantly reduces these conformational energy errors. When DC-DFT monomer energies are used as a low-cost intramolecular correction to a periodic DFT calculation of the molecular crystal, the resulting relative polymorph energies are within 1 kJ/mol of benchmark results.
GRAPHICAL ABSTRACT
1. Introduction
Crystal packing plays an important but difficult-to-predict role in controlling physical properties of organic molecular crystals, including solubility, shelf stability, and bioavailability [Citation1–3]. Polymorphism [Citation1–4], or the potential to form multiple distinct crystal packing motifs, is critically important to the pharmaceutical industry [Citation3,Citation5], as highlighted by the case of the HIV drug ritonavir, where the appearance of a previously unknown and low-solubility polymorph made it impossible to produce the original polymorph and forced a drug recall [Citation6]. Other pharmaceutical examples of such ‘disappearing polymorphs’ are known [Citation7–9], and more recently it has been suggested that the thermodynamically stable crystal form has not been found experimentally for 15–45% of small-molecule drugs currently available on the market [Citation10].
Over the past decade, ab initio crystal structure prediction has moved from the category of ‘impossible’, as it was famously characterised 30 years ago [Citation11,Citation12], to merely ‘extremely challenging’ [Citation13–23]. Successful crystal structure prediction, including quantitative ranking of low-energy polymorphs, is most feasible for small-molecule species with limited conformational flexibility [Citation24–26]. Quantitative prediction of thermodynamically stable polymorphs comes with stringent accuracy requirements, as an estimated 50% of polymorph pairs differ by less than 2 kJ/mol and around 95% of the conformers differ by less than 8 kJ/mol [Citation4,Citation27,Citation28].
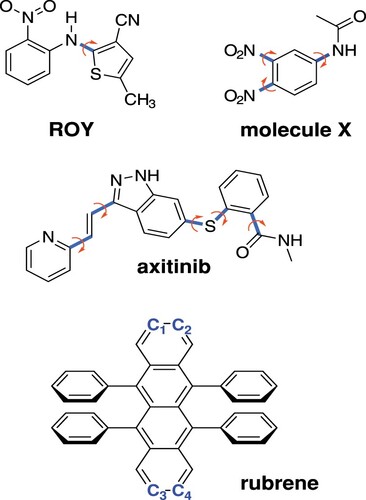
Dispersion-corrected density functional theory (DFT+D) had made enormous strides towards making crystal structures predictable from first principles [Citation22,Citation29–34], but this success is mitigated in certain cases by overstabilisation of delocalised π-electron systems [Citation26,Citation28,Citation35,Citation36], which is a consequence of self-interaction error (SIE) [Citation37]. This issue is thought to impact polymorph prediction in well-known examples such as the anti-cancer drug axitinib [Citation26], the organic semiconductor molecule rubrene [Citation38], the well-studied ROY molecule [Citation26,Citation28,Citation35,Citation39,Citation40], molecule X [Citation26,Citation41] from the third blind test of crystal structure prediction [Citation42], as well as other systems [Citation26,Citation36,Citation43]. Structures for several of these molecules are shown in Figure . Each of these molecules exhibits conformational polymorphism whereby changes in intramolecular conformation access different intermolecular crystal packing motifs. Notably, in each of these molecules, the extent of π-electron delocalisation changes as a function of one or more intramolecular torsional coordinates. To the extent that delocalisation error may overstabilise the more highly-conjugated conformations, we expect that DFT will produce erroneous conformational energy profiles for these flexible monomers. Those errors propagate into errors in the relative energies for the crystal polymorphs formed from these monomers [Citation26,Citation28,Citation35,Citation39]. Given the small energy differences between polymorphs, even modest conformational energy errors can have a qualitative impact on polymorph stability ordering.
Figure 1. Structures of the four molecules investigated in this work, indicating the torsional angles that modify the conjugation length. In rubrene, it is a twisting of the C–C
–C
–C
dihedral angle that modulates the conjugation.
In principle, these issues can be addressed using more advanced electronic structure models, but application of such methods to periodic crystals of pharmaceutical-sized molecules is generally cost-prohibitive. A more pragmatic approach combines a conventional periodic DFT calculation using a generalised gradient approximation (GGA) with an intramolecular correction based on the difference between the baseline DFT functional and a more advanced model, computed for a gas-phase molecule [Citation26]. For example, using the B86bPBE+XDM functional [Citation44–46], a GGA that includes a dispersion correction based on the exchange dipole moment (XDM) [Citation46], in combination with dispersion-corrected second-order Møller–Plesset perturbation theory (MP2D) [Citation47,Citation48], the resulting polymorph stability rankings are consistent with experiment for crystalline ROY, acetamidobenzamide, and axitinib [Citation26,Citation40].
A possible alternative solution to the π-delocalisation problem comes in the form of density-corrected (DC-)DFT [Citation49–55]. In this approach, an approximate density functional is evaluated using a density
that is obtained at the Hartree–Fock (HF) level:
(1)
(1) This procedure, which has also been called HF-DFT [Citation56,Citation57], has been shown to correct some of the worst delocalisation problems associated with GGA functionals, including those with reaction barrier heights [Citation57–59], torsional barriers [Citation60], halogen bonding [Citation61], potential energy surfaces for main-group radicals [Citation49–51], and polaron defects in metal oxide materials [Citation59]. In the present work, we investigate the ability of DC-DFT to correct conformation energies of the π-delocalised systems in Figure , and examine how that impacts the predicted stabilities of the corresponding polymorphs.
2. Methods
2.1. DC-DFT
In conventional Kohn–Sham DFT, the approximate energy functional is minimised with respect to ρ. The resulting energy approximates what would be obtained via optimisation of an exact functional
, if the latter were known. Burke, Sim, and coworkers [Citation49–55] suggest that it is pedagogically useful to separate the error
into two contributions: a functional-driven part
(2)
(2) that originates in the approximate nature of the exchange-correlation (XC) functional, and a density-driven error
(3)
(3) Here,
indicates the density obtained by variational minimisation of
, as in an ordinary self-consistent DFT calculation, whereas
indicates the exact ground-state density obtained upon minimisation of the exact functional
. For cases where
, the overall error may be reduced by evaluating the approximate functional using an SIE-free density (such as
) rather than a self-consistent one [Citation49,Citation52–55].
With this idea in mind, the DC-DFT energy functional in Equation (Equation1(1)
(1) ) can be written more explicitly as
(4)
(4) This form makes it clear that
must first be obtained from a self-consistent HF calculation, starting from the input density ρ. Following this, the energy is obtained by evaluating the approximate functional
using the density
. A more detailed expression for the same DC-DFT energy is
(5)
(5) where
is the HF total energy functional,
is its exchange component, and
is the XC part of
. The expression in Equation (Equation5
(5)
(5) ) recognises that the functionals
and
differ only in their XC parts, whereas the kinetic energy, Hartree self-repulsion, and nuclear–electron (or ‘external’) potential terms are the same.
The DC-DFT procedure sacrifices self-consistency, which implies that the functional defined in Equations (Equation4(4)
(4) ) and (Equation5
(5)
(5) ) is not variational. This necessitates modification to the analytic gradient [Citation57,Citation59]. Lack of self-consistency also means that DC-DFT is not beneficial in all cases [Citation55,Citation62], but rather only in cases that are dominated by density-driven error. Delocalisation driven by SIE tends to fall into the category of density-driven error, as evident from the fact that DC-DFT based on GGA functionals significantly improves results for radicals [Citation49–51,Citation59] and barrier heights [Citation57–59]. (Transition states are usually characterised by partially-broken bonds and thus fractional charges on different chemical moieties, a classic SIE problem [Citation63,Citation64].)
A ‘density sensitivity’ metric (S) has been suggested to determine whether a given problem is dominated by or
[Citation53–55]. This metric is defined as
(6)
(6) for an approximate functional
, where
is the self-consistent HF density and
is the self-consistent density computed using the local density approximation (LDA). Burke and co-workers [Citation54,Citation55] suggest S>2 kcal/mol as an indicator of cases that are likely to be dominated by density-driven error (or S>8 kJ/mol in the units that will be used herein), although that threshold was calibrated using small molecules. For larger systems with unpaired spins, one can find examples where S ranges from 150–650 kJ/mol across a set of similar chemical systems [Citation59]. This suggests using
(7)
(7) as a metric that is normalised for system size [Citation59].
2.2. Monomer-corrected DFT
In this work, DC-DFT and other models will be used to correct intramolecular conformational energies and then the monomer correction approach [Citation26] is employed to examine the impact of the corrected conformational energies on polymorph stabilities. In this approach, one first performs a periodic DFT calculation on the full crystal, and herein that energy () is computed using the B86bPBE+XDM functional, as in previous work [Citation26,Citation40]. Then, for each of the N molecules in the unit cell, one computes a gas-phase energy difference between the low-level DFT treatment that is used for the periodic calculation (
) and a more advanced level of theory (
), where the ‘high-level’ method could be DC-DFT or else a correlated wave function method. The crystal energy approximated in this way is
(8)
(8) In the present work, the high-level method will be computed with an SIE-free model, whereas B86bPBE+XDM is responsible for modelling the intermolecular interactions. The summation in Equation (Equation8
(8)
(8) ) can usually be simplified by exploiting symmetry equivalences of molecules within the unit cell. The geometries used for the gas-phase molecular corrections are those extracted directly from the crystal structure.
2.3. Computational details
All DC-DFT calculations were performed using the Q-Chem software [Citation65]. For consistency with previous work, DFT-optimised crystal structures for axitinib, ROY, and molecule X, along with their intramolecular conformations, were taken directly from Ref. [Citation26]. B86bPBE+XDM crystal energies and gas-phase monomer calculations for use in Equation (Equation8(8)
(8) ) were also taken from Ref. [Citation26]. All other gas-phase DFT single-point energy calculations were performed using the aug-cc-pVQZ basis set and the SG-2 integration grid [Citation66]. We use the D3 dispersion correction [Citation67] with Becke–Johnson damping, DFT+D3(BJ). Density sensitivities S in Equation (Equation6
(6)
(6) ) were evaluated using the SCAN functional [Citation68] for
, with the aug-cc-pVQZ basis set.
Additional calculations using the spin-component scaled (SCS-)MP2D method [Citation48] are provided for comparison with the DFT results. SCS-MP2D subtracts out the uncoupled HF dispersion [Citation69] from MP2, replacing it with coupled Kohn–Sham dispersion [Citation70], and then the spin components of the MP2 correlation energy are empirically scaled [Citation48]. This approach is inspired by Heßelmann's corrected MP2 (MP2C) model [Citation71], the key difference being that the SCS-MP2D correction is framed in terms of the atom–atom D3 dispersion correction [Citation67], rather than intermolecular perturbation theory response functions. This makes SCS-MP2D applicable to both inter- and intramolecular interactions. SCS-MP2D does not suffer from SIE, and benchmark calculations demonstrate very good performance for challenging conformational energies [Citation48]. SCS-MP2D results reported here were extrapolated to the complete basis set (CBS) limit based on calculations using aug-cc-pVTZ and aug-cc-pVQZ, following the procedure described in Ref. [Citation26].
Relaxed conformational energy scans are examined for several of the molecules in Figure , using geometries taken from the literature [Citation28,Citation38]. For the ROY molecule, the ∠S–C–N–C torsional angle indicated in Figure is used, whereas for rubrene and fluorinated derivatives thereof, the dihedral angle ∠C–C
–C
–C
was used. Single-point potential energy profiles here were then computed at the SCAN+D3, SCAN0+D3, and SCS-MP2D/CBS levels of theory. For ROY, the DFT calculations use the aug-cc-pVQZ basis set as indicated above, although for rubrene and its derivatives, aug-cc-pVTZ is used instead.
These results are compared to benchmarks obtained at the level of coupled-cluster theory with single, double, and perturbative triple excitations [CCSD(T)]. The benchmark results were taken from various sources. For molecule X, ROY, and rubrene, the CCSD(T)/CBS benchmarks were taken from Refs. [Citation26,Citation28,Citation38], respectively. For axitinib, CCSD(T)/CBS results were computed here at the domain-localised pair natural orbital (DLPNO-)CCSD(T) level [Citation72], using Orca v. 5.0 [Citation73]. The latter benchmarks combined MP2/CBS results with a DLPNO-CCSD(T
)/aug-cc-pVDZ correction, obtained using tight PNO settings and with
.
3. Results and discussion
3.1. Density sensitivities
Before analysing energy landscapes for the molecules in Figure , we first scrutinise the degree of density-driven error in these systems, as it has been observed that DC-DFT offers a better solution than conventional (self-consistent) DFT only when the density-driven error is large [Citation49,Citation52–55]. (Systems with significant static correlation also do not benefit from DC-DFT [Citation62], which is consistent with the idea that SIE may sometimes masquerade as strong correlation [Citation74].) We use the metric S in Equation (Equation6(6)
(6) ), evaluated using the SCAN functional, to assess density sensitivity. Based on small-molecule results, S>8 kJ/mol has been suggested as a threshold beyond which DC-DFT is likely to improve the results [Citation54,Citation55].
Table provides values of S for various molecules considered in this work, computed as an average over all conformers since the variations from one conformer to the next are kJ/mol. (Differences in S from one conformer to the next will be considered later.) We obtain values ranging from
kJ/mol although our molecules are considerably larger than the ones used to set 8 kJ/mol as the threshold value. It has also been suggested that S is not a size-extensive metric until the system is large enough for delocalisation to attenuate naturally [Citation59]. (In an infinite conjugated polymer described by a GGA functional, it is not clear that the delocalisation length must ever terminate, as has been demonstrated for excitons described by time-dependent DFT with semilocal functionals [Citation75–77].) For the molecules considered here, the size-normalised metric
[Equation (Equation7
(7)
(7) )] is as large as 7.6 kJ/mol. We will see that all of these molecules are affected by π-delocalisation error, thus the 8 kJ/mol threshold (even if applied to
) does not appear to be a sufficient diagnostic.
3.2. Torsional energy profiles
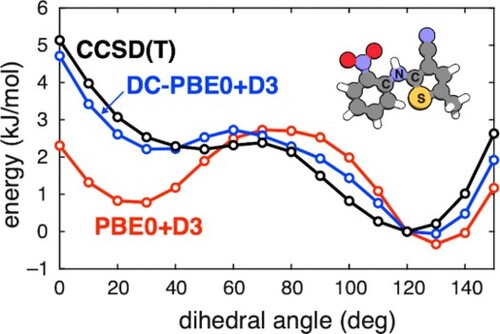
We next consider one-dimensional energy landscapes along some of the torsion angles suggested in Figure . For the ROY molecule, intramolecular conformations found in its crystal polymorphs differ primarily by a single dihedral angle that is indicated in Figure [Citation35,Citation40,Citation78–80]. Dihedral angles between ≈50–130 disrupt the π conjugation between the two aromatic rings, leading to a larger band gap and polymorphs that are yellow in colour (‘Y-’). More planar conformations increase the extent of π delocalisation and shift the colour towards red (polymorphs named ‘R-’) or orange (‘O-’).
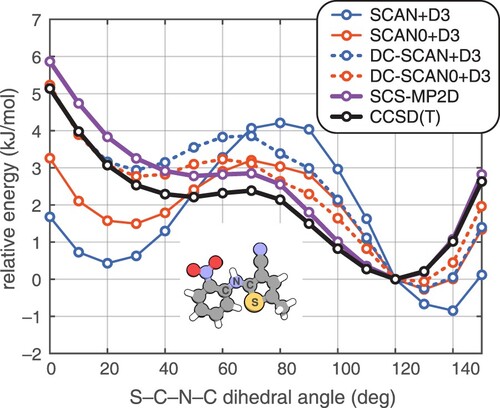
Figure 2. Relaxed potential energy scans for the ROY molecule along the ∠(S–C–N–C) dihedral angle (as indicated in the inset molecular structure), computed using the SCAN+D3 and SCAN0+D3 functionals and their DC-DFT analogues. SCS-MP2D and the CCSD(T) benchmarks are also shown. Energy profiles are computed relative to the structure with a 120 dihedral angle, which is the minimum at the CCSD(T) level.
Previous work has shown that commonly-used GGA and hybrid functionals overstabilise the red and orange polymorphs relative to the yellow ones [Citation26,Citation28,Citation35,Citation39,Citation40,Citation79]. This can be understood as an SIE effect stemming from over-delocalisation of the π electrons in near-planar geometries, where the system is more conjugated. As shown in Figure , both GGAs and hybrid functionals overstabilise the more planar conformations relative to benchmark CCSD(T) calculations. Hybrid functionals reduce the SIE and improve the conformational energy profile, but errors remain significant and are large enough to erroneously alter the polymorph stability rankings [Citation35,Citation39]. Torsional profiles computed using (DC-)B3LYP+D3 and (DC-)PBE0+D3 are shown in Figure S1 and are similar to the (DC-)SCAN0+D3 results in Figure .
Figure plots torsional energy profiles of rubrene and some fluorinated derivatives thereof, along the ∠C –C
–C
–C
angle that is indicated in Figure . (The fluorinated derivatives have been suggested as a means of tuning the non-covalent interactions and therefore the crystal structure [Citation81–83], modulating the band gap [Citation82,Citation83], or to enhance stability with respect to oxidation [Citation84].) We refer to ‘planar’ versus ‘twisted’ configurations in Figure as regards the core tetracene unit. As noted in previous work [Citation38], twist angles
can increase conjugation, bringing the π electrons of the aromatic side chains into play, and common density functionals thus overstabilise twisted orientations relative to planar ones, even while the twisted configuration is more stable according to CCSD(T) calculations [Citation38]. In the case of the SCAN+D3 functional, DC-DFT improves the relative conformational energies of the planar (
) and fully-twisted (
) structures by 2–4 kJ/mol, although the twisted conformation is still somewhat overstabilised even with DC-DFT. This remains the case for the B3LYP+D3 and PBE0+D3 functionals also; see Figure S2. With the SCAN0+D3 functional, DC-DFT improves the relative energies of the fully-twisted structures, and these energies match quite well with the CCSD(T) benchmark for the two out of three derivatives; see Figure (a,b).
Figure 3. Relaxed one-dimensional scans of (a) rubrene, (b) half-fluorinated (F) rubrene, and (c) perfluororubrene, along the dihedral coordinate ∠C
–C
–C
–C
that is suggested in Figure . The (DC-)DFT energies are computed using the aug-cc-pVTZ basis set. SCS-MP2D and CCSD(T) calculations are taken from Ref. [Citation38], and all structures are taken from that work as well.
![Figure 3. Relaxed one-dimensional scans of (a) rubrene, (b) half-fluorinated (F14) rubrene, and (c) perfluororubrene, along the dihedral coordinate ∠C1–C2–C3–C4 that is suggested in Figure 1. The (DC-)DFT energies are computed using the aug-cc-pVTZ basis set. SCS-MP2D and CCSD(T) calculations are taken from Ref. [Citation38], and all structures are taken from that work as well.](/cms/asset/1c668f17-0c9d-4ab6-ab50-52eb781c4978/tmph_a_2138789_f0003_oc.jpg)
3.3. Relative conformer and polymorph energies
The remainder of this work focuses on relative energies of ROY, molecule X, and axitinib, both as isolated molecules (considering the conformations found in the relevant crystal polymorphs) and in the crystalline phase, where the lattice energies are estimated using the monomer-correction scheme in Equation (Equation8(8)
(8) ).
The energy ordering of some ROY conformers is shown in Figure (a), as computed using various density functionals (both self-consistent and DC-DFT) as well as SCS-MP2D and CCSD(T). According to CCSD(T) calculations [Citation26], the correct gas-phase conformational energy ordering is
(9)
(9) R05a and R05b refer to the two symmetry-unique molecular conformations found in the R05 polymorph. In the self-consistent DFT calculations, shown in the left panel of Figure (a), all of the dispersion-corrected GGA and meta-GGA functionals perform very poorly, overstabilising the red and orange conformers over the yellow ones by several kJ/mol. This can be understood as an SIE artifact, as discussed above. PBE+D3 shows the worst performance, completely reversing the energetic ordering relative to CCSD(T). Hybrid functionals partially mitigate the effect of SIE and behave better than the GGA functionals. The hybrid meta-GGA functional SCAN0+D3 emerges as the best performer amongst the set of functionals tested here, although it still does not reproduce the CCSD(T) energy ordering.
Figure 4. Energetic ordering of conformers of ROY (Figure ), computed using both self-consistent DFT and DC-DFT for the same set of functionals: (a) isolated monomer energies, and (b) crystal polymorph energies, with the latter computed using the monomer-correction scheme of Equation (Equation8(8)
(8) ). Energies are plotted relative to that of the Y conformer.
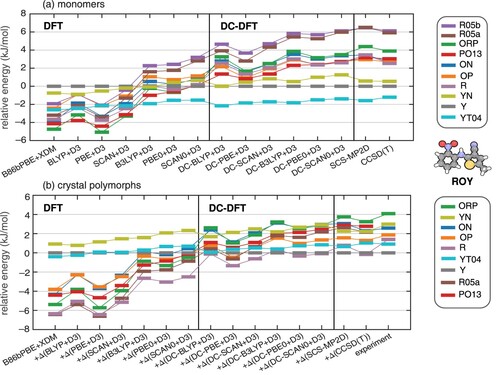
DC-DFT results for ROY are shown in the middle section of Figure , for the same set of functionals. The DC procedure improves upon the self-consistent DFT results in all cases, coming much closer to the correct energetic ordering except in a few quasi-degenerate cases. This validates the hypothesis that π-delocalisation error drives the erratic and mostly erroneous results obtained using conventional DFT. Lowest- and highest-energy conformers are correctly predicted by DC-DFT for all functionals tested here, and the three lowest-energy conformers are correctly predicted by all of the DC-DFT methods except for DC-PBE+D3. Failure of the latter approach may be a sign of larger functional-driven error as compared to the hybrid functionals or the SCAN meta-GGA functional. Even for PBE+D3, however, the DC procedure moves the results closer to the correct energetic ordering as compared to the corresponding self-consistent DFT calculation. The DC-SCAN0+D3 and DC-PBE0+D3 methods afford correct energetic ordering for most of the conformers, as judged by comparison to CCSD(T) benchmarks. The success of DC-SCAN and DC-SCAN0 has been noted in unrelated work [Citation85].
Having identified SCAN+D3 and SCAN0+D3 as the best of the self-consistent DFT approaches for the ROY molecule, let us return to the one-dimensional potential energy scans in Figure . Both DC-SCAN+D3 and DC-SCAN0+D3 perform well in comparison to benchmark CCSD(T) calculations from Ref. [Citation26], although neither is quite as faithful to the benchmark as is SCS-MP2D. In contrast, the self-consistent SCAN+D3 and SCAN0+D3 calculations yield erroneously large rotational barriers around 40–90, as structures with angles of 0–30
are overstabilised due to SIE. Torsional energy profiles computed using (DC-)B3LYP+D3 and (DC-)PBE0+D3 are shown in Figure S1 and exhibit most of the same trends that are seen for the hybrid (DC-)SCAN0+D3 level of theory in Figure . Thus, the good performance of DC-SCAN+D3 and DC-SCAN0+D3 is not simply a matter of choosing a good functional to correct; the correction itself improves the results substantially.
Density sensitivities for ROY conformers are plotted in Figure (a), computed using SCAN for the approximate functional in Equation (Equation6
(6)
(6) ). Yellow conformers (indicated by names starting with Y) exhibit smaller values of S as compared to the other conformers, by
kJ/mol, a significant amount given the rather small energy differences between the various conformers. Larger SIE in near-planar geometries associated with the orange and red conformers explains the larger values of S in those cases. Application of DC-DFT thus selectively modifies the energy landscape of the conformers with the largest density sensitivity, meaning red and orange more so than yellow in this case. The result is a potential energy surface that pushes the energetic ordering in the right direction.
Figure 5. Density sensitivities [Equation (Equation6(6)
(6) )] for different conformers of (a) ROY, (b) molecule X, and (c) axitinib, computed using SCAN/aug-cc-pVQZ for the approximate functional
.
![Figure 5. Density sensitivities [Equation (Equation6(6) S=|E~[ρLDA]−E~[ρHF]|(6) )] for different conformers of (a) ROY, (b) molecule X, and (c) axitinib, computed using SCAN/aug-cc-pVQZ for the approximate functional E~[ρ].](/cms/asset/08bb3d23-75d4-41c6-a414-23bcfce4348d/tmph_a_2138789_f0005_oc.jpg)
Up to this point, we have discussed the behaviour of an isolated molecule of ROY. Figure (b) reports the relative energies of the crystal polymorphs, computed using the monomer-correction scheme in Equation (Equation8(8)
(8) ). As reported previously [Citation26], the B86bPBE+XDM functional yields extremely poor relative energies for the form Y, predicting it to be the second-least stable polymorph when in fact it is the thermodynamically most stable form. The relative order of the other lattice energies is also poor at this level of theory, relative to experimental lattice enthalpies or CCSD(T) lattice energies. Furthermore, replacing B86bPBE+XDM with another self-consistent GGA or hybrid functional does not meaningfully improve the energy rankings. In contrast, the DC-DFT models all perform much better. The close energy spacings of the ROY polymorphs make this a challenging problem for any method, but SCS-MP2D and DC-DFT with hybrid functionals all give fairly consistent qualitative rankings, even if the quantitative lattice energies differ.
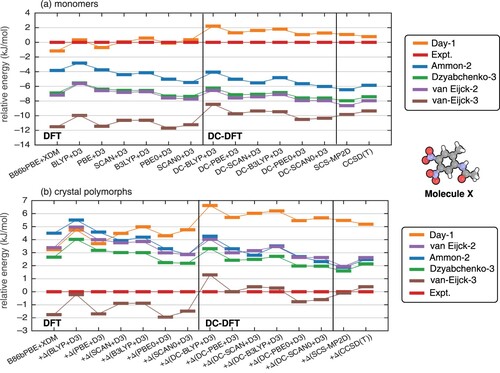
We next perform a similar analysis for molecule X. The relevant conformers involve rotation of the bonds indicated with arrows in Figure and alter the extent of π conjugation with the central aromatic ring. According to CCSD(T) calculations [Citation26], the gas-phase energetic ordering of the various conformers is
(10)
(10) The nomenclature in Equation (Equation10
(10)
(10) ) reflects structures submitted by different groups in the third blind test of crystal structure prediction [Citation42], with ‘Expt.’ indicating the conformer in the experimental crystal structure. DFT calculations were previously found to reverse the order of the experimental conformer with that of conformer Day-1, and furthermore to overstabilise the van Eijck-3 conformer by about 2 kJ/mol [Citation26].
DFT and DC-DFT results for molecule X in the gas phase are shown in Figure (a). Similar to trends observed previously [Citation26,Citation41], each of the GGA and meta-GGA functionals that we consider overestimates the stability of the van Eijck-3 conformer relative to the experimental one. Of the conventional (self-consistent) DFT approaches, only BLYP+D3, B3LYP+D3, and SCAN0+D3 predict qualitatively correct relative energies for the closely-spaced experimental and the Day-1 conformers, which are the least-stable conformers in isolation. On the other hand, all of the DC-DFT methods examined here place those two conformers in the correct energetic order. The DC procedure also reduces the overstabilisation of conformer van Eijck-3, relative to the self-consistent DFT results.
Figure 6. Energetic ordering of conformers of molecule X (Figure ), computed using both self-consistent DFT and DC-DFT for the same set of functionals: (a) isolated monomer energies, and (b) crystal polymorph energies, with the latter computed using the monomer-correction scheme of Equation (Equation8(8)
(8) ). Energies are plotted relative to ‘Expt.’, which is the conformer found in the experimental crystal structure.
Density sensitivities for conformers of molecule X are plotted in Figure (b). We mainly focus on the Day-1 conformer and the experimental one since these are the relative energies that are most susceptible to switching order as one functional is swapped for another. The value of S for the Day-1 conformer is 1.7 kJ/mol larger than the value obtained for the experimental conformer, which is perhaps significant in view of the fact that these two conformers differ only by about 1 kJ/mol, according to DLPNO-CCSD(T) calculations [Citation26]. The large sensitivity for the Day-1 conformer is consistent with its overstabilisation (relative to the experimental conformer) by functionals such as PBE and PBE0. Overstabilisation of the van Eijck-3 conformer with conventional DFT can also be explained by the larger S associated with that conformer.
Relative polymorph energies for molecule X are given in Figure (b). Once again, the predicted lattice energies improve significantly when DC-DFT is used instead of self-consistent DFT. At the same time, some of the energy orderings remain sensitive to the choice of functional, even when DC-DFT is used. This largely reflects the difficulty of the problem, with relative energy changes of ∼1 kJ/mol being enough to affect the ordering. In this particular example, DC-SCAN+D3 (based on semilocal SCAN rather than the hybrid SCAN0) best reproduces the CCSD(T) benchmarks.
We next discuss results for the anti-cancer drug axitinib. This drug has five known conformational polymorphs that are denoted I, IV, VI, XXV, and XLI, and many more multi-component crystal forms [Citation86,Citation87]. In most polymorphs, the axitinib molecule adopts an extended conformation but in the thermodynamically most stable XLI form, however, rotation about the sulphur group leads to a more folded conformation. In the process, the π conjugation between the aromatic ring and the terminal amide moiety is disrupted; see Figure . This causes the XLI form to be artificially destabilised by GGA functionals, leading to erroneous polymorph energy rankings [Citation26].
Relative energies of axitinib conformers are shown in Figure . New DLPNO-CCSD(T)/CBS calculations performed here afford the following energetic ordering for the isolated monomer:
(11)
(11) None of the self-consistent functionals reproduces this ordering, and many of the functionals (with notable exceptions BLYP+D3 and B3LYP+D3) significantly destabilise form XLI, which is the conformer that appears in the lowest-energy crystal polymorph. DC-DFT generally shifts the conformational energies in the correct direction by stabilising XLI relative to the other conformers. However, the extent to which this is true varies by several kJ/mol depending upon the choice of functional, and for the BLYP+D3 and B3LYP+D3 functionals that perform reasonably well in conventional self-consistent calculations, the errors increase when DC-DFT is used. Other functionals do improve when DC-DFT replaces a self-consistent calculation, and the best-performing DFT approach is DC-PBE+D3, with root-mean-square (RMS) error of 0.9 kJ/mol with respect to the CCSD(T) benchmarks. However, SCS-MP2D does slightly better, with a RMS error of 0.5 kJ/mol.
Figure 7. Energetic ordering of conformers of axitinib (Figure ), computed using both self-consistent DFT and DC-DFT for the same set of functionals: (a) isolated monomer energies, and (b) crystal polymorph energies, with the latter computed using the monomer-correction scheme of Equation (Equation8(8)
(8) ). Energies are plotted relative to that of the XLI conformer.
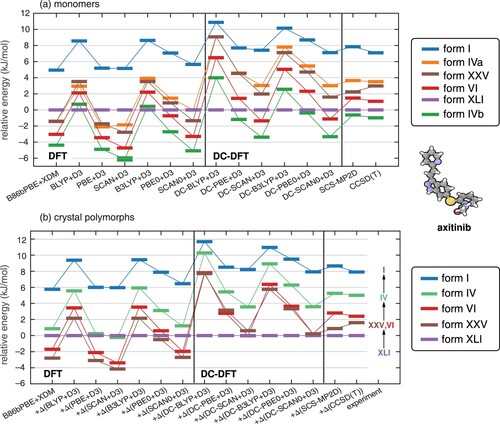
Relative energies of the axitinib crystal polymorphs are shown in Figure (b) and the various DC-DFT approaches perform similarly except that the energy gap between the lowest-energy polymorph (XLI in all cases) and the others varies by up to 8 kJ/mol depending on the choice of functional. The ordering of the (near-degenerate) polymorphs VI and XXV is uncertain in the DC-DFT calculations, but that is true experimentally as well [Citation88]. Otherwise, DC-DFT consistently predicts the correct energetic ordering of the polymorphs, for all functionals tested, although the energies are spread out over too large a range in some cases, by up to 4 kJ/mol.
The relatively poor performance of DC-DFT for axitinib, as compared to ROY or molecule X, is a bit puzzling given that is smallest for axitinib. That observation, combined with the fact that self-consistent BLYP+D3 and B3LYP+D3 calculations perform well for axitinib, suggests that functional-driven error may exceed density-driven error for this molecule. Given the nature of the conformers that are considered here, the π-delocalisation issues are largely confined to one end of this molecule, and the considerably larger size of axitinib (relative to either ROY or molecule X) may wash out the advantages of DC-DFT in this case. It is possible that a fragmentation approach [Citation89], with DC-DFT applied only to the part of the molecule that is subject to significant delocalisation problems, could improve the situation, but we have not pursued such an approach here. In any case, results for axitinib highlight how density-driven error is only one factor that affects conformational energies in large, conjugated organic molecules, and cautions against assuming that DC-DFT is a panacea for such problems.
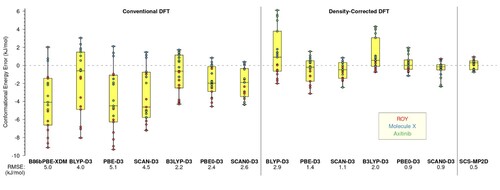
Stepping back from the finer details of each system, Figure plots errors in conformational energies for all three molecules (ROY, molecule X, and axitinib), relative to CCSD(T) benchmarks, indicating the RMS error for each DFT approach and for SCS-MP2D. (The RMS errors are also summarised in Figure S3.) Relative to self-consistent DFT, the DC-DFT approach generally reduces the width of the error distributions by up to a factor of 3–4, and DC-hybrid functionals afford the tightest error distributions. At the same time, even the best of the DC-DFT models affords errors that are about twice as large as those obtained using SCS-MP2D. Taken together, these results highlight how DC-DFT can provide a useful, pragmatic approach for improving the quality of common DFT functionals in challenging systems with density-driven delocalisation error, but also suggest that higher-level method may still be preferred for high-accuracy work.
Figure 8. Summary of conformational energy errors (in kJ/mol) for isolated molecules ROY, molecule X, and axitinib, relative to CCSD(T) benchmarks. The box-and-whisker plots summarise quartiles of the error distributions, while the points show the errors for individual conformational energies.
4. Conclusion
We have used the DC-DFT technique to study the energy landscape of several conjugated organic molecules, as well as their relative polymorph energies in the crystalline phase. These are challenging problems due to the appearance of multiple low-energy conformers (and corresponding low-energy polymorphs), and self-consistent DFT calculations with standard semilocal and hybrid functionals fail to reproduce benchmark ab initio results. We attribute this to SIE, in the particular form of π-delocalisation error as the degree of conjugation is tuned by means of various intramolecular torsion angles. Application of DC-DFT, using the same common functionals, significantly mitigates the errors in most cases and usually results in correct energetic ordering of crystal polymorphs, when computed by means of a monomer-correction scheme [Citation26] applied to a periodic DFT calculation.
The DC-SCAN+D3 and DC-SCAN0+D3 methods work reasonably well for conformers and polymorphs of the benchmark ROY and molecule X systems, although the larger molecule axitinib proves to be more difficult. For axitinib, most (but not all) of the DC-DFT approaches improve upon their conventional self-consistent analogues, but none of the DFT methods produces fully satisfactory agreement with CCSD(T) benchmarks. We speculate that the relevant π-delocalisation error in this case may be isolated within a particular aromatic moiety, and that DC-DFT applied to the entire (much larger) molecule may upset the balance of reasons why particular functionals perform well for the parts of the molecule that do not suffer from over-delocalisation of π electrons. A fragmentation strategy might help, with DC-DFT applied only to part of the molecule, but in any case this system highlights potential difficulties in applying DC-DFT to systems where SIE problems are confined to a relatively small portion of a much larger molecule. Overall, our results underscore previous work [Citation26,Citation40] indicating that monomer-corrected periodic GGA calculations, with an appropriately selected level of theory for the monomer corrections, is an effective and low-cost strategy for polymorphic molecular crystals.
Acknowledgments
The authors express condolences for the family of Prof. Nick Besley, who was a valued member of the Q-Chem community.
Disclosure statement
J.M.H. serves on the board of directors of Q-Chem Inc.
Additional information
Funding
References
- D. Braga, F. Grepioni, L. Maini and M. Polito, in Molecular Networks, edited by M.W. Hosseini, Structure and Bonding, Vol. 132 (Springer-Verlag, Berlin, 2009), pp. 25–50.
- A.J. Cruz-Cabeza and J. Bernstein, Chem. Rev. 114, 2170–2191 (2014). doi:10.1021/cr400249d
- Y. Zhou, J. Wang, Y. Xiao, T. Wang and X. Huang, Curr. Pharm. Design 24, 2375–2382 (2018). doi:10.2174/1381612824666180515155425
- A.J. Cruz-Cabeza, S.M. Reutzel-Edens and J. Bernstein, Chem. Soc. Rev. 44, 8619–8635 (2015). doi:10.1039/C5CS00227C
- J. Nyman and S.M. Reutzel-Edens, Faraday Discuss. 211, 459–476 (2018). doi:10.1039/C8FD00033F
- J. Bauer, S. Spanton, R. Henry, J. Quick, W. Dziki, W. Porter and J. Morris, Pharm. Res. 18, 859–866 (2001). doi:10.1023/A:1011052932607
- I.B. Rietveld and R. Ceolin, J. Pharm. Sci. 104, 4117–4122 (2015). doi:10.1002/jps.24626
- J.D. Dunitz and J. Bernstein, Acc. Chem. Res. 28, 193–200 (1995). doi:10.1021/ar00052a005
- D. Bučar, R.W. Lancaster and J. Bernstein, Angew. Chem. Int. Ed. Engl. 54, 6972–6993 (2015). doi:10.1002/anie.201410356
- M.A. Neumann and J. van de Streek, Faraday Discuss. 211, 441–458 (2018). doi:10.1039/C8FD00069G
- J. Maddox, Nature 335, 201 (1988). doi:10.1038/335201a0
- A. Gavezzotti, Acc. Chem. Res. 27, 309–314 (1994). doi:10.1021/ar00046a004
- G.M. Day, T.G. Cooper, A.J. Cruz-Cabeza, K.E. Hejczyk, H.L. Ammon, S.X.M. Boerrigter, J.S. Tan, R.G. Della Valle, E. Venuti, J. Jose, S.R. Gadre, G.R. Desiraju, T.S. Thakur, B.P. van Eijck, J.C. Facelli, V.E. Bazterra, M.B. Ferraro, D.W.M. Hoffman, M.A. Neumann, F.J.J. Leusen, J. Kendrick, S.L. Price, A.J. Misquitta, P.G. Karamertzanis, G.W.A. Welch, H.A. Scheraga, Y.A. Arnautova, M.U. Schmidt, J. van de Streek, A.K. Wolf and B. Schweizer, Acta Cryst. B 65, 107–125 (2009). doi:10.1107/S0108768109004066
- D.A. Bardwell, C.S. Adjiman, Y.A. Arnautova, E. Bartashevich, S.X.M. Boerrigter, D.E. Braun, A.J. Cruz-Cabeza, G.M. Day, R.G. Della Valle, G.R. Desiraju, B.P. van Eijck, J.C. Facelli, M.B. Ferraro, D. Grillo, M. Habgood, D.W.M. Hofmann, F. Hofmann, K.V.J. Jose, P.G. Karamertzanis, A.V. Kazantsev, J. Kendrick, L.N. Kuleshova, F.J.J. Leusen, A.V. Maleev, A.J. Misquitta, S. Mohamed, R.J. Needs, M.A. Neumann, D. Nikylov, A.M. Orendt, R. Pal, C.C. Pantelides, C.J. Pickard, L.S. Price, S.L. Price, H.A. Scheraga, J. van de Streek, T.S. Thakur, S. Tiwari, E. Venuti and I.K. Zhitkov, Acta Cryst. B67, 535–551 (2011). doi:10.1107/S0108768111042868
- A.M. Reilly, R.I. Cooper, C.S. Adjiman, S. Bhattacharya, A.D. Boese, J.G. Brandenburg, P.J. Bygrave, R. Bylsma, J.E. Campbell, R. Car, D.H. Case, R. Chadha, J.C. Cole, K. Cosburn, H.M. Cuppen, F. Curtis, G.M. Day, R.A. DiStasio Jr., A. Dzyabchenko, B.P. van Eijck, D.M. Elking, J.A. van den Ende, J.C. Facelli, M.B. Ferraro, L. Fusti-Molnar, C.-A. Gatsiou, T.S. Gee, R. de Gelder, L.M. Ghiringhelli, H. Goto, S. Grimme, R. Guo, D.W.M. Hofmann, J. Hoja, R.K. Hylton, L. Iuzzolino, W. Jankiewicz, D.T. de Jong, J. Kendrick, N.J.J. de Klerk, H.-Y. Ko, L.N. Kuleshova, X. Li, S. Lohani, F.J.J. Leusen, A.M. Lund, J. Lv, Y. Ma, N. Marom, A.E. Masunov, P. McCabe, D.P. McMahon, H. Meekes, M.P. Metz, A.J. Misquitta, S. Mohamed, B. Monserrat, R.J. Needs, M.A. Neumann, J. Nyman, S. Obata, H. Oberhofer, A.R. Oganov, A.M. Orendt, G.I. Pagola, C.C. Pantelides, C.J. Pickard, R. Podeszwa, L.S. Price, S.L. Price, A. Pulido, M.G. Read, K. Reuter, E. Schneider, C. Schober, G.P. Shields, P. Singh, I.J. Sugden, K. Szalewicz, C.R. Taylor, A. Tkatchenko, M.E. Tuckerman, F. Vaccaro, M. Vasileiadis, A. Vazquez-Mayagoitia, L. Vogt, Y. Wang, R.E. Watson, G.A. de Wiijs, J. Yang, Q. Zhu and C.R. Groom, Acta Cryst. B 72, 439–459 (2016). doi:10.1107/S2052520616007447
- A. Otero-de-la-Roza, B.H. Cao, I.K. Price, J.E. Hein and E.R. Johnson, Angew. Chem. Int. Ed. Engl.53, 7879–7882 (2014). doi:10.1002/anie.201403541
- G.J.O. Beran, Angew. Chem. Int. Ed. Engl. 54, 396–398 (2015).doi:10.1002/anie.201409823
- G.J.O. Beran, Chem. Rev. 116, 5567–5613 (2016). doi:10.1021/acs.chemrev.5b00648
- E. Zurek, in Reviews in Computational Chemistry, edited by A.L. Parrill and K. B. Lipkowitz (Wiley-VCH, Hoboken, NJ, 2016), Vol. 29, pp. 274–326.
- S.L. Price and J.G. Brandenburg, in Non-Covalent Interactions in Quantum Chemistry and Physics, edited by A.O. de la Roza and G.A. DiLabio (Elsevier, Amsterdam, 2017), Chap. 11, pp. 333–363.
- A. Pulido, L. Chen, T. Kaczorowski, D. Holden, M.A. Little, S.Y. Chong, B.J. Slater, D.P. McMahon, B. Bonillo, C.J. Stackhouse, A. Stephenson, C.M. Kane, R. Clowes, T. Hasell, A.I. Cooper and G.M. Day, Nature 543, 657–664 (2017). doi:10.1038/nature21419
- J. Hoja, H.-Y. Ko, M.A. Neumann, R. Car, R.A. DiStasio, Jr. and A. Tkatchenko, Sci. Adv. 5, eaau3338:1–eaau3338:10 (2019). doi:10.1126/sciadv.aau3338
- G. Sun, X. Liu, Y.A. Abramov, S.O.N. Lill, C. Chang, V. Burger and A. Broo, Crys. Growth Des. 21, 1972–1983 (2021). doi:10.1021/acs.cgd.0c01266.
- Y.N. Heit, K.D. Nanda and G.J.O. Beran, Chem. Sci. 7, 246–255 (2016). doi:10.1039/C5SC03014E
- C. Cervinka and G.J.O. Beran, Chem. Sci. 9, 4622–4629 (2018). doi:10.1039/C8SC01237G
- C. Greenwell and G.J.O. Beran, Crys. Growth Des. 20, 4875–4881 (2020). doi:10.1021/acs.cgd.0c00676
- J. Nyman and G.M. Day, CrystEngComm 17, 5154–5165 (2015). doi:10.1039/C5CE00045A
- C. Greenwell, J.L. McKinley, P. Zhang, Q. Zeng, G. Sun, B. Li, S. Wen and G.J.O. Beran, Chem. Sci.11, 2200–2214 (2020). doi:10.1039/C9SC05689K
- P.G. Karamertzanis, G.M. Day, G.W.A. Welch, J. Kendrick, F.J.J. Leusen, M.A. Neumann and S.L. Price, J. Chem. Phys. 128, 244708:1–244708:17 (2008). doi:10.1063/1.2937446
- M.A. Neumann, F.J.J. Leusen and J. Kendrick, Angew. Chem. Int. Ed. Engl. 120, 2461–2464 (2008). doi:10.1002/(ISSN)1521-3757
- J. Kendrick, M.D. Gourlay, M.A. Neumann and F.J.J. Leusen, CrystEngComm 11, 2391–2399 (2009). doi:10.1039/b909038j
- A.M. Reilly and A. Tkatchenko, Phys. Rev. Lett. 113, 055701:1–055701:5 (2014). doi:10.1103/PhysRevLett.113.055701
- F. Curtis, X. Li, T. Rose, A. Vásquez-Mayagoitia, S. Bhattaccharya, L.M. Ghiringhelli and N. Marom, J. Chem. Theory Comput. 14, 2246–2264 (2018). doi:10.1021/acs.jctc.7b01152
- I. Bier, D. O'Connor, Y.-T. Hsieh, W. Wen, A.M. Hiszpanski, T.Y.-J. Han and N. Marom, CrystEngComm 23, 6023–6038 (2021). doi:10.1039/D1CE00745A
- J. Nyman, L. Yu and S.M. Reutzel-Edens, CrystEngComm 21, 2080–2088 (2019). doi:10.1039/C8CE01902A
- G.J.O. Beran, S.E. Wright, C. Greenwell and A.J. Cruz-Cabeza, J. Chem. Phys. 156, 104112:1–104112:16 (2022). doi:10.1063/5.0088027
- A.J. Cohen, P. Mori-Sanchez and W. Yang, Chem. Rev. 112, 289–320 (2012). doi:10.1021/cr200107z
- C. Greenwell and G.J.O. Beran, J. Mater. Chem. C 9, 2848–2857 (2021). doi:10.1039/D0TC05463A
- M. Tan, A.G. Shtukenberg, S. Zhu, W. Xu, E. Dooryhee, S.M. Nichols, M.D. Ward, B. Kahr and Q. Zhu, Faraday Discuss. 211, 477–491 (2018). doi:10.1039/C8FD00039E
- G.J.O. Beran, I.J. Sugden, C. Greenwell, D.H. Bowskill, C.C. Pantelides and C.S. Adjiman, Chem. Sci. 13, 1288–1297 (2022). doi:10.1039/D1SC06074K
- S.R. Whittleton, A. Otero-de-la-Roza and E.R. Johnson, J. Chem. Theory Comput. 13, 5332–5342 (2017). doi:10.1021/acs.jctc.7b00715
- G.M. Day, W.D.S. Motherwell, H.L. Ammon, S.X.M. Boerrigter, R.G. Della Valle, E. Venuti, A. Dzyabchenko, J.D. Dunitz, B. Scweizer, B.P. avn Eijck, P. Erk, J.C. Facelli, V.E. Bazterra, M.B. Ferraro, D.W.M. Hofmann, F.J.J. Leusen, C. Liang, C.C. Pantelides, P.G. Karamertzanis, S.L. Price, T.C. Lewis, H. Nowell, A. Torrisi, H.A. Scheraga, Y.A. Arnautova, M.U. Schmidt and P. Verwer, Acta Cryst. B 61, 511–527 (2005). doi:10.1107/S0108768105016563
- T.J. Gately, W. Sontising, C.J. Easley, I. Islam, R.O. Al-Kaysi, G.J.O. Beran and C.J. Bardeen, CrystEngComm 23, 5931–5943 (2021). doi:10.1039/D1CE00846C
- A.D. Becke, J. Chem. Phys. 85, 7184–7187 (1986). doi:10.1063/1.451353
- J.P. Perdew, K. Burke and M. Ernzerhof, Phys. Rev. Lett. 77, 3865–3868 (1996). doi:10.1103/PhysRevLett.77.3865; Erratum: ibid. 78, 1396 (1997).
- A. Otero-de-la-Roza and E.R. Johnson, J. Chem. Phys. 136, 174109:1–174109:8 (2012). doi:10.1063/1.4705760
- J. Řezác, C. Greenwell and G.J.O. Beran, J. Chem. Theory Comput. 14, 4711–4721 (2018). doi:10.1021/acs.jctc.8b00548
- C. Greenwell, J. Řezáč and G.J.O. Beran, Phys. Chem. Chem. Phys. 24, 3695–3712 (2021). doi:10.1039/D1CP04922D
- M.-C. Kim, E. Sim and K. Burke, Phys. Rev. Lett. 111, 073003:1–073003:5 (2013).doi:10.1103/PhysRevLett.111.073003
- M.-C. Kim, E. Sim and K. Burke, J. Chem. Phys. 140, 18A528:1–18A528:10 (2014).doi:10.1063/1.4869189
- M.-C. Kim, H. Park, S. Son, E. Sim and K. Burke, J. Phys. Chem. Lett. 6, 3802–3807 (2015). doi:10.1021/acs.jpclett.5b01724
- S. Vuckovic, S. Song, J. Kozlowski, E. Sim and K. Burke, J. Chem. Theory Comput. 15, 6336–6346 (2019).doi:10.1021/acs.jctc.9b00826
- E. Sim, S. Song and K. Burke, J. Phys. Chem. Lett. 9, 6385–6392 (2018). doi:10.1021/acs.jpclett.8b02855
- S. Song, S. Vuckovic, E. Sim and K. Burke, J. Phys. Chem. Lett. 12, 800–807 (2021). doi:10.1021/acs.jpclett.0c03545
- S. Song, S. Vuckovic, E. Sim and K. Burke, J. Chem. Theory Comput. 18, 817–827 (2022). doi:10.1021/acs.jctc.1c01045
- N. Oliphant and R. Bartlett, J. Chem. Phys. 100, 6550–6561 (1994). doi:10.1063/1.467064
- P. Verma, A. Perera and R.J. Bartlett, Chem. Phys. Lett. 524, 10–15 (2012). doi:10.1016/j.cplett.2011.12.017
- B.G. Janesko and G.E. Scuseria, J. Chem. Phys. 128, 244112:1–244112:4 (2008).doi:10.1063/1.2940738
- B. Rana, M.P. Coons and J.M. Herbert, J. Phys. Chem. Lett. 13, 5275–5284 (2022). doi:10.1021/acs.jpclett.2c01187
- S. Nam, E. Cho, E. Sim and K. Burke, J. Phys. Chem. Lett. 12, 2796–2804 (2021). doi:10.1021/acs.jpclett.1c00426
- Y. Kim, S. Song, E. Sim and K. Burke, J. Phys. Chem. Lett. 10, 295–301 (2019). doi:10.1021/acs.jpclett.8b03745; Erratum: ibid. 11, 8041 (2020).
- G. Santra and J.M.L. Martin, J. Chem. Theory Comput. 17, 1368–1379 (2021). doi:10.1021/acs.jctc.0c01055
- Y. Zhang and W. Yang, J. Chem. Phys. 109, 2604–2608 (1998). doi:10.1063/1.476859
- A. Ruzsinszky, J.P. Perdew, G.I. Csonka, O.A. Vydrov and G.E. Scuseria, J. Chem. Phys. 125, 194112:1–194112:8 (2006). doi:10.1063/1.2387954
- E. Epifanovsky, A.T.B. Gilbert, X. Feng, J. Lee, Y. Mao, N. Mardirossian, P. Pokhilko, A.F. White, M.P. Coons, A.L. Dempwolff, Z. Gan, D. Hait, P.R. Horn, L.D. Jacobson, I. Kaliman, J. Kussmann, A.W. Lange, K.U. Lao, D.S. Levine, J. Liu, S.C. McKenzie, A.F. Morrison, K.D. Nanda, F. Plasser, D.R. Rehn, M.L. Vidal, Z.-Q. You, Y. Zhu, B. Alam, B.J. Albrecht, A. Aldossary, E. Alguire, J.H. Andersen, V. Athavale, D. Barton, K. Begam, A. Behn, N. Bellonzi, Y.A. Bernard, E.J. Berquist, H.G.A. Burton, A. Carreras, K. Carter-Fenk, R. Chakraborty, A.D. Chien, K.D. Closser, V. Cofer-Shabica, S. Dasgupta, M. de Wergifosse, J. Deng, M. Diedenhofen, H. Do, S. Ehlert, P.-T. Fang, S. Fatehi, Q. Feng, T. Friedhoff, J. Gayvert, Q. Ge, G. Gidofalvi, M. Goldey, J. Gomes, C.E. González-Espinoza, S. Gulania, A.O. Gunina, M.W.D. Hanson-Heine, P.H.P. Harbach, A. Hauser, M.F. Herbst, M. Hernández Vera, M. Hodecker, Z.C. Holden, S. Houck, X. Huang, K. Hui, B.C. Huynh, M. Ivanov, A. Jász, H. Ji, H. Jiang, B. Kaduk, S. Kähler, K. Khistyaev, J. Kim, G. Kis, P. Klunzinger, Z. Koczor-Benda, J.H. Koh, D. Kosenkov, L. Koulias, T. Kowalczyk, C.M. Krauter, K. Kue, A. Kunitsa, T. Kus, I. Ladjánszki, A. Landau, K.V. Lawler, D. Lefrancois, S. Lehtola, R.R. Li, Y.-P. Li, J. Liang, M. Liebenthal, H.-H. Lin, Y.-S. Lin, F. Liu, K.-Y. Liu, M. Loipersberger, A. Luenser, A. Manjanath, P. Manohar, E. Mansoor, S.F. Manzer, S.-P. Mao, A.V. Marenich, T. Markovich, S. Mason, S.A. Maurer, P.F. McLaughlin, M.F.S. J. Menger, J.-M. Mewes, S.A. Mewes, P. Morgante, J.W. Mullinax, K.J. Oosterbaan, G. Paran, A.C. Paul, S.K. Paul, F. Pavošević, Z. Pei, S. Prager, E.I. Proynov, A. Rák, E. Ramos-Cordoba, B. Rana, A.E. Rask, A. Rettig, R.M. Richard, F. Rob, E. Rossomme, T. Scheele, M. Scheurer, M. Schneider, N. Sergueev, S.M. Sharada, W. Skomorowski, D.W. Small, C.J. Stein, Y.-C. Su, E.J. Sundstrom, Z. Tao, J. Thirman, G.J. Tornai, T. Tsuchimochi, N.M. Tubman, S.P. Veccham, O. Vydrov, J. Wenzel, J. Witte, A. Yamada, K. Yao, S. Yeganeh, S.R. Yost, A. Zech, I.Y. Zhang, X. Zhang, Y. Zhang, D. Zuev, A. Aspuru-Guzik, A.T. Bell, N.A. Besley, K.B. Bravaya, B.R. Brooks, D. Casanova, J.-D. Chai, S. Coriani, C.J. Cramer, G. Cserey, A.E. DePrince III, R.A. DiStasio Jr., A. Dreuw, B.D. Dunietz, T.R. Furlani, W.A. Goddard III, S. Hammes-Schiffer, T. Head-Gordon, W.J. Hehre, C.-P. Hsu, T.-C. Jagau, Y. Jung, A. Klamt, J. Kong, D.S. Lambrecht, W. Liang, N.J. Mayhall, C.W. McCurdy, J.B. Neaton, C. Ochsenfeld, J.A. Parkhill, R. Peverati, V.A. Rassolov, Y. Shao, L.V. Slipchenko, T. Stauch, R.P. Steele, J.E. Subotnik, A.J.W. Thom, A. Tkatchenko, D.G. Truhlar, T. Van Voorhis, T.A. Wesolowski, K.B. Whaley, H.L. Woodcock III, P.M. Zimmerman, S. Faraji, P.M.W. Gill, M. Head-Gordon, J.M. Herbert and A.I. Krylov, J. Chem. Phys. 155, 084801:1–084801:59 (2021). doi:10.1063/5.0055522
- S. Dasgupta and J.M. Herbert, J. Comput. Chem. 38, 869–882 (2017). doi:10.1002/jcc.v38.12
- S. Grimme, J. Antony, S. Ehrlich and H. Krieg, J. Chem. Phys. 132, 154104:1–154104:19 (2010). doi:10.1063/1.3382344
- J. Sun, A. Ruzsinszky and J.P. Perdew, Phys. Rev. Lett. 115, 036402:1–036402:6 (2015).doi:10.1103/PhysRevLett.115.036402
- A. Szabo and N.S. Ostlund, J. Chem. Phys. 67, 4351–4360 (1977). doi:10.1063/1.434580
- R. Bukowski, R. Podeszwa and K. Szalewicz, Chem. Phys. Lett. 414, 111–116 (2005). doi:10.1016/j.cplett.2005.08.048
- A. Heßelmann, J. Chem. Phys. 128, 144112:1–144112:9 (2008).doi:10.1063/1.2905808
- Y. Guo, C. Riplinger, U. Becker, D.G. Liakos, Y. Minenkov, L. Cavallo and F. Neese, J. Chem. Phys.148, 011101:1–011101:5 (2018).doi:10.1063/1.5011798
- F. Neese, F. Wennmohs, U. Becker and C. Riplinger, J. Chem. Phys. 152, 224108:1–224108:18 (2020). doi:10.1063/5.0004608
- A. Bajaj, J.P. Janet and H.J. Kulik, J. Chem. Phys. 147, 191101:1–191101:5 (2017). doi:10.1063/1.5008981
- S. Hirata, M. Head-Gordon and R.J. Bartlett, J. Chem. Phys. 111, 10774–10786 (1999). doi:10.1063/1.480443
- K.I. Igumenshchev, S. Tretiak and V.Y. Chernyak, J. Chem. Phys. 127, 114902:1–114902:9 (2007). doi:10.1063/1.2773727
- S.A. Mewes, F. Plasser and A. Dreuw, J. Phys. Chem. Lett. 8, 1205–1210 (2017). doi:10.1021/acs.jpclett.7b00157
- L. Yu, Acc. Chem. Res. 43, 1257–1266 (2010). doi:10.1021/ar100040r
- S.P. Thomas and M.A. Spackman, Aust. J. Chem. 71, 279–284 (2018). doi:10.1071/CH17620
- X. Feng, A.D. Becke and E.R. Johnson, CrystEngComm 23, 4264–4271 (2021). doi:10.1039/D1CE00383F
- W.A. Ogden, S. Ghosh, M.J. Bruzek, K.A. McGarry, L. Balhorn, V. Young, L.J. Purvis, Jr. S.E. Wegwerth, Z. Zhang, N.A. Serratore, C.J. Cramer, L. Gagliardi and C.J. Douglas, Crys. Growth Des.17, 643–658 (2017). doi:10.1021/acs.cgd.6b01497
- Z. Zhang, W.A. Ogden, V.G. Young, Jr. and C.J. Douglas, Chem. Commun. 52, 8127–8130 (2016). doi:10.1039/C6CC03259A.
- Y. Sakamoto and T. Suzuki, J. Org. Chem 82, 8111–8116 (2017). doi:10.1021/acs.joc.7b01383
- F. Anger, T. Breuer, A. Ruff, M. Klues, A. Gerlach, R. Scholz, S. Ludwigs, G. Witte and F. Schreiber, J. Phys. Chem. C 120, 5515–5522 (2016). doi:10.1021/acs.jpcc.5b12293
- S. Dasgupta, E. Lambros, J.P. Perdew and F. Paesani, Nat. Commun. 12, 6359:1–6359:12 (2021).doi:10.1038/s41467-021-26618-9
- B.P. Chekal, A.M. Campeta, Y.A. Abramov, N. Feeder, P.P. Glynn, R.W. McLaughlin, P.A. Meenan and R.A. Singer, Org. Process Res. Dev. 13, 1327–1337 (2009). doi:10.1021/op9001559
- A.M. Campeta, B.P. Chekal, Y.A. Abramov, P.A. Meenan, M.J. Henson, B. Shi, R.A. Singer and K.R. Horspool, J. Pharm. Sci. 99, 3874–3886 (2010). doi:10.1002/jps.22230
- M. Vasileiadis, C.C. Pantelides and C.S. Adjiman, Chem. Eng. Sci. 121, 60–76 (2015). doi:10.1016/j.ces.2014.08.058
- J.M. Herbert, J. Chem. Phys. 151, 170901:1–170901:38 (2019). doi:10.1063/1.5126216
- Ohio Supercomputer Center, http://osc.edu/ark:/19495/f5s1ph73.