
 ?Mathematical formulae have been encoded as MathML and are displayed in this HTML version using MathJax in order to improve their display. Uncheck the box to turn MathJax off. This feature requires Javascript. Click on a formula to zoom.
Abstract
We report on the characterisation of the lowest three electronic states of MgKr, the X
ground state associated with the Mg
(3s)
+ Kr(4p)
dissociation limit and the A
and B
excited states associated with the Mg
(3p)
+ Kr(4p)
dissociation limits. The vibrational structure of the X
ground state was measured by pulsed-field-ionisation zero-kinetic-energy photoelectron spectroscopy starting from the a
metastable state of MgKr generated by laser ablation of a Mg rod in a Kr supersonic beam. The vibrational assignment was derived from the isotopic structure of the spectra and the adiabatic ionisation energy of the
ionising transition was determined to be 38182.4(2.0) cm
. Partially rotationally resolved spectra of the A
X
and B
X
transitions were recorded by monitoring the yield of Mg
ions produced by dissociation of MgKr
using the technique of isolated-core Rydberg-dissociation spectroscopy. Analytical potential-energy functions of the X
, A
, and B
states were derived using a global model of these states that includes the spin-orbit interaction. The observation of the highest vibrational levels of the B
state and the onset of the Kr + Mg
(3p) dissociation continuum enabled the precise determination of the dissociation energies of the X
, A
and B
states of MgKr
and of the a state of MgKr. The X
, A
and B
states of MgKr
are important stepping stones to access the Rydberg states of MgKr
and the ground state of MgKr
by resonant multiphoton excitation.
GRAPHICAL ABSTRACT
1. Introduction
The Rydberg states of positively charged diatomic molecules AB are usually short lived and their spectra diffuse because their doubly charged ion cores are typically either unstable or metastable with respect to dissociation into two positively charged atoms A
+ B
[Citation1, Citation2]. Their term values
relative to the ground state of the singly charged diatomic cation can be estimated using Rydberg's formula with Z = 2
(1)
(1)
where n and ℓ represent the principal and orbital-angular-momentum quantum numbers, respectively,
stands for the ionisation energy of the singly charged molecule,
is the quantum defect, and
is the mass-corrected Rydberg constant of the cation. The ionisation energies of ions, and consequently also the term values of their Rydberg states, are much larger than is the case for neutral molecules (Z = 1). Consequently, their excitation from the ground state is challenging and requires either far-ultraviolet or soft X-ray radiation, or the absorption of numerous UV photons. For these reasons, the Rydberg states of molecular cations have received little attention so far.
Molecular Rydberg states of ions AB with thermodynamically stable doubly charged diatomic ion cores AB
are an important exception to the behaviour just described. In such cations, the ionisation energy of A
is unusually low and lower than that of B. Consequently, the ground state of the dication, with dissociation asymptote A
+ B, is characterised by an attractive (
) long-range potential and can support bound states. The low ionisation energy of A
further implies that the term values of the Rydberg states of AB
are also exceptionally low and therefore more easily accessible from the ground state of the cation. The existence of thermodynamically stable dications suggests that the singly charged parent ion must possess long-lived Rydberg states, and the existence of such long-lived Rydberg states in turn suggests that thermodynamically stable doubly charged cations can be studied at high resolution by pulsed-field-ionisation zero-kinetic-energy (PFI-ZEKE) photoelectron spectroscopy [Citation3], as demonstrated recently [Citation4].
Typical examples of thermodynamically stable diatomic dications involve metal atoms of the second (A = Be, Mg, Ca, etc.) or third/thirteenth (A = Al, Ga, Sc, Yb, etc.) groups of the periodic table of the elements and halogen (B = F, Cl, Br, etc.) or rare gas atoms (B = Ne, Ar, Kr, etc.). Extensive lists of thermodynamically stable diatomic dications have been reported by Falcinelli et al. [Citation5] and Sabzyan et al. [Citation2]. Such diatomic dications offer the prospect of studying the Rydberg states of molecular cations by high-resolution spectroscopy. Moreover, studying series of cations in which either A or B is varied within a group of the periodic table enables one to tune the binding energy of the ground state of the dications and explore the effects of the transition between thermodynamic stability and metastability of the doubly charged ion core on the structure and dynamics of the Rydberg states.
As illustration, Figure presents the expected qualitative evolution of the ground-state potential-energy functions of the dications MgRg, where Rg is a rare gas. Their binding energies rapidly increase in the series from He to Xe [Citation6]. The first ionisation energies of He, Ne, and Ar (198 310.666 37, 173 929.7726(6), and 127 109.842(4) cm
, respectively [Citation7, Citation8]; see horizontal black dashed lines in Figure ) are much larger than that of Mg
(
cm
[Citation9]; full horizontal line in Figure ), which implies thermodynamic stability of MgRg
. In the case of Kr, the ionisation energies corresponding to the formation of the
P
and
P
spin-orbit components (112 914.434(16) and 118 284.704(19) cm
, respectively [Citation8]) are smaller than that of Mg
. In these systems, one may therefore expect the existence of both stable and metastable vibrational levels of the dication MgKr
. The corresponding ionisation energies of Xe are 97 833.788(11) and 108 370.714(16) cm
, respectively [Citation8], and the vibrational levels of the MgXe
electronic state that correlates diabatically to the Mg
+ Xe dissociation limit are expected to all be located above the Mg
+ Xe
dissociation limit and thus to be metastable or unstable.
Figure 1. Overview of the potential-energy curves of the MgRg doubly charged ions (Rg = He, Ne, Ar, Kr and Xe) correlated diabatically to the Mg
+ Rg (red) and Mg
+ Rg
dissociation asymptotes (black). The origin of the energy scale was set in all cases to the dissociation limit Mg
(3s)
+ Rg(np)
of the ground state of the singly charged MgRg
cation. The Mg
+ Rg(np)
dissociation asymptote is marked by the long full horizontal black line and the Mg
+ Rg
(
dissociation asymptotes are indicated by short horizontal dashed black lines. The potential-energy functions of the ground states of MgRg
are taken from Ref. [Citation6].
![Figure 1. Overview of the potential-energy curves of the MgRg2+ doubly charged ions (Rg = He, Ne, Ar, Kr and Xe) correlated diabatically to the Mg2+ + Rg (red) and Mg+ + Rg+ dissociation asymptotes (black). The origin of the energy scale was set in all cases to the dissociation limit Mg+(3s)1 + Rg(np)6 1S0 of the ground state of the singly charged MgRg+ cation. The Mg2+ + Rg(np)6 1S0 dissociation asymptote is marked by the long full horizontal black line and the Mg+ + Rg+(2PJ,J=1/2,3/2) dissociation asymptotes are indicated by short horizontal dashed black lines. The potential-energy functions of the ground states of MgRg2+ are taken from Ref. [Citation6].](/cms/asset/24eebc05-6d48-447d-b7fc-8c670838b494/tmph_a_2152746_f0001_oc.jpg)
For experimental studies of the Rydberg states of molecular cations, diatomic molecules containing an alkaline-earth metal atom, and in particular Mg, are attractive not only because of their low second ionisation energies but also because they exhibit electronically excited states that form a ladder that is almost ideal to reach the second ionisation threshold by resonant multiphoton excitation (see Figure of Ref. [Citation4]). The structure and dynamics of these intermediate electronic states are, however, not precisely known, and these states have to be first looked for and characterised, as demonstrated in the case of MgAr [Citation10, Citation11].
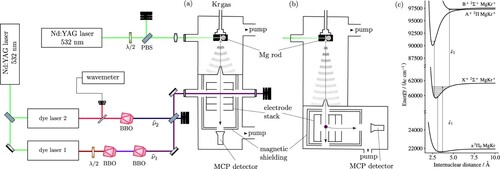
Figure 2. (a) and (b): Schematic representation of the experimental setup. Left side: Laser system including two Nd:YAG-pumped pulsed dye lasers. Right side: Ablation source chamber and detection chamber where the laser beams and the skimmed molecular beam of the probe gas intersect either (a) on the axis of an electrode stack used to extract charged particles towards a microchannel-plate (MCP) detector, or (b) perpendicularly to the axis of the stack. (c) Photoexcitation scheme used to study the X, A
(
), and B
states of MgKr
. In a first step, MgKr
is prepared in a selected vibrational level of the X
state from the metastable a
state of MgKr by mass-analysed threshold ionisation. Low and high vibrational states of the X
state are then used to access the vibrational levels of the A
and B
states, respectively.
We have recently started investigations of the Rydberg states of diatomic cations and their doubly charged ion cores by laser photoionisation and photoelectron spectroscopy [Citation4]. In the experiments, we exploit threshold ionisation techniques related to PFI-ZEKE photoelectron spectroscopy and mass-analysed threshold-ionisation (MATI) spectroscopy [Citation3, Citation12, Citation13] to first generate a chosen isotopomer of the singly charged cation in selected rovibrational levels of the ground state, and then excite it further through successive electronic states all the way to the second ionisation threshold. For most experiments, it is even advantageous not to ionise the neutral molecule in the first step but to excite it to very high Rydberg states with principal quantum number . This enables one to record spectra of transitions from selected levels of the ground state of the MgRg
ion core to predissociative electronically excited states without significant interference from the Rydberg electron. The transitions can then be detected in a background-free manner by monitoring the pulsed field ionisation of the fragment, either Rg(n) or Mg(n), as explained in Ref. [Citation14].
In this article, we report on our investigations of the first three electronic states of MgKr, the X
, A
(
), and B
states, starting from the metastable a
state of MgKr and using the photoexcitation scheme depicted in Figure (c). The X
state of MgKr
correlates asymptotically to the Mg
s
+ Kr (4p)
dissociation limit whereas the A
and B
states correlate to the Mg
p
+ Kr (4p)
dissociation limits and form what is referred to as the 3p complex. The first two vibrational levels of the X
state and the vibrational and spin-orbit structures of the A
state of MgKr
were characterised experimentally by Duncan and coworkers [Citation15] using photodissociation spectroscopy. The a
metastable state and other low-lying electronically excited states of MgKr were studied in detail by Breckenridge and coworkers [Citation16–18]. In addition, several ab initio calculations of the lowest electronic states of MgKr
were reported [Citation6, Citation19, Citation20]. Our investigation extends previous studies of the X
and A
states of MgKr
and led to the first observation of the weakly bound B
state predicted theoretically by Matsika and Pitzer for MgAr
and MgXe
[Citation21]. The focus of the present article is placed on the characterisation of the structure and dynamics of the low-lying X
, A
and B
electronic states of MgKr
using a global model for its potential-energy functions and on the determination of precise ionisation and dissociation energies for the metastable a state of MgKr and the X
, A
and B
state of MgKr
.
2. Experimental setup and procedure
The experimental setup, depicted schematically in Figure (a,b), has been described in Refs. [Citation9, Citation22] and is therefore only summarised briefly here. Neutral MgKr molecules are produced by laser ablation of a rotating Mg rod using the frequency-doubled output (532 nm) of a Nd:YAG laser in a supersonic expansion of pure Kr emitted by a pulsed valve. MgKr is formed almost exclusively in the metastable a (v = 0) state and the efficient cooling of the molecules in the supersonic expansion leads to a rotational temperature of ∼ 3 K. Numerous isotopomers are generated, with abundances reflecting the natural isotopic abundances of Mg (
Mg: 78.99%;
Mg: 10.00%;
Mg: 11.01%) and Kr (
Kr: 0.355%;
Kr: 2.286%;
Kr: 11.593%,
Kr: 11.500%;
Kr: 56.987%;
Kr: 17.279%) [Citation23]. Approximately 8 cm downstream from the valve orifice, the molecular beam passes through a 3 mm-diameter skimmer, which selects its central part. The beam then enters a resistively coupled cylindrical electrode stack in the photoexcitation chamber, where it is crossed at right angles by one or two pulsed laser beams (see Figure (a)). Pulsed electric fields are applied across the electrode stack to field ionise high-lying Rydberg states and/or extract photoelectrons or photoions towards a microchannel-plate (MCP) detector located at the end of a linear time-of-flight mass spectrometer. For some experiments, a second configuration, depicted in Figure (b), is used. In this configuration, the distance between the valve and the skimmer is increased to 26 cm and the axis of the electrode stack and time-of-flight spectrometer are perpendicular to the supersonic beam. This configuration allowed us to take full advantage of seeding the carrier gas with helium (at a typical He:Kr pressure ratio of 10:1), in particular to suppress cluster formation and to narrow down the velocity distribution of the MgKr molecules in the molecular beam, as well as to increase their density. Additionally, the detector is not in direct line of sight from the ablation source in this configuration and therefore better shielded from prompt ions.
Metastable MgKr molecules were photoexcited in the vicinity of the MgKr a ionisation threshold using the output of a Nd:YAG-pumped pulsed dye laser, after tripling its wavenumber in two successive β-barium-borate (BBO) crystals (pulse energy and linewidth after frequency upconversion of 0.3 mJ and 0.15 cm
, respectively). To further excite the molecules to the
and
states, the frequency-doubled output of a second Nd:YAG-pumped pulsed dye laser (pulse energy 0.1 mJ, linewidth 0.1 cm
) was used. The fundamental wavenumbers of both dye lasers were calibrated with a commercial wavemeter with a specified accuracy of 0.02 cm
.
PFI-ZEKE photoelectron spectroscopy [Citation24] was used to record spectra of the ionising transitions. Overview spectra were measured by applying a sequence of three electric-field pulses [(
) V cm
] across the electrode stack and monitoring the electrons generated by the second and third pulses as a function of the wavenumber of the first laser. To record spectra of individual vibrational bands at higher resolution, multiple-pulse sequences, e.g. (
) V cm
, were used. The shifts of the ionisation thresholds induced by the different pulses of the sequence were determined by measuring the PFI-ZEKE photoelectron spectra of the
ionising transition under the same experimental conditions and comparing the line positions with the precisely known field-free ionisation threshold of Mg. For the absolute vibrational assignment of the PFI-ZEKE photoelectron spectra, the isotopic shifts of high-lying (
) vibrational levels were measured at high resolution and the isotopic assignments were confirmed by MATI spectroscopy [Citation25], as explained in more detail in Section 3.1.
The 3p complex of MgKr, consisting of the A
and B
states, was studied from the X
ground state using the method of isolated-core Rydberg-dissociation spectroscopy [Citation14]. A first laser pulse excites MgKr from the metastable a
state to high-n (n>150) Rydberg states located just below a selected vibrational level of the ionic ground state MgKr
X
(
). In such states, the Rydberg electron hardly interacts with the ion core, which can thus be regarded as isolated in excellent approximation. A second laser pulse, delayed by
ns with respect to the first one, then excites the ion core from the selected X
(
) state to the MgKr
A
or B
state.
These states can dissociate into Mg Kr through a number of mechanisms involving photodissociation, fluorescence or spin-orbit predissociation, as explained in more detail in Section 3.2. The Rydberg electron remains attached to the Mg
fragment, and is ionised by applying a delayed pulsed-field sequence [(
) V cm
] consisting of a weak prepulse and a stronger main pulse used for field ionisation and ion extraction. The prepulse serves the purpose of spatially separating prompt Mg
ions from the Mg
ions generated by field ionisation, which are then observed at a different position in the time-of-flight spectra. To record the isolated-core Rydberg-dissociation spectra, the Mg
ion signal generated by pulsed field ionisation is monitored as a function of the wavenumber of the second excitation laser.
3. Experimental results and analysis
3.1. The X ground state of MgKr
Figure shows the photoionisation spectrum of Mg
Kr (a) and the PFI-ZEKE photoelectron spectrum of MgKr (b) in the vicinity of the
a
X
ionising transition, recorded following excitation from the v = 0 vibrational ground state of the metastable a
state of MgKr. The photoionisation spectrum shows a clear onset at the adiabatic ionisation threshold of metastable MgKr. On the low-wavenumber side, it consists of sharp autoionisation resonances on top of a weak constant background resulting from direct ionisation into the continua associated with the lowest vibrational levels of
Mg
Kr
. Towards higher wavenumbers, the direct ionisation to the continua associated with higher X
vibrational levels becomes energetically allowed. Because the Franck–Condon factors for excitation from the a (v = 0) state increase with increasing vibrational quantum number
of the X
state (up to
, the contributions of direct-ionisation continua becomes more and more important.
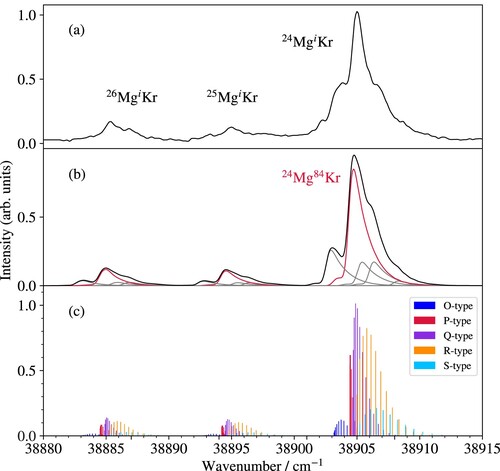
Figure 3. (a) Photoionisation spectrum of Mg
Kr in the vicinity of the
Kr a
X
ionisation threshold. (b) Measured (upper spectrum) and calculated (lower spectrum) overview PFI-ZEKE photoelectron spectra of the a
ionising transition of MgKr. The inset shows the MATI spectra of the
vibrational band recorded at the masses of 109 u (upper spectrum) and 110 u (lower spectrum).
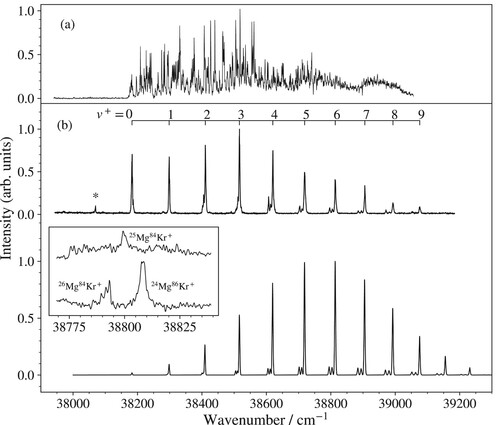
The overview PFI-ZEKE photoelectron spectrum exhibits a regular progression of vibrational bands that are labelled with the vibrational quantum number () of the X
state. The ionisation energies, corrected for the field-induced shifts of the thresholds, and the term values of all measured vibrational lines are listed in Table . Bands corresponding to
exhibit weak structures on their low-frequency side which can be attributed to the transitions of
MgKr and
MgKr, as confirmed by MATI spectroscopy. Illustrative MATI spectra of the X
band are displayed in the inset in Figure (b). The two traces correspond to the ion signal observed at the positions of the m = 109 and 110 u mass channels in the time-of-flight spectra. The dominant isotopomer at mass m = 109 u is
Mg
Kr
, whereas both
Mg
Kr
and
Mg
Kr
contribute significantly at m = 110 u and therefore two lines are observed. The shifts in frequency between the three peaks reflect the differences in the reduced masses, which are mainly determined by the Mg isotopes. The different Kr isotopes do not lead to observable shifts at the resolution of our experiments. The MATI spectra confirm that the characteristic triple-peak structure observed for
bands in the PFI-ZEKE spectrum originates from
MgKr isotopomers with i = 26, 25 and 24 in order of increasing wavenumber.
Table 1. Positions of the vibrational levels of the X
ground state of
Mg
Kr
(in cm
) given with respect to the ground vibrational level of the metastable a
state of MgKr (second column) and as term values (third column), deviations from the positions calculated from the potential-energy function presented in Section 4 (fourth column), and rotational constants determined from the potential-energy function (in cm
).
The isotope shifts of the vibrational bands enabled us to derive the absolute vibrational assignment of the X levels in a standard isotopic-shift analysis [Citation26]. Based on this assignment, the adiabatic ionisation energy of the a
state of MgKr was determined to be
cm
, in excellent agreement with the previous results of Kaup et al. [Citation27] obtained by photoionisation spectroscopy. All assignments and line positions are summarised in Table , where the experimental results are compared with the results obtained from the potential-energy curves derived as explained in Section 4. From the vibrational intervals, we also derived the vibrational constants of the X
ground state of
Mg
Kr
in a least-squares fit (
), as summarised below in Table .
The weak line marked with an asterisk in Figure (b) is not part of the a
photoelectron band system. This line disappeared when adding He to the gas mixture. Instead, a weak progression appeared on the low-wavenumber side of the spectrum. From the known vibrational structure of the a
metastable state [Citation17], we can rule out that these additional lines correspond to hot bands. They might originate from clusters (MgKr
and MgKr
He
) with
and
in the supersonic expansions, but no conclusive assignments could be derived.
Figure (c) displays the photoelectron spectrum calculated using line positions and Franck–Condon factors determined from the potential-energy functions of the a and X
states derived in the realm of this study, as explained in Section 4. The comparison between the experimental and calculated PFI-ZEKE photoelectron spectra reveals an excellent agreement in the line positions and isotopic structure, but also important differences in the line intensities. In particular, the measured transitions to the low vibrational levels of MgKr
are more intense than the calculated ones. We attribute this difference to vibrational channel interactions, as observed in similar systems before [Citation22, Citation28, Citation29]. Low-n Rydberg states belonging to series converging to higher-lying vibrational levels, which have good Franck–Condon factors for excitation from the a
state, interact with high-n Rydberg states located just below the low-lying vibrational levels of MgKr
, which have small Franck–Condon factors. The channel interactions strongly enhance the intensity of the low-
lines of the PFI-ZEKE photoelectron spectrum at the positions of these low-n, high-
Rydberg states.
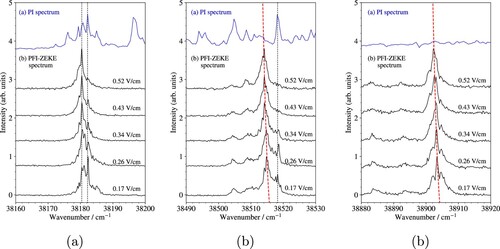
This interpretation is supported by the analysis of high-resolution spectra of individual vibrational bands. As illustration, high-resolution PFI-ZEKE photoelectron spectra of the vibrational bands and 7 are depicted in Figure (a–c). The black traces in this figure correspond to spectra recorded using electric-field pulses of different strengths (F) whereas the blue traces display the photoionisation spectra. The field-induced shifts of the ionisation thresholds in PFI-ZEKE photoelectron spectroscopy scales with
, which leads to characteristic red shifts of transitions recorded with pulses of increasing field strength, as highlighted by the red dashed lines in panels (b) and (c) of Figure . In contrast, transitions to the low-n Rydberg states that are coupled by vibrational channel interactions to the high Rydberg states detected by field ionisation are insensitive to the electric-field strength. Consequently, spectral features originating from these transitions do not shift in frequency as the electric field varies, as indicated by the dashed black vertical lines. Three different regimes can be distinguished: (i) For the low vibrational levels, which have small Franck–Condon factors (Figure (a)), the band structure consists of sharp structures which do not shift with the field. Moreover, individual peaks can all be correlated with autoionisation resonances in the photoionisation spectrum (black dotted lines). The intensity therefore originates almost entirely from channel interactions. (ii) As
increases, the relative contribution of direct ionisation becomes stronger. The overall band structure shifts proportionally to
(red dashed line), but sharp autoionisation resonances are still noticeable (Figure (b)). (iii) For the highest observed vibrational levels, channel interactions do not play a significant role any more and the line positions shift as expected from the
scaling law (Figure (c)).
Figure 4. High-resolution PFI-ZEKE photoelectron spectra of individual vibrational bands of the a photoionising transition. (a)
, (b)
, and (c)
. The black traces represent spectra recorded with successive steps of the pulsed-field-ionisation sequence and the blue traces display the corresponding photoionisation (PI) spectra. The black vertical dashed lines indicate the position of transitions to low-n Rydberg states that give intensities to the PFI-ZEKE photoelectron spectra through channel interactions. These lines are also observed as autoionisation resonances in the photoionisation spectra. The red dashed lines show the calculated line positions assuming that the field-induced shifts of the ionisation thresholds is proportional to
.
The overall intensity profile of the a
X
band is not strongly affected by channel interactions and corresponds to direct excitation to the pseudo-continuum of very high Rydberg states located just below the
level of the X
ground state of MgKr
. The intensity distribution can therefore be described as arising from direct ionisation from a neutral state with a Hund's case (a) rotational structure with total angular-momentum quantum number J to an ionic state with a Hund's case (b) structure with rotational angular-momentum quantum number
[Citation30]. This aspect is illustrated in Figure , which compares the intensity profiles measured experimentally with rotational intensity distributions calculated based on the photoionisation model of Buckingham et al. [Citation31]. The rotational constant of the MgKr
X
state was determined from the potential-energy function of the X
state (see Section 4), as listed in the last column of Table , and the a
(v = 0) rotational constant was kept fixed to the value of
cm
reported in Ref. [Citation17], including a splitting of 0.15 cm
between the two parity components of the Ω doublet (
). The best agreement between calculated and experimental spectra was found for a rotational temperature of 3 K and a Gaussian line-shape function with a full width at half maximum of 0.6 cm
, assuming the same rotational branch intensities as for the same transition in MgAr [Citation22]. In Figure , the PFI-ZEKE photoelectron spectrum of the
vibrational band is displayed in panel (a) and the calculated spectrum in panel (b). The contributions from the three isotopomers containing the main Kr isotope (
Mg
Kr, with
and 26) are depicted as red line and those of the other isotopomers as grey lines. The stick spectrum depicted in panel (c) provides the calculated rotational branch structure of
Mg
Kr with the different branches labelled by their colour. The analysis of the rotational intensity distributions enabled a precise determination of the positions of the vibrational levels of the X
state of MgKr
.
Figure 5. (a) PFI-ZEKE photoelectron spectrum of the a ionising transition of MgKr. (b) Calculated spectrum (black) with the contributions of the individual isotopomers indicated as red or grey lines. (c) Rotational stick spectrum of the three isotopomers
Mg
Kr, with i = 24, 25, and 26, marked in red in panel (b). The colours used for the sticks label the rotational branches as indicated in the inset, where O, P, Q, R and S correspond to
values of
,
, 0, 1 and 2, respectively. See text for details.
3.2. The A and B states of MgKr
Spectra of the A and B
states of MgKr
were recorded from selected vibrational levels of the X
state using isolated-core Rydberg-dissociation spectroscopy, after setting the wavenumber of the first laser to the positions of selected lines in the PFI-ZEKE photoelectron spectrum. With the second laser, the state-selected ion core was then excited to vibrational levels of the A
and B
states. The transitions were detected by monitoring the field ionisation of high Rydberg states of Mg generated through dissociation of the MgKr
ion core. The advantage of this detection scheme is that prompt Mg
ions generated by the first laser can be swept out of the photoexcitation region using a weak electric-field prepulse, making the measurements background-free [Citation14].
Three mechanisms can contribute to the dissociation of the ion core upon photoexcitation: (i) Predissociation of the A and B
states into energetically allowed Mg
+ Kr dissociation continua. Whereas the Mg
(3s) + Kr continuum is the only continuum available to the vibrational levels of the A
state, predissociation into the Mg
(3p
) + Kr continuum must also be considered for high vibrational levels located energetically between the Mg
(3p
) + Kr and the Mg
(3p
) + Kr dissociation thresholds. (ii) Dissociation into the Mg
(3s) + Kr continuum after fluorescence to the repulsive wall of the X
potential. This process is only possible for the A
state because the bound vibrational levels of the B
state have no Franck–Condon overlap with the repulsive part of the X
state (see Figure (c)). (iii) (Pre)dissociation into an electronically excited Mg
ion and Kr after absorption of one or more additional photon(s), either from the first or the second laser. These different processes can be distinguished by measuring the kinetic-energy distribution of the Mg
fragment, as was demonstrated in the case of MgAr
[Citation32].
Figure displays the isolated-core Rydberg-dissociation spectrum of the A band system. The spectrum consists of two vibrational progressions corresponding to the two spin-orbit components of the A
state (
). The vibrational and spin-orbit spacings observed in this spectrum correspond closely to those derived by Pilgrim et al. [Citation15] in their study of the photodissociation spectrum of MgKr
. Pilgrim et al. have determined the absolute vibrational numbering of both progressions on the basis of isotopic shifts and relative intensities and concluded that the spin-orbit structure is regular, i.e. the
levels lie energetically below the
levels of the same vibrational quantum number. The fact that the spin-orbit coupling constants of the observed vibrational levels with
are larger than for the isolated Mg
(3p) ion was later explained by Matsika and Pitzer [Citation21]. The assignments reported in Figure are taken from the work of Pilgrim et al. [Citation15] and our results only differ from theirs by a global wavenumber shift of about 45 cm
originating from the absolute-frequency calibration. The wavenumbers of all transitions of the A
-X
band system measured in the present work are listed in Table , which also presents a comparison of the vibrational term values of the A
state with the experimental results of Pilgrim et al. [Citation15] and the term values calculated from the potential-energy function of the A
state (see Section 4). The last column of the table lists the rotational constants of the A
vibrational levels derived from the A
-state potential functions.
Figure 6. (a) Isolated-core Rydberg-dissociation spectrum of the A band system of
MgKr
obtained by monitoring the
Mg
ions generated by field ionisation of the high-n Rydberg states of Mg. The dashed assignment tick marks designate the transitions that were not observed. The inset shows the rotational contour of the A
band recorded at high resolution (black line) and a calculated profile (red line) obtained using rotational constants of 0.106 and 0.139 cm
for the X
(1) and A
(2) states, respectively. The bottom and top horizontal axes give the transition wavenumbers and the term values with respect to the X
ground state of MgKr
, respectively. See text for details. (b) Franck–Condon factors of the A
transitions (blue lines) and products of Franck–Condon factors corresponding to the absorption-emission sequence
(orange lines).
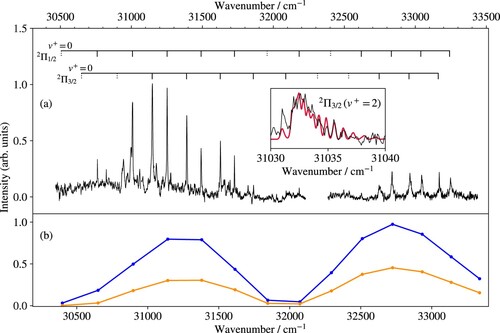
Table 2. Term values (in cm) of the vibrational levels of the A
(first entry for each value of
) and A
(second entry) states of
Mg
Kr
with respect to the X
state (second column) and the A
state (third column) determined from the isolated-core Rydberg-dissociation spectrum of the A
band system, differences from the term values calculated from the potential-energy functions reported in Section 4 (
) and from those reported by Pilgrim et al. [Citation15] (
, in cm
) and rotational constants (
, in cm
) determined from the potential-energy functions.
Table 3. Term values (in cm) of the vibrational levels of the B
state of
Mg
Kr
with respect to the X
state (second column) and to the B
state (third column) determined from the isolated-core Rydberg-dissociation spectrum of the B
band system, differences from the term values calculated from the potential-energy function of the B
state reported in Section 4 (
, in cm
), and rotational constants (
, in cm
) determined from the potential-energy function.
Table 4. Parameters describing the potential-energy functions of the X, A
, and B
states of MgKr
according to Equations (Equation2
(2)
(2) )–(Equation9
(9)
(9) ). All parameters in the upper part of the table except
and
were obtained in a weighted least-squares fit to the experimental term values. The parameters in the lower part of the table were kept fixed during the least-squares fit. The weighted root-mean-square deviation of the fit was 0.75 for the X
state and 0.3 for the 3p complex.
Table 5. Molecular constants of the a state of MgKr and of the X
, A
(
), and B
states of MgKr
. The term values
of the ground vibrational levels of the different electronic states are given with respect to the ground vibrational level of the X
state of MgKr
. All values are in cm
except
, which is in
.
Transitions to A vibrational levels with
appear broader than those to vibrational levels with
. The broadening arises from the increasing isotopic shifts as
increases and results in a reduced maximal line intensity of the transitions to
levels. This aspect must be considered when comparing the vibrational intensity distribution with calculated Franck–Condon factors.
Interestingly, the ground vibrational level of the A
state was neither observed in our spectrum nor in the spectrum of Pilgrim et al. [Citation15], although the Franck–Condon factors for excitation of the A
state from both the X
(
) vibrational levels calculated from the potential-energy functions of the X
and A
states (see Section 4) should have been large enough. The nonobservation of the A
vibrational level provides the clue for the interpretation of the dissociation mechanism leading to the Mg
fragment in both studies. Pilgrim et al. [Citation15] argued that the Mg
dissociation product observed in their spectra originates from the fragmentation of a higher-lying electronic state of MgKr
accessed in a resonant 1 + 1 two-photon excitation process. In contrast, we argue that the Mg
ions are generated following fluorescence of the A
state to the repulsive wall of the X
state. All observed vibrational states of the A
state except the
ground state have large Franck–Condon factors to the dissociation continuum of the X
state, so that fluorescence takes place on the nanosecond time scale [Citation19]. In the case of the A
(
) state, the overlap with the repulsive part of the ground-state potential is small and the fluorescence predominantly takes place to bound levels of the X
state, which effectively prevents the observation of Mg
fragments. In the lower part of Figure , the Franck–Condon factors of the A
transitions are depicted in blue and the products of the Franck–Condon factors corresponding to the absorption-emission sequence
in orange. These products of Franck–Condon factors give a qualitatively satisfactory description of the intensities observed in the isolated-core Rydberg-dissociation spectrum, which confirms the proposed mechanism.
Several bands of the A-X
transition were recorded at high resolution to observe their rotational structure. As an example, the inset in Figure (a) presents the spectrum of the A
band and compares it with a spectrum calculated assuming rotational line strengths for a transition from an initial level described by Hund's angular-momentum-coupling case (b) to a final level described by Hund's case (a) [Citation33]. To model the rotational structure, the rotational constant of the X
state was fixed at the value of 0.106 cm
reported in the last column of Table and the rotational constant of the A
level was optimised to reproduce the measured rotational contours of the bands. This procedure resulted in a value of
cm
for the A
level, which is in excellent agreement with the value determined from the potential-energy function of the A
state (see Section 4). The sharp line on the low-wavenumber side of the spectrum represents the bandhead of the P branch and the main blue-degraded structure corresponds to the overlapping Q and R branches.
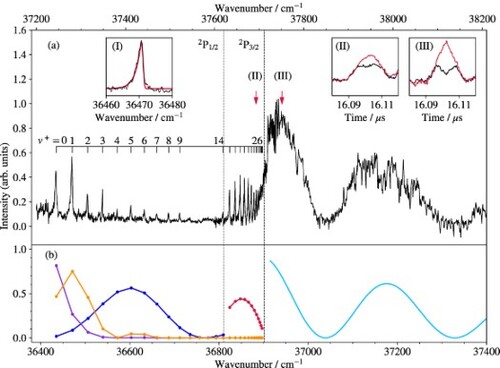
The isolated-core Rydberg-dissociation spectrum of the B band system of
Mg
Kr
is displayed in Figure (a). It was obtained by monitoring the
Mg
ions produced by pulsed field ionisation of the high-n Rydberg states of Mg generated in the dissociation process. The spectrum consists of a vibrational progression that extends all the way to the Mg
(3p
) + Kr dissociation limit and beyond, and closely resembles the spectrum obtained for the B
band system of MgAr
[Citation32]. Beyond the dissociation limit, the Mg
signal exhibits broad oscillations with minima corresponding to the projections of the nodal points of the vibrational wavefunction of the
level of the X
state onto the repulsive wall of the B
-state potential-energy function, as discussed in more detail in Section 4. Several vibrational bands of the B
transition (not shown) were also measured for
Mg
Kr
and the absolute vibrational numbering of the progression was derived from the analysis of the isotopic shifts. The lowest observed level of the B
state is the
ground state, so that an overview of the B
state, from its origin to the dissociation limit, is obtained in a single spectrum (see Figure ), which is rather unusual. Table lists the term values of the observed vibrational levels of the B
state with respect to the X
ground vibronic state (second column) and with respect to the B
state (third column).
Figure 7. (a) Isolated-core Rydberg-dissociation spectrum of the B band system of MgKr
obtained by monitoring the
Mg
ions after field ionisation of the high-n Rydberg states of Mg. Inset I presents the rotational contour of the B
band recorded at high resolution (black line) and a calculated profile (red line) obtained using rotational constants of 0.091 and 0.051 cm
for the X
(8) and B
(1) states, respectively. Insets II and III show the TOF distributions of Mg
ions measured at the spectral positions marked by the vertical arrows above the spectrum for laser polarisation parallel (black) and perpendicular (red) to the axis of the TOF mass spectrometer. (b) Intensities derived from Franck–Condon factors (red dots) and densities (full pale-blue line) for the transitions to
levels and to the B
-state continuum above the Mg
(3p
) threshold, as well as from products of Franck–Condon factors (orange dots and line) of the B
transition with
(blue dots and line) and Franck–Condon densities for the transition from
to the continuum of the Mg
(3d
)Kr
electronic state (purple dots and line). The bottom and top horizontal axes give the transition wavenumbers and the term values with respect to the X
ground state of MgKr
, respectively. See text for details.
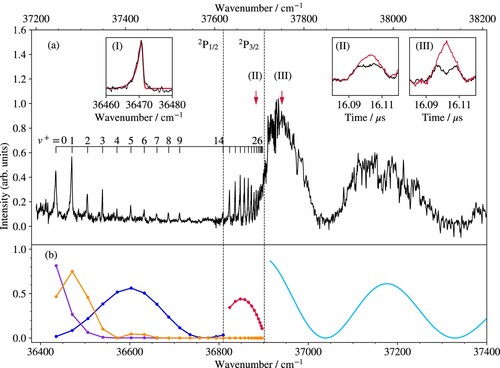
The observation of the lowest and highest vibrational levels and of the onset of the dissociation continuum in a single spectrum enabled us to directly and accurately determine the dissociation energy (466.6(2.0) cm) of the B
state of
Mg
Kr
. Because the relative positions of the different dissociation thresholds of MgKr and MgKr
are separated by precisely known energy differences between the levels of Mg and Mg
, the determination of the Mg
(3p
) + Kr dissociation limit from the spectrum depicted in Figure enabled us to also accurately determine the dissociation energies of the X
, A
and B
states of MgKr
and of the metastable a state of MgKr, as summarised in Table below.
The intensity distribution of the isolated-core Rydberg-dissociation spectrum of the B transitions consists of two distinct regions separated by a short section with almost vanishing intensity. In the low-wavenumber range up to about 36750 cm
, the intensity first increases, reaches a maximum at the transition to the B
level and then decreases gradually before rising again sharply about 90 cm
below the Mg
(3p
dissociation threshold, i.e. at a position that almost exactly corresponds to the position of the Mg
(3p
dissociation threshold (see left vertical dashed line in Figure (a)). This sudden rise is a clear signature of the onset of spin-orbit predissociation into the Mg
(3p
dissociation continuum. Measurements of kinetic energy distributions of the Mg
fragments by TOF mass spectrometry corroborate this interpretation, as illustrated in Insets II and III of Figure (a). The TOF distributions displayed in black and red colour in these insets were measured at the spectral positions designated by the red arrows after setting the polarisation of the photodissociation laser parallel and perpendicular to the TOF axis, respectively. In the former case, the distributions show a double-peak structure reflecting the emission of Mg
ion fragments towards and away from the detector, as expected for a parallel
transition. In the latter case, the fragments are emitted in the direction perpendicular to the TOF axis, leading to a single broader distribution with maximum located at the position of the local minimum of the former distribution. The analysis of the kinetic-energy distributions corresponding to these profiles, following the same procedure as used in our study of the photodissociation of MgAr
[Citation32], unambiguously confirms that the dissociation of B
vibrational levels takes place into the Mg
(3p
dissociation channel by spin-orbit predissociation. The intensity distribution of the isolated-core Rydberg-dissociation spectrum of the B
band system beyond B
can thus be modelled by calculating the corresponding Franck–Condon factors (red dots in Figure (b)) and Franck–Condon densities for the transitions to the B
-state continuum above the Mg
(3p
) + Kr dissociation threshold (full pale-blue line in Figure (b)). These Franck–Condon factors and densities were calculated as described in our study of the B
state of MgAr
[Citation32] and describe the observed intensity distribution well.
The mechanism leading to the detection of Mg ions by field ionisation of Mg(n) Rydberg states in the case of the transitions to
levels of the B
state is different because the Mg
dissociation continua are not accessible energetically. Measurements of Mg
kinetic-energy and angular distributions (not shown) indicate that dissociation takes place to the Mg
continuum after absorption of a second photon from the B
levels and that the continuum state has the same Σ electronic character as the B
state. In this case, the calculated relative-intensity distribution is depicted as orange dots and line in Figure (b) and corresponds in this case to products of the Franck–Condon factors of the B
transitions (blue dots and line in Figure (b)) with Franck–Condon densities for the transitions from
levels to the continuum of the Mg
(3d
)Kr electronic state (purple dots and line). Although the intensities of the transitions to levels with
values in the range between 4 and 9 are underestimated by the calculations, the qualitative agreement of the calculated intensities with the measured intensities presented in Figure (b) supports this interpretation of the dissociation mechanism. We believe that the differences in the calculated and measured intensities of the
levels originates from the rather crude intensity model used to describe this 1 + 1 resonant two-photon dissociation process and from the assumed shape of the repulsive wall of the Mg
(3d
)Kr state, which we have modelled using a simple repulsive potential of the form depicted in the top panel of Figure , as discussed further in Section 4.
High-resolution spectra of individual bands of the B system exhibit a characteristic asymmetric line shape with a degradation towards the low-wavenumber side, as illustrated for the
band in Inset I of Figure (a). The line shape originates from the fact that the rotational constants of the B
levels are smaller than that of the X
level and can be used to estimate the rotational constants of the B
vibrational levels. For the
band, for instance, the rotational constant can be estimated to be 0.051(8) cm
if the rotational constant of the X
(8) level (0.091 cm
) is taken from the last column of Table . This value is in agreement with the rotational constant determined from the potential-energy function of the B
state (see Section 4 and last column of Table ).
4. Potential-function analysis
The data presented in the previous section were used to derive potential-energy functions for the X, A
and B
states of MgKr
following the same procedure as already employed in our studies of these states in MgAr
[Citation10, Citation22, Citation32]. In brief, potential-energy functions with adjustable parameters of the form [Citation34]
(2)
(2)
were used to calculate the vibrational energies by solving the Schrödinger equation in a discrete variable representation. These potential functions combine short-range terms with the leading terms of the long-range (LR) interaction series. In Equation (Equation2
(2)
(2) ),
and
are related to the equilibrium distance
and the potential-well depth
by
(3)
(3)
and
(4)
(4)
where
is given by
(5)
(5)
The parameter
is manually adjusted to ensure an adequate description of the experimental data with as few terms as possible in Expansion (Equation5
(5)
(5) ). The long-range behaviour of the potentials is described by the dominant electrostatic interactions between Kr and either Mg
(3s) for the X
state or Mg
(3p) for the A
and B
states
(6)
(6)
as explained in Ref. [Citation10]. The damping functions [Citation35, Citation36]
(7)
(7)
guarantee a smooth transition from the short- to the long-range parts of the potential. Because the parameters of the long-range interaction series are known [Citation37, Citation38], only five parameters (
, and
) need to be adjusted for each potentials.
These parameters were refined in least-squares fits of the calculated vibrational term values to the experimental ones, as listed in Tables –. For the X state, which can be treated independently of the other two states, the vibrational term values are obtained directly from the potential-energy function. For the 3p complex, the spin-orbit interaction is included through an R-dependent spin-orbit-coupling function with three additional adjustable parameters
and I,
(8)
(8)
which couples the A
and B
states and is constructed so as to give the correct asymptotic spin-orbit splitting at
, i.e.
cm
, corresponding to the separation between the
and
states of Mg
[Citation7]. The adiabatic potential-energy functions of the three states A
, A
and B
of the 3p complex are obtained by determining the eigenfunctions of the matrix
(9)
(9)
at each values of R. The vibrational term values of each of these adiabatic states are then calculated independently.
With this model, the experimentally determined positions of all observed vibronic states could be reproduced with a weighted root-mean-square value of 0.3, indicating an adequate description of the level energies within the experimental uncertainties. In the least-squares-fitting procedure, the parameters were also optimised so that the potential model accurately reproduces the spectrum of the direct photodissociation into the continuum of the B state (see Figure (a)). The optimised model parameters are summarised in Table and the deviations between experimental and calculated term values are listed in Tables – for the X
, A
and B
states, respectively. Figure displays the potential functions of the X
, A
, A
and B
states determined in the least-squares fit. The full horizontal lines mark the positions of the vibrational levels that were determined in the present study and the dashed lines the levels that can be reliably predicted although they could not be observed experimentally. The figure also depicts in purple colour the squares of the vibrational wavefunctions of the X
(1) and X
(8) levels that were used to access the A
and B
states, respectively. The nodal point of the X
(1) wavefunction is located at an internuclear distance of
Å. At this distance, the attractive walls of the A
and A
states have a potential energy of about 32 200 cm
above the vibronic ground state, which corresponds to the region around the A
, where the intensity distribution of the A
band reaches a minimum in Figure . The nodal structure of the X
(8) wavefunction is also aligned vertically with the positions of the repulsive wall of the B
state where intensity minima are observed in the spectrum of the B
-X
band system (see Figure ). The first minimum is located in the bound part of the spectrum, near the B
(10) level, whereas the next two minima are located in the dissociation continuum of the B
state. Interestingly we observe a small energy shift between the positions of the projections of the nodes of the X
wavefunction and the minima of the Franck–Condon densities that describe the calculated intensity distribution presented in Figure (b).
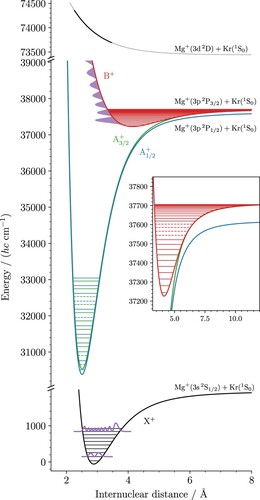
Figure 8. Potential-energy functions of the X (black), A
(blue), A
(green) and B
(red) states of MgKr
derived from the experimental data in a least-squares fit. The origin of the wavenumber scale is set at the position of the X
ground state of MgKr
. The full horizontal lines indicate the positions of the measured vibrational levels and the dashed lines the positions that could not be measured but nevertheless safely extrapolated. The square of the wavefunctions of the
= 1 and 8 levels of the X
state used to access the A
and B
levels, respectively, are drawn in purple. The projection of the
level on the potential of the B
state is also drawn to explain the intensity minima in the spectrum of the B
transition depicted in Figure . The top panel presents the estimated shape of the potential of the Mg(3d
)Kr
state that was used to calculate the relative intensities of the B
bands shown in Figure (b). The relevant part of the potential is highlighted in bold font. The inset presents the structure of the B
state on an enlarged scale.
The Franck–Condon density is essentially determined by the overlap between the initial-state wavefunction and the first maximum of the final-state wavefunctions located near the repulsive potential wall. Because the maximum is not located at the classical turning point but rather slightly inside the classically allowed region, the Franck–Condon density can differ from the vertical projection of the square of the wavefunction onto the final-state potential function. This effect is known to be more important for flatter potentials [Citation39], as is the case for the repulsive wall of the B state considered here.
The dissociation mechanisms leading to the observation of the Mg fragments need to be considered for a quantitative interpretation of the measured intensity distributions, as explained in Section 3. In particular, the relative intensities of the transitions to the lowest vibrational levels of the B
state can only be explained if the Franck–Condon densities of the transition from the B
levels to the repulsive wall of the Mg
(3d
)Kr electronic state are considered. This information was used to estimate the shape of this repulsive wall from the relative intensities observed experimentally. To this end, we used a potential function consisting of a single Born–Mayer term
(10)
(10)
and refined the values of A and b to best match the observed intensity distribution. The term value
of the dissociation asymptote was fixed at the position of the Mg
(3d) level (73440.2 cm
) [Citation7]. The procedure yielded the values A = 10261 cm
and
Å
. The resulting potential function over the range of kinetic energies of the fragments probed in the experiments is depicted as full line in the top panel of Figure . Given the approximations made and the simplicity of the function, this potential must be regarded only as a rough estimate. The complete shape of the 3dσ potential-energy function is certainly more complex. High-level ab-initio calculations of the MgAr
ion suggest, for example, the existence of a deeply bound minimum located behind the repulsive wall, at shorter internuclear distances [Citation32].
The potential model presented above also gives an adequate description of the observed spin-orbit splittings of the vibrational levels of the A state. The R dependence of the spin-orbit-coupling constant
derived from the experimental data is presented in Figure and reproduces the general pattern predicted by Matsika and Pitzer [Citation21]. The inset Figure compares the experimental splittings observed for different vibrational levels in the present work (red dots with error bars) and those determined by Pilgrim et al. [Citation15] (blue crosses) with the splittings calculated using our potential model (black dots). All results agree within the experimental uncertainties.
Figure 9. R dependence of the spin-orbit-coupling constant used to describe the 3p complex of MgKr
. The inset compares the splittings between the A
and
levels measured in the present work (red dots) with the values determined by Pilgrim et al. [Citation15] (blue crosses) and calculated using our potential model for the 3p complex of MgKr
(black dots).
![Figure 9. R dependence of the spin-orbit-coupling constant a(R) used to describe the 3p complex of MgKr+. The inset compares the splittings between the A+ 2Π3/2(v+) and 2Π3/2(v+) levels measured in the present work (red dots) with the values determined by Pilgrim et al. [Citation15] (blue crosses) and calculated using our potential model for the 3p complex of MgKr+ (black dots).](/cms/asset/c4a3a7f9-54d0-4688-86ae-d0994b291f98/tmph_a_2152746_f0009_oc.jpg)
5. Conclusions
In this article, we have reported measurements by high-resolution photoionisation, photoelectron, and photodissociation spectroscopy of the structure and dynamics of the lowest three electronic states of MgKr, the X
, A
and B
states. Our interest in these originates from the fact that they represent stepping stones to reach higher lying Rydberg states of MgKr
and the doubly charged MgKr
ion. The measurements were carried out starting from cold metastable MgKr molecules in the a
state. Using PFI-ZEKE photoelectron and MATI spectroscopy, specific isotopomers of MgKr
were prepared in selected vibrational levels of the X
ground state that were then used as initial states to record spectra of transitions to the A
and B
states by isolated-core Rydberg-dissociation spectroscopy.
The results have not only enabled the full characterisation of the rovibronic structure of MgKr up to term values of
cm
, but have also clarified important aspects of the photoionisation and photodissociation dynamics of MgKr and MgKr
. The threshold photoionisation of metastable MgKr is dominated by vibrational autoionisation, which enabled the observation of the lowest vibrational levels of the X
state despite low Franck–Condon factors. Three distinct dissociation mechanisms were observed for the A
and B
state of MgKr
, affecting the vibrational levels of these two states very differently. Whereas the vibrational levels of the A
state observed here dissociate by spontaneous emission to the dissociation continuum of the X
state, the low-vibrational levels of the B
state dissociate into the Mg(3d) + Kr
continuum after photoabsorption to the repulsive wall of the 3dσ state. High vibration levels of the B
state with
undergo spin-orbit predissociation into the Mg(3p
) + Kr continuum. These conclusions were drawn from measurements of the kinetic-energy and angular distributions of the Mg
fragment and from the comparison of the vibrational intensity distributions with calculated Franck–Condon factors and densities for bound-to-bound and bound-to-continuum transitions, respectively.
From the analysis of the intensity distributions and isotopic structure of the PFI-ZEKE photoelectron spectrum of the X
ionising transition, the adiabatic ionisation energy of the metastable a
state of MgKr was determined. The observation of the vibrational structure of the B
state from the lowest vibrational level all the way to the Mg(3p
) + Kr dissociation limit and beyond has led to the determination of a precise value of the dissociation energy of the B
state. Using precisely known energy intervals between the electronic states of Mg and Mg
, accurate dissociation energies of the metastable a state of MgKr and of the X
and A
and A
states of MgKr
were also derived. Table summarises the ionisation and dissociation energies, the equilibrium separation and vibrational constants obtained for these states. All observation, including rotational, vibrational and spin-orbit intervals and intensity distributions, could be satisfactorily interpreted using a global potential model that includes the effects of the spin-orbit coupling and its R dependence. This model gives a complete and accurate description the bound levels of the MgKr
up to the third dissociation limit.
The rovibrational levels of MgKr characterised in the realm of the present investigation are ideal intermediate states to access higher-lying Rydberg states of MgKr
and the long-lived rovibrational levels of MgKr
. Their wavefunctions are distributed over a broad range of internuclear distances, from about 2.5 Å to almost 10 Å. Moreover, their term values are approximately one third of the expected ionisation energy of the X
state so that only two additional UV photons would be required to reach the ground state of MgKr
.
Acknowledgments
It is a particular pleasure to dedicate this article to Professor Wim Ubachs and to thank him for being a most inspiring colleague for many years. We thank Josef A. Agner and Hansjürg Schmutz for their technical assistance and maintenance of the spectrometer and Dominik Wehrli for his early contributions to this project.
Disclosure statement
There are no conflict of interest to declare.
Additional information
Funding
References
- D. Schröder and H. Schwarz, J. Phys. Chem. A 103 (37), 7385–7394 (1999). doi:10.1021/jp991332x.
- H. Sabzyan, E. Keshavarz and Z. Noorisafa, J. Iran. Chem. Soc. 11 (3), 871–945 (2014). doi:10.1007/s13738-013-0359-5.
- I. Fischer and S.T. Pratt, Phys. Chem. Chem. Phys. 24, 1944–1959 (2022). doi:10.1039/D1CP04984D.
- D. Wehrli, M. Génévriez and F. Merkt, Phys. Chem. Chem. Phys. 23 (18), 10978–10987 (2021). doi:10.1039/D1CP00730K.
- S. Falcinelli, F. Fernández-Alonso, K.S. Kalogerakis and R.N. Zare, Mol. Phys. 88 (3), 663–672 (1996). doi:10.1080/00268979609482445.
- A.M. Gardner, C.D. Withers, J.B. Graneek, T.G. Wright, L.A. Viehland and W.H. Breckenridge, J. Phys. Chem. A 114 (28), 7631–7641 (2010). doi:10.1021/jp103836t.
- A. Kramida, Y. Ralchenko and J. Reader and NIST ASD Team, NIST Atomic Spectra Database (ver. 5.9), [04.02.2022] 2021, https://physics.nist.gov/asd.
- V.L. Sukhorukov, I.D. Petrov, M. Schäfer, F. Merkt, M.W. Ruf and H. Hotop, J. Phys. B: At. Mol. Opt. Phys. 45 (9), 092001 (2012). doi:10.1088/0953-4075/45/9/092001.
- M. Génévriez, D. Wehrli, J.A. Agner and F. Merkt, Int. J. Mass Spectrom. 435, 209–216 (2019). doi:10.1016/j.ijms.2018.10.017.
- M. Génévriez, D. Wehrli and F. Merkt, J. Chem. Phys. 153 (7), 074311 (2020). doi:10.1063/5.0015608.
- M. Génévriez, D. Wehrli, T. Berglitsch and F. Merkt, Phys. Rev. A 104 (4), 042811 (2021). doi:10.1103/PhysRevA.104.042811.
- K. Müller-Dethlefs and E.W. Schlag, Angew. Chem. (int. ed. engl.) 37 (10), 1346–1374 (1998). doi:10.1002/(ISSN)1521-3773.
- F. Merkt, S. Willitsch and U. Hollenstein, in Handbook of High-Resolution Spectroscopy, edited by M. Quack and F. Merkt, Vol. 3 (John Wiley & Sons, Chichester, 2011), pp. 1617–1654
- M. Génévriez, D. Wehrli and F. Merkt, Mol. Phys. 118 (11), e1703051 (2020). doi:10.1080/00268976.2019.1703051.
- J.S. Pilgrim, C.S. Yeh, K.R. Berry and M.A. Duncan, J. Chem. Phys. 100 (11), 7945–7956 (1994). doi:10.1063/1.466840.
- J.G. Kaup and W.H. Breckenridge, J. Chem. Phys. 107, 6005–6013 (1997). doi:10.1063/1.474269.
- J.G. Kaup, A.W.K. Leung and W.H. Breckenridge, J. Chem. Phys. 107, 10492–10505 (1997). doi:10.1063/1.474213.
- W.H. Breckenridge, V.L. Ayles and T.G. Wright, Chem. Phys. 333 (1), 77–84 (2007). doi:10.1016/j.chemphys.2007.01.008.
- C.W. Bauschlicher Jr. and H. Partridge, Chem. Phys. Lett. 239 (4–6), 241–245 (1995). doi:10.1016/0009-2614(95)00449-E.
- W.D. Tuttle, J.P. Harris, Y. Zheng, W.H. Breckenridge and T.G. Wright, J.Phys. Chem. A 122 (38), 7679–7703 (2018). doi:10.1021/acs.jpca.8b07139.
- S. Matsika and R.M. Pitzer, J. Phys. Chem. A 102, 1652–1656 (1998). doi:10.1021/jp980032x.
- D. Wehrli, M. Génévriez, C. Kreis, J.A. Agner and F. Merkt, J. Phys. Chem. A 124 (2), 379–385 (2020). doi:10.1021/acs.jpca.9b10435.
- E.R. Cohen, T. Cvitaš, J.G. Frey, B. Holmström, K. Kuchitsu, R. Marquardt, I. Mills, F. Pavese, M. Quack, J. Stohner, H.L. Strauss, M. Takami and A.J. Thor, Quantities, Units and Symbols in Physical Chemistry, 3rd ed. (RSC Publishing, Cambridge, 2007).
- K. Müller-Dethlefs and E.W. Schlag, Annu. Rev. Phys. Chem. 42 (1), 109–136 (1991). doi:10.1146/physchem.1991.42.issue-1.
- L. Zhu and P. Johnson, J. Chem. Phys. 94 (8), 5769–5771 (1991). doi:10.1063/1.460460.
- G. Herzberg, Molecular Spectra and Molecular Structure, Volume I, Spectra of Diatomic Molecules, 2nd ed. (Van Nostrand Reinhold Company, New York, 1950).
- J.G. Kaup and W.H. Breckenridge, J. Chem. Phys. 107, 2180–2186 (1997). doi:10.1063/1.474627.
- F. Merkt and T.P. Softley, Int. Rev. Phys. Chem. 12 (2), 205–239 (1993). doi:10.1080/01442359309353282.
- R. Signorell and F. Merkt, J. Chem. Phys. 109 (22), 9762–9771 (1998). doi:10.1063/1.477646.
- H. Lefebvre-Brion and R.W. Field, in The Spectra and Dynamics of Diatomic Molecules, Chap. 7 (Elsevier, Amsterdam, 2004), pp. 469–549.
- A.D. Buckingham, B.J. Orr and J.M. Sichel, Phil. Trans. R. Soc. Lond. Ser. A 268 (1184), 147–157 (1970). doi:10.1098/rsta.1970.0068. A Discussion on Photoelectron Spectroscopy
- D. Wehrli, M. Génévriez, S. Knecht, M. Reiher and F. Merkt, J. Chem. Phys. 153 (7), 074310 (2020). doi:10.1063/5.0015603.
- H. Lefebvre-Brion and R.W. Field, in The Spectra and Dynamics of Diatomic Molecules, Chap. 6 (Elsevier, Amsterdam, 2004), pp. 347–467.
- R.J. Le Roy, J. Quant. Spectrosc. Radiat. Transf. 186, 179–196 (2017). doi:10.1016/j.jqsrt.2016.06.002.
- C. Douketis, G. Scoles, S. Marchetti, M. Zen and A.J. Thakkar, J. Chem. Phys. 76 (6), 3057–3063 (1982). doi:10.1063/1.443345.
- R.J. Le Roy, C.C. Haugen, J. Tao and H. Li, Mol. Phys. 109 (3), 435–446 (2011). doi:10.1080/00268976.2010.527304.
- J. Mitroy and J.Y. Zhang, Eur. Phys. J. D 46 (3), 415–424 (2008). doi:10.1140/epjd/e2007-00320-5.
- M. Medveď, P.W. Fowler and J.M. Hutson, Mol. Phys. 98 (7), 453–463 (2000). doi:10.1080/00268970009483311.
- R. Schinke, Photodissociation Dynamics (Cambridge University Press, Cambridge, 1993).
- R.J. Le Roy, J. Chem. Phys. 101 (12), 10217–10228 (1994). doi:10.1063/1.467902.