
 ?Mathematical formulae have been encoded as MathML and are displayed in this HTML version using MathJax in order to improve their display. Uncheck the box to turn MathJax off. This feature requires Javascript. Click on a formula to zoom.
Abstract
Nitric oxide (NO) molecules travelling in pulsed supersonic beams have been laser photoexcited to long-lived Rydberg states in series converging to the lowest lying, , and first excited,
, vibrational states in the ground electronic state of NO
. After excitation, the molecules were decelerated in the travelling electric traps of a chip-based Rydberg–Stark decelerator. Deceleration to rest in the laboratory-fixed frame of reference allowed subsequent electrostatic trapping before in situ detection by pulsed electric field ionisation. The decay rates of the molecules from the traps were measured for states with principal quantum numbers between 32 and 48. Comparison of the corresponding trap decay time constants, ranging from 245 to
s for states with
, with those recorded for molecules in states with
, allowed bounds to be placed on the vibrational autoionisation rates of the ℓ-mixed Stark states prepared in the experiments of
Hz.
GRAPHICAL ABSTRACT

1. Introduction
Cold samples of gas-phase atoms and molecules in high Rydberg states, travelling in velocity-controlled beams or confined in traps, are of importance, for example, in studies of (1) excited state decay processes, including effects of blackbody radiation, spontaneous emission, dissociation and autoionisation [Citation1–6]; (2) resonant energy transfer and van der Waals interactions [Citation7–9]; and (3) ion-molecule reactions at low collision energies, or low translational temperatures [Citation10–12]. These samples can be prepared in a general way, by exerting forces on excited molecules initially travelling in pulsed supersonic beams, using inhomogeneous electric fields [Citation13–16]. This approach is referred to as Rydberg–Stark deceleration, and takes advantage of the large static electric dipole moments associated with ℓ-mixed Rydberg–Stark states (ℓ is the orbital angular momentum quantum number of the Rydberg electron) [Citation17]. These static electric dipole moments scale with , and exceed 3000 D for n>30.
The implementation of scalable, chip-based Rydberg–Stark decelerators [Citation18,Citation19] has recently allowed deceleration to rest in the laboratory-fixed frame of reference, and electrostatic trapping of nitric oxide (NO) molecules [Citation5]. In a 30 K cryogenic environment, molecules in Rydberg series converging to the lowest, , vibrational state in the ground electronic state of NO
(
is the vibrational quantum number of the NO
ion core), and principal quantum numbers, n, between 32 and 50 were trapped for times in excess of 1 ms. The time constants associated with the decay of the molecules from the traps ranged from 200 to
s, and generally decreased as the value of n was increased. These observations yielded new insights into effects of vibrational channel interactions on slow decay processes of long-lived molecular Rydberg states [Citation6].
Here we report, deceleration and electrostatic trapping of vibrationally excited Rydberg molecules. In this case, the Rydberg states prepared by laser photoexcitation converged to the first excited, , vibrational state in the X
ground electronic state of NO
. Since the particular states studied, with values of n between 32 and 48, and rotational quantum numbers
, and 2, lie energetically above the lowest,
, ionisation limit of the molecule, they can, in addition to decaying by spontaneous emission and predissociation, also decay by autoionisation. Comparison of the measured decay rates of the molecules from the electrostatic traps with those recorded for molecules in states with
has allowed bounds to be placed on the rates of vibrational autoionisation of the experimentally accessible long-lived Rydberg states. Together with their direct relevance to investigations of excited state decay dynamics, the decelerated and trapped Rydberg molecules prepared in the work described here are of interest for low-energy collision studies, including studies of resonant energy transfer and ion-molecule reactions, with a vibrationally excited ion core.
The remainder of this article is structured as follows: In Section 2 the apparatus and laser photoexcitation scheme used in the experiments are described. In Section 3, the results of measurements of quantum-state-dependent decay rates of electrostatically trapped molecules are presented, along with an analysis of the role of intramolecular interactions in the excited state decay dynamics. Finally, in Section 4 conclusions are drawn.
2. Experiment
2.1. Apparatus
The central part of the apparatus used in the experiments is depicted schematically in Figure . This setup is identical to that used in Refs. [Citation5] and [Citation6]. A pulsed value, operated at a repetition rate of 25 Hz, was used to generate a supersonic beam of NO with a mean longitudinal speed of . After passing through a 2-mm-diameter skimmer the molecules entered into a region enclosed by a 30 K heat shield that contained the decelerator. Prior to deceleration and electrostatic trapping the molecules were photoexcited, between electrodes E1 and E2, to long-lived high-n (n = 32 to 48) Rydberg states using the
two-colour two-photon excitation scheme. This was driven by the counter-propagating frequency-tripled and frequency-doubled outputs of two Nd:YAG-pumped pulsed dye lasers at wavenumbers
and
, respectively. Photoexcitation was implemented with
in two wavenumber ranges:
–
(
–
), and
–
(
–
) [
–
], to access the
and
levels of the intermediate
state, respectively. In each case,
was adjusted in the wavenumber range from
to
(
to
) [
–
] to excite high Rydberg states. For all experiments, a fibre-coupled wavelength meter was used to monitor and calibrate the vacuum wavelengths of the fundamental outputs of the dye lasers.
Figure 1. Schematic diagram of the chip-based Rydberg–Stark decelerator. The partially transparent electrode E2 is displaced vertically and to the right for clarity. Electrons and ions could be extracted through apertures A0, A1 and A2 in E2 and collected at MCP detectors following PFI. Note: Only one side electrode is labelled in the figure (see text for details).
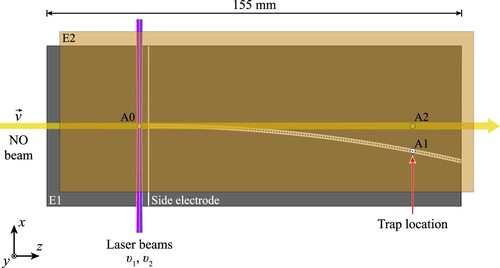
After photoexcitation, the molecules travelled for (corresponding to a distance of
) in the z-dimension before being loaded into a single travelling electric trap of the decelerator. The travelling traps, for molecules in low-field-seeking (LFS) Rydberg–Stark states with positive Stark energy shifts, were generated by applying a set of 5 sinusoidally oscillating potentials of amplitude
to the curved array of
square electrodes in Figure . A potential of
was applied simultaneously to the flat metal electrode E2 located parallel to, and 3 mm above this array in the y dimension. The potential on the side electrodes (ground planes of the segmented transmission line that forms the decelerator) was set to zero for deceleration and trapping. Deceleration of the molecules was achieved by decelerating the travelling traps in which they were confined from
to zero-mean-velocity in the laboratory-fixed frame of reference. This was implemented by chirping the frequency of the oscillating potentials from 160 to 0 kHz. The deceleration process took place over a distance of
, and in a time of
.
Detection of the trapped molecules was performed by pulsed electric field ionisation (PFI) in situ at the position of the stationary electrostatic trap within the decelerator structure [Citation20]. To implement this, the trapping potentials were switched off and a fast-rising potential of was applied to the side electrodes. NO
ions generated by ionisation of the Rydberg molecules in the resulting fields at the trap position, were then accelerated through the 2-mm-diameter aperture A1 in E2 and collected at a microchannel plate (MCP) detector. Rydberg state-selective electric field ionisation (SFI), could also be performed. This was carried out by applying a slowly-rising pulsed potential of the form
, where
, to the side electrodes, with the ionised electrons collected at the same MCP detector. In this case, the short flight time of the electrons to the MCP (
) allowed the ionisation and detection times of the molecules to be correlated with
at the time of ionisation. To aid in the optimisation and alignment of the apparatus, PFI could also be performed close to the laser photoexcitation region and on the molecular beam axis within the decelerator structure, with ion extraction through apertures A0 and A2, respectively.
2.2. Laser photoexcitation schemes
Rydberg states in NO were prepared using the resonance-enhanced two-colour two-photon excitation schemes depicted in Figure [Citation21–29]. Laser radiation at wavenumber,
, was used to drive transitions between the
ground state and either the
, or the
intermediate state. Spectra of these ground-to-intermediate state transitions were characterised by (1+1
) two-colour resonance-enhanced multi-photon ionisation (REMPI). By way of example, an
(1+1
) REMPI spectrum is shown in Figure . When recording these data the value of
was varied while
was set to
(
) to photoionise excited molecules. The transitions in this spectrum are labelled using the
notation where J is the total angular momentum quantum number [Citation26,Citation30]. The labels P, Q, and R correspond to
, 0, and
transitions. The subscripts
and
refer to the fine-structure of the of
and
states, respectively. All of the observed transitions are labelled with
because they originate from the lower,
, spin-orbit component of the ground state. In the
state,
and 2 correspond to the states for which
and
, with the same value of
. However, because the spin-orbit splitting in the
state is small,
[Citation31,Citation32], it was not resolved. The wavenumbers indicated by the labelled vertical bars in Figure were calculated using the electronic, vibrational, and rotational constants for the
and
states listed in Table [Citation33,Citation34]. A similar REMPI spectrum of the
transitions was reported in Ref. [Citation29]. From these measurements, the rotational temperature of the molecules in the supersonic beam was estimate to be
K.
Figure 2. Resonance-enhanced two-colour two-photon excitation schemes used to prepare Rydberg states in NO converging to the (a) , and (b)
vibrational states in the X
ground electronic state of NO
. Low-lying n = 7 Rydberg states with
and 2 are also included in each panel. All energies are displayed with respect to the energy of the
,
Rydberg series limit.
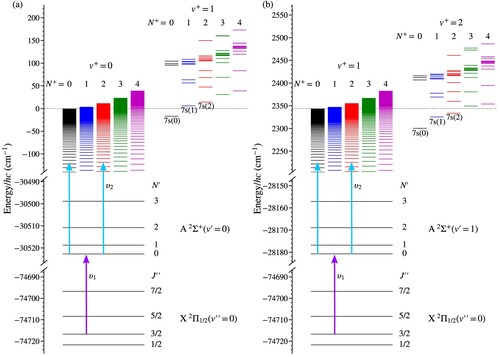
Figure 3. Two-colour (1+1) REMPI spectrum of the
transitions in NO.
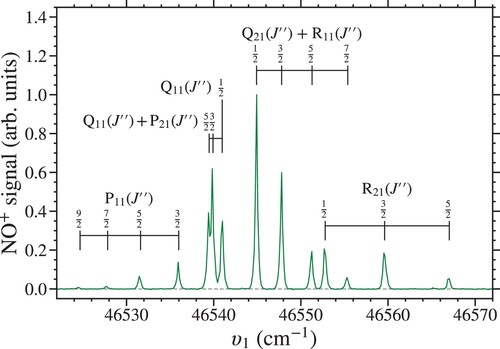
Table 1. Electronic, vibrational, and rotational constants of the and
states in
N
O.
The state in NO is a low-lying Rydberg state. It, therefore, has a similar potential energy curve to the high-n Rydberg states, and the ground electronic state of NO
. Consequently, the Franck–Condon principle results in a propensity for
transitions from the intermediate A state to the high Rydberg states upon laser photoexcitation. Excitation to the
state with
or 1, therefore, allowed access to high Rydberg states converging to the
or 1 states in the ground electronic state of NO
, respectively.
For all the measurements described here, was either set to
(
), or
(
) to populate the
, or
vibrational states in the
intermediate state on the
resonance. In each case, the value of
, was adjusted to excite optically accessible
and
Rydberg states, with values of n in the range from 32 to 48. Long-lived ℓ-mixed Rydberg–Stark states were populated by ℓ- and
-mixing that occurred in weak time-varying electric fields close to the time of photoexcitation [Citation29,Citation35,Citation36].
3. Results and discussion
3.1. Laser spectroscopy
To determine the range of values of n, and , of the Rydberg states in NO that could be decelerated and electrostatically trapped, laser photoexcitation spectra were recorded with selective detection of molecules that were successfully trapped. To achieve this, PFI was performed after a trapping time of
with the resulting spectra presented in Figure . All of the resonances in this figure correspond to the excitation of Rydberg states in series for which
and represent resonances on which optically accessible
or
character is mixed into near degenerate long-lived Rydberg–Stark states. Spectra recorded for
and 100 V are displayed in Figure (b ,c), respectively. The relative intensities of the features in these spectra reflect the combined effects of the efficiency with which long-lived LFS Rydberg–Stark states were populated at excitation, the deceleration and trap loading efficiency, and the lifetimes of the Rydberg states. Comparable spectra for Rydberg states with
were reported in Ref. [Citation6].
Figure 4. Spectra of long-lived Rydberg states in NO recorded by PFI after deceleration and electrostatic trapping for
with
. When recording the data in spectrum (ii) the amplitude of the deceleration/trapping potentials was
, and (iii
. The upper part (i) of the figure, contains electron time-of-flight distributions recorded by SFI with the ionisation potential
indicated on the top right. These data were recorded for
, with
and excitation on the resonances indicated in (ii). The red horizontal line within each panel denotes the intensity maximum determined by fitting an exponentially modified normal distribution to each dataset.
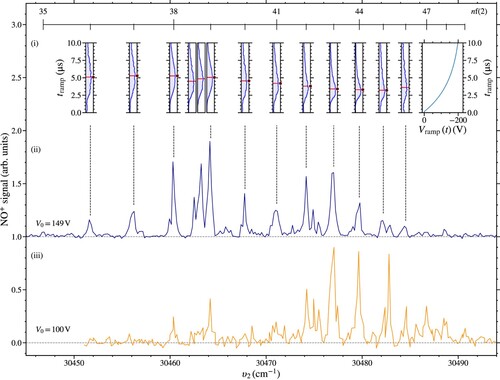
The transitions with maximal spectral intensity occur in Figure for higher values of n when , the amplitude of the deceleration/trapping potentials, is reduced to 100 V. For a given value of
, i.e., a particular depth of the electric field minima in the travelling electric traps, the optimal range of values of n for which declaration and trapping can be achieved is determined by the Rydberg state electric dipole moments and ionisation electric fields. For lower values of n, the deceleration and trapping efficiency is reduced because of the
dependence of the maximal static electric dipole moments of the Rydberg states, and therefore the maximal force that can exerted on the molecules. On the other hand, the
dependence of the threshold ionisation electric field for high Rydberg states [Citation29,Citation37,Citation38] results in a reduction in the deceleration and trapping efficiency for higher values of n. This is because, during the deceleration and trap loading process, molecules in higher n states are more likely to ionise, and the phase-space acceptance of the travelling electric traps for these states reduces. From numerical particle trajectory calculations, it was determined that the lower threshold for electric field ionisation of higher-n Rydberg states does not result in a significant increase in field ionisation after the traps are brought to rest.
Transitions to Rydberg states dominate the spectra in Figure because of the comparatively small nf quantum defects of
in NO, and therefore the close proximity of these states to long-lived higher-ℓ
states, where
refers to the ℓ-mixed hydrogenic Stark states. However, ℓ- and
-mixing involving optically accessible
states can also lead to the population of
and
Stark states. In these cases
states are populated as a result of direct electric field-induced mixing with
states.
Stark states, for which
, are populated in situations where mixing with near degenerate
and
states occurs because of intramolecular charge-dipole interactions, combined with electric-field–induced mixing of
character into the
states [Citation39,Citation40]. The measurements of trap decay rates reported here focus primarily on
Stark states excited on the
resonances indicated by the horizontal bar across the top of Figure .
In addition to standard laser photoexcitation spectra, SFI of the Rydberg molecules was performed after deceleration and trapping for with
[separated panels in Figure (a)]. This detection methodology allowed changes in the ionisation fields of the molecules in states with different values of n to be identified. These measurements were made by applying the slowly-rising potential,
, in the right-hand panel of Figure (a) to the side electrodes after switching off the deceleration and trapping potentials. Normalised electron time-of-flight (TOF) distributions recorded by SFI following excitation on the resonances with values of n between 36 and 46 are displayed across the left part of Figure (a). The location of the maximum in each time-of-flight distribution, as determined by fitting an exponentially modified normal distribution, is denoted by a red marker. The widths of the distributions in the time domain reflect (1) the distribution of Rydberg–Stark states populated at the time of SFI, (2) the inhomogeneity of the ionisation fields within the decelerator structure, and (3) the motion of the molecules during SFI.
In general for the nf resonances, the maxima in the electron TOF distributions in Figure (a) occur at earlier times as the value of n increases. This reflects the
scaling of the threshold ionisation electric field [Citation41]. SFI measurements performed following excitation on the resonances at
and
, i.e., the two resonances between the 38f(2) and 39f(2) features, aided in the characterisation of these states. The maxima in the electron TOF distributions in both of these cases occur at earlier times (4.5 and
, respectively) than those associated with these nf(2) resonances. Therefore the molecules excited on these resonances ionise in lower electric fields. This suggests excitation into states with values of n>39. These states must therefore have values of
, and the higher wavenumber feature at
must have a lower value of n than the lower one. From the calculated energy-level structure of the Rydberg states, these resonances were attributed to the population of
and
Rydberg–Stark states, respectively.
3.2. Trap decay rates
Measurements of the decay of the electrostatically trapped Rydberg NO molecules were performed in a similar way to those described in Ref. [Citation6]. After laser photoexcitation to Rydberg states with or 1, the molecules were decelerated and electrostatically trapped. The integrated NO
ion signal, recorded after PFI of the trapped molecules was then measured for values of
up to 1 ms. Trap decay time constants,
, were then obtained by fitting single exponential functions to these data between
and
. The corresponding results are presented in Figure . Each data point in this figure corresponds to the weighted mean of up to 15 separate measurements of
. The error bars represent the uncertainties on these mean values.
Figure 5. Measured trap decay time constants, , for
Rydberg states converging to the
(filled red circles – previously reported in Ref. [Citation6]), and
(open blue diamonds) states in the ground electronic state of NO
. For all measurements
.
![Figure 5. Measured trap decay time constants, τdecay, for n(2) Rydberg states converging to the v+=0 (filled red circles – previously reported in Ref. [Citation6]), and v+=1 (open blue diamonds) states in the ground electronic state of NO+. For all measurements V0=149V.](/cms/asset/9d07b8ac-242d-43bc-b112-54e394dffcc3/tmph_a_2160846_f0005_oc.jpg)
In Figure , the measured values of for
Rydberg states with
(filled red circles – previously presented in Ref. [Citation6]) and
(open blue diamonds), are shown for n = 32−48. All measurements were performed for
. The general trend seen in these data is that as the value of n is increased,
decreases. This dependence is seen for the
states in both the
and
series and was previously observed for
and
states with
[Citation6]. The measured values of
, for states with
and 1 agree within the measurement uncertainties. For example, in the case of the
states
when
, and
when
. For individual states in both series, deviations from the general trend are observed. These occur, for example, on the
resonance where the measured values of
are larger than expected from the surrounding states.
The trap decay times, , in Figure , do not follow the
-scaling expected for the lifetimes of ℓ-mixed Rydberg–Stark states in atoms [Citation41]. The general trend in the measured values of
, and the deviations from this trend result from weak intramolecular interactions [Citation6]. Because of the carefully controlled experimental conditions, contributions from collisions (the number density of the trapped molecules is
cm
) and blackbody-induced transitions (the trap environment is maintained at
K) can be ruled out as playing a significant role. To investigate the effect of electric field ionisation on the decay of trapped molecules, numerical particle trajectory calculations, that included a Monte-Carlo treatment of the electric field ionisation process, were performed. These indicated that electric field ionisation contributes
Hz to the decay rate from the traps for the values of n studied here.
The general decrease in the values of with increasing n arises because of weak vibrational channel interactions. These interactions occur between
(
) high-n Rydberg states, and short-lived n = 7 states with
(
). As seen in Figure , the n = 7 states with
(
) lie energetically above, but close to, the
,
(
) Rydberg series limit. Previous spectroscopic studies of low-n Rydberg states in NO with
concluded that their lifetimes are dominated by fast non-radiative decay, and that the n = 7,
states in particular have lifetimes of
ps [Citation25,Citation27]. Consequently, a contribution of 1 part in
of n = 7,
character admixed into the
Rydberg–Stark states increases their decay rate by
kHz. This amount of mixing is consistent with that expected from a simple two-state quantum-mechanical model. It is also comparable to the calculated fluorescence decay rates of these long-lived Rydberg states [Citation6].
In the data in Figure , the values of for the
Rydberg states with
and 1 are similar, and in both cases decrease as n increases. This leads to the conclusion that a comparable amount of mixing occurs between the
states with
and the n = 7,
states, to that encountered for the
Rydberg states. As seen in Figure , the n = 7,
and 2 states lie in similar energetic positions with respect to the
,
and 1 states, respectively, which is consistent with similar contributions from vibrational channel interactions in both cases.
For several of the resonances in Figure , deviations from the general trend exhibited by the data are seen for states with
and 1. In each of these cases, because of accidental near degeneracies, Rydberg–Stark states with more than one set of values of n and
are simultaneously populated upon photoexcitation, decelerated and trapped. For the
states, these near degeneracies are discussed in Ref. [Citation6]. For
, the main deviation from the general trend is seen on the
resonance. In this instance, molecules in
and
Rydberg–Stark states are simultaneously confined in the trap following photoexcitation on the
resonance. The
Rydberg–Stark states are populated because of electric-field-induced mixing with the optically accessible
states. Charge-quadrupole interactions, that couple states for which
and
, also mix
character into the near degenerate
state, which, in the presence of weak stray electric fields mix further with the
Stark states. Since the
Stark states decay more slowly from the trap than the
states – because of their lower value of
and higher value of n – simultaneously trapping molecules in both states results in a value of
that is longer than for surrounding states in the
series.
3.3. Deceleration and trapping field strengths
The dependence of on the strength of the trapping fields was investigated by comparing measurements for
states with
made with
[open blue diamonds] and
[filled orange squares] as presented in Figure . No measurement of
was made for the
state with
because the signal was insufficient. In general, for both values of
,
decreases with increasing n. However, the values of
for
are in many instances greater than those for
. Although, for excitation on the
and
resonances the opposite behaviour is seen.
Figure 6. Measured trap decay time constants, , for
Rydberg states with
. The data were recorded for
(open blue diamonds), and
(filled orange squares).
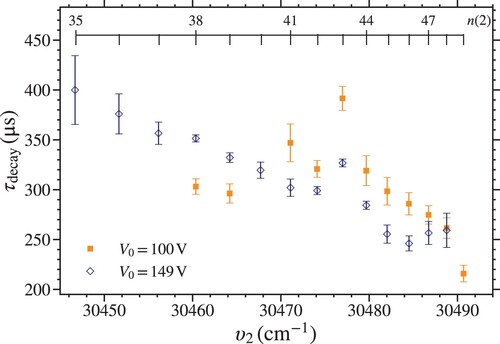
The measurements in Figure demonstrate the persistence of the vibrational channel interactions that cause the general reduction in the measured values of with increasing n at lower trap depths. The slight increase in
for values of n between 41 and 48 when
V, compared to that for
V, reflects the lower time-averaged field strength experienced by the trapped molecules. This lower field results in reduced Stark shifts, by a factor of
, of the trapped molecules. Since the Stark shifts of the LFS Stark states suitable for trapping are positive, reducing them leads to an increase in the average energy separation from the short-lived n = 7 states with
which do not shift appreciably in the trapping fields. As a result, the amount of mixing with these states that occured is slightly reduced and the trap decay times are longer.
The deviation of the value of for the
resonance in Figure , from the general trend exhibited by the surrounding states, is more pronounced when
V than when
V. This is because the difference in the deceleration and trapping efficiency for the
and
Stark states excited on this resonance is more pronounced for lower values of
. Consequently, the fraction of trapped molecules in the longer-lived
states is greater under these conditions and
increases.
Finally, the values of decrease on the
and
resonances when
is reduced to 100 V. This is attributed to a change in the distribution of Stark states populated in the trap. For lower trap potentials, states with smaller dipole moments are trapped less efficiently than those with larger dipole moments. Therefore, for a given value of n, a smaller range of Stark states will be efficiently trapped when
, than when
. The changes in these measured values of
reflect differences in the lifetimes of individual components within a manifold of ℓ-mixed Rydberg–Stark states, and in particular the fact that the outermost Stark states with the largest static electric dipole moments generally exhibit the shortest of these lifetimes.
3.4. Vibrational autoionisation
Because the Rydberg–Stark states with lie above the
series limit, they can decay by vibrational autoionisation. Spontaneous emission from these states, and predissociation are expected to contribute in a similar way to the total decay rates of
Stark states with both
and 1. Therefore, a comparison of the values of
for states in these two Rydberg series allows the effects of vibrational autoionisation on the decay of the long-lived
Rydberg–Stark states in the trap to be inferred. Because the values of
for the
and 1 states agree to within the experimental uncertainties, it is concluded that vibrational autoionisation does not play a significant role in the decay of the trapped molecules when
. An upper bound on the rate of vibrational autoionisation of these states,
, can be obtained by considering the contribution required for
to change by twice the measurement uncertainty. This suggests that for n = 38,
.
Studies reported previously of the decay dynamics of Rydberg states in NO with values of , included detailed analyses of the effects of vibrational autoionisation [Citation25,Citation27,Citation42–44]. In these works, it was shown that these low-ℓ Rydberg states with
and 1 decay predominantly by fast non-radiative processes. However, in contrast to the
states, for which predissociation is the dominant decay pathway, the
Rydberg states predissociate and autoionise. Recent measurements of the decay rates of
Rydberg states with
and n = 22, 25, and 28, yielded total decay rates proportional to
(
averaged over all rotations and sub-states, i.e.
at n = 28) [Citation44]. Calculations of the autoionisation rates, using a long-range potential model [Citation44,Citation45], indicated that
of the total decay rate of these states could be attributed to autoionisation, with the remaining
associated with predissociation. This is in line with previously measured predissociation rates of
states with
[Citation42]. For all of the short-lived states studied in these works, the spontaneous emission rates were approximately three orders of magnitude lower than the autoionisation rates.
To connect these previous results to the measurements reported here for long-lived, ℓ-mixed Rydberg–Stark states, the vibrational autoionisation rates predicted by the long-range potential model were extrapolated to higher values of ℓ [Citation44,Citation45]. This allowed a rough estimate of the order of magnitude of the n- and ℓ-dependent vibrational autoionisation rates, , given by
(1)
(1) From this expression, it is determined that the vibrational autoionisation rates of n = 38 Rydberg states with values of ℓ between 4 and 12 may be expected to lie between
and
. The spontaneous emission rates of these same states are between 10 and
.
The molecules that were successfully decelerated and trapped in the experiments reported here were those in outer LFS Rydberg–Stark states. Calculations of the vibrational autoionisation rates of these states, for n = 38 and , and in Stark manifolds with
, 5, and 6 (in an atom these would correspond to
, 5, and 6 manifolds, respectively) were therefore made to aid in the interpretation of the experimental data. In these calculations, the vibrational autoionisation rate of a Stark state
was determined by decomposing it into Hund's-case-(d) basis states
, such that
(2)
(2) where
are the coefficients of the corresponding eigenvector in the electric field,
. These coefficients were calculated by the matrix diagonalisation methods described in Ref. [Citation6]. The typical time-averaged electric field strength of
, experienced by the molecules as they moved within the traps was determined through numerical particle trajectory calculations, and used in the calculations. By accounting for the n- and ℓ-dependence of
using the expression in Equation (Equation1
(1)
(1) ), the vibrational autoionisation rates obtained for the outermost LFS Stark states with
, 5, and 6 were
,
, and
, respectively. These rates are all an order of magnitude, or more, larger than the experimentally determined bound of
.
To obtain further insight into the link between the experimental data and these crude order of magnitude estimates, the vibrational autoionisation rates of the field-free Rydberg states were considered more generally to have the form
(3)
(3) where A and p are adjustable parameters. To explore the range of values of A and p that could result in Rydberg–Stark state vibrational autoionisation rates
, these parameters were constrained to ensure that
was equal to the values reported recently for Rydberg states with
in Ref. [Citation44]. This was achieved by adjusting the value of A for each value of p. For these tests the value of p was chosen to lie between 6 and 18 because the intramolecular charge-dipole, charge-quadrupole, and charge-induced-dipole interactions scale with
,
, and
, respectively [Citation40]. And, considering Fermi's Golden Rule, the corresponding vibrational autoionisation rates would depend on the square of these quantities.
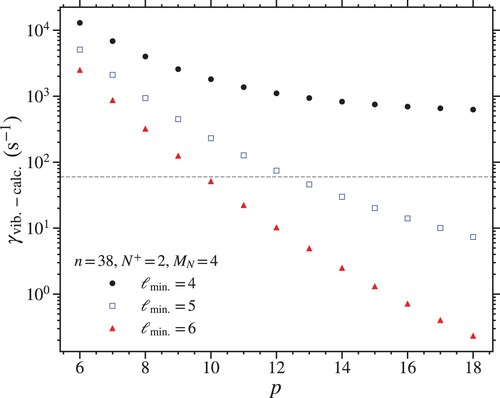
The calculated values of for the outermost LFS Stark states with n = 38 and
in manifolds with
, 5, and 6 are shown in Figure . From these data, it is seen that when
,
converges to
as the value of p is increased. This represents the field-free
vibrational autoionisation rate for this value of n. Because the experimental bound on the vibrational autoionisation rates in the work reported here (dashed horizontal line) lies below
for all values of p under these conditions, it is concluded that the Rydberg states of the decelerated and trapped molecules cannot possess any
character. For
and 6, the calculated vibrational autoionisation rates do reduce below
for
, and 10, respectively. In both of these cases, the fluorescence rates of the field-free Rydberg states exceed the vibrational autoionisation rates for
. The ℓ-scaling suggested by these observations is stronger than that in Equation (Equation1
(1)
(1) ). However, because even crude estimates of the kind outlined here of vibrational autoionisation rates of ℓ-mixed Rydberg–Stark states are very sensitive to the vibrational autoionisation rates of the field-free low-ℓ states, a more precise interpretation of the experimental results will require more accurate values of the vibrational autoionisation rates of the field-free Rydberg states with
.
Figure 7. Calculated vibrational autoionisation rates of the outermost LFS Stark states with n = 38 and in manifolds for which the minimum ℓ character considered was
(black circles), 5 (open blue squares), and 6 (red triangles) (see text for details).
4. Conclusions
The experiments reported here represent the first in which Rydberg molecules have been decelerated and electrostatically trapped in vibrationally excited states. The measured trap decay time constants exhibit a similar general reduction as the value of n is increased, to those for Rydberg–Stark states studied previously. This behaviour is attributed to the effects of vibrational channel interactions that couple long-lived high-n Rydberg states with a given value of
, to short-lived n = 7 states with
. Comparison of the decay rates of the trapped vibrationally excited Rydberg molecules, with those for samples in states converging to the ground vibrational state of the NO
ion core, has allowed bounds to be placed on the rates of vibrational autoionisation of the ℓ-mixed Rydberg–Stark states. A crude numerical analysis based on extrapolation of vibrational autoionisation rates of low-ℓ Rydberg states to the states of interest here with higher values of ℓ, leads to the conclusion that the minimum-ℓ character of the Stark states of the trapped molecules must be
. Therefore, the minimum value of
must at least fulfil the condition that
. A more detailed interpretation of these results will benefit from experiments performed with molecules decelerated and trapped in individual Rydberg–Stark states with selected values of
. This could be achieved by combining high-resolution laser photoexcitation with population transfer between Stark states driven by microwave or millimetre-wave radiation. A more complete theoretical treatment of the Stark effect in the Rydberg states of NO that combines, for example, multichannel quantum defect theory with input from experiments and the results of quantum chemical calculations to allow links to be made between channel interactions and the interactions of the Rydberg electron with the multipole moments of the ion core, will also be of great value.
Acknowledgments
We are grateful to Prof R. W. Field (MIT) and Prof T. Barnum (Union College, New York) for valuable discussions relating to vibrational autoionisation of Rydberg states in NO.
Disclosure statement
No potential conflict of interest was reported by the author(s).
Additional information
Funding
References
- C. Seiler, S.D. Hogan, H. Schmutz, J.A. Agner and F. Merkt, Phys. Rev. Lett. 106, 073003 (2011). doi:10.1103/PhysRevLett.106.073003
- C. Seiler, Ph. D. thesis, ETH Zurich, 2013.
- C. Seiler, J.A. Agner, P. Pillet and F. Merkt, Mol. Opt. Phys 49, 094006 (2016). doi:10.1088/0953-4075/49/9/094006
- V. Zhelyazkova, M. Žeško, H. Schmutz, J.A. Agner and F. Merkt, Mol. Phys. 117, 2980 (2019). doi:10.1080/00268976.2019.1600060
- A. Deller, M.H. Rayment and S.D. Hogan, Phys. Rev. Lett. 125, 73201 (2020). doi:10.1103/PhysRevLett.125.073201
- M.H. Rayment and S.D. Hogan, Phys. Chem. Chem. Phys. 23, 18806 (2021). doi:10.1039/D1CP01930A
- V. Zhelyazkova and S.D. Hogan, Phys. Rev. A 95, 042710 (2017). doi:10.1103/PhysRevA.95.042710
- F. Jarisch and M. Zeppenfeld, N. J. Phys. 20, 113044 (2018). doi:10.1088/1367-2630/aaf02e
- K. Gawlas and S.D. Hogan, J. Phys. Chem. Lett. 11, 83 (2020). doi:10.1021/acs.jpclett.9b03290
- P. Allmendinger, J. Deiglmayr, K. Höveler, O. Schullian and F. Merkt, J. Chem. Phys. 145, 244316 (2016). doi:10.1063/1.4972130
- V. Zhelyazkova, F.B.V. Martins, J.A. Agner, H. Schmutz and F. Merkt, Phys. Rev. Lett. 125, 263401 (2020). doi:10.1103/PhysRevLett.125.263401
- F. Merkt, K. Höveler and J. Deiglmayr, J. Phys. Chem. Lett. 13, 864 (2022). doi:10.1021/acs.jpclett.1c03374
- W.H. Wing, Phys. Rev. Lett. 45, 631 (1980). doi:10.1103/PhysRevLett.45.631
- T. Breeden and H. Metcalf, Phys. Rev. Lett. 47, 1726 (1981). doi:10.1103/PhysRevLett.47.1726
- E. Vliegen, H.J. Wörner, T.P. Softley and F. Merkt, Phys. Rev. Lett. 92, 033005 (2004). doi:10.1103/PhysRevLett.92.033005
- Y. Yamakita, S.R. Procter, A.L. Goodgame, T.P. Softley and F. Merkt, J. Chem. Phys. 121, 1419 (2004). doi:10.1063/1.1763146
- S.D. Hogan, EPJ Techn. Instrum. 3, (2016). doi:10.1140/epjti/s40485-015-0028-4
- S.D. Hogan, P. Allmendinger, H. Saßmannshausen, H. Schmutz and F. Merkt, Phys. Rev. Lett. 108, 063008 (2012). doi:10.1103/PhysRevLett.108.063008
- P. Lancuba and S.D. Hogan, Phys. Rev. A 90, 053420 (2014). doi:10.1103/PhysRevA.90.053420
- P. Lancuba and S.D. Hogan, Mol. Opt. Phys. 49, 074006 (2016). doi:10.1088/0953-4075/49/7/074006
- T. Ebata, Y. Anezaki, M. Fujii, N. Mikami and M. Ito, J. Phys. Chem. 87, 4773 (1983). doi:10.1021/j150642a001
- M. Seaver, W.A. Chupka, S.D. Colson and D. Gauyacq, J. Phys. Chem. 87, 2226 (1983). doi:10.1021/j100235a036
- D.T. Biernacki, S.D. Colson and E.E. Eyler, J. Chem. Phys. 88, 2099 (1988). doi:10.1063/1.454091
- D.T. Biernacki, S.D. Colson and E.E. Eyler, J. Chem. Phys. 89, 2599 (1988). doi:10.1063/1.455008
- A. Fujii and N. Morita, J. Chem. Phys. 97, 327 (1992). doi:10.1063/1.463631
- E.F. McCormack, F. Di Teodoro, J.M. Grochocinski and S.T. Pratt, J. Chem. Phys. 109, 63 (1998). doi:10.1063/1.476540
- A.L. Goodgame, H. Dickinson, S.R. Mackenzie and T.P. Softley, J. Chem. Phys. 116, 4922 (2002). doi:10.1063/1.1450552
- R. Patel, N.J. Jones and H.H. Fielding, J. Phys. B 40, 1369 (2007). doi:10.1088/0953-4075/40/7/006
- A. Deller and S.D. Hogan, J. Chem. Phys. 152, 144305 (2020). doi:10.1063/5.0003092
- J.M. Brown, J.T. Hougen, K.P. Huber, J.W. Johns, I. Kopp, H. Lefebvre-Brion, A.J. Merer, D.A. Ramsay, J. Rostas and R.N. Zare, J. Mol. Spectrosc. 55, 500 (1975). doi:10.1016/0022-2852(75)90291-X
- T. Bergeman and R.N. Zare, J. Chem. Phys. 61, 4500 (1974). doi:10.1063/1.1681767
- J.A. Gray, R.L. Farrow, J.L. Durant and L.R. Thorne, J. Chem. Phys. 99, 4327 (1993). doi:10.1063/1.466086
- K.P. Huber and G. Herzberg, Molecular Spectra and Molecular Structure: IV. Constants of Diatomic Molecules (Springer, Boston (MA), 1979).
- M. Sharma, J.M. Austin, N.G. Glumac and L. Massa, AIAA J. 48, 1434 (2010). doi:10.2514/1.J050047
- W.A. Chupka, J. Chem. Phys. 98, 4520 (1993). doi:10.1063/1.465011
- F. Merkt and R.N. Zare, J. Chem. Phys. 101, 3495 (1994). doi:10.1063/1.467534
- M.G. Littman, M.M. Kash and D. Kleppner, Phys. Rev. Lett. 41, 103 (1978). doi:10.1103/PhysRevLett.41.103
- R.J. Damburg and V.V. Kolosov, J. Phys. B 12, 2637 (1979). doi:10.1088/0022-3700/12/16/011
- M. Bixon and J. Jortner, J. Chem. Phys. 105, 1363 (1996). doi:10.1063/1.472033
- M. Bixon and J. Jortner, Mol. Phys. 89, 373 (1996). doi:10.1080/002689796173787
- T.F. Gallagher, Rydberg Atoms (Cambridge University Press, Cambridge (UK), 1994).
- A. Fujii and N. Morita, J. Chem. Phys. 103, 6029 (1995). doi:10.1063/1.470431
- R.S. Minns, D.T. Lazenby, F.H. Hall, N.J. Jones, R. Patel and H.H. Fielding, Mol. Phys. 112, 1808 (2014). doi:10.1080/00268976.2013.865809
- T.J. Barnum, G. Clausen, J. Jiang, S.L. Coy and R.W. Field, J. Chem. Phys. 155, 244303 (2021). doi:10.1063/5.0070879
- E.E. Eyler, Phys. Rev. A 34, 2881 (1986). doi:10.1103/PhysRevA.34.2881