
 ?Mathematical formulae have been encoded as MathML and are displayed in this HTML version using MathJax in order to improve their display. Uncheck the box to turn MathJax off. This feature requires Javascript. Click on a formula to zoom.
Abstract
Submolecular resolution scanning tunnelling microscopy and qPlus atomic force microscopy reveal that, close to thermal equilibrium, bi-isonicotinic acid (4,4'-COOH-2,2'-bpy) assembles into extended molecular rows on both Au(111) and Ag(100) surfaces, driven primarily by the formation of OH··· N hydrogen bonds. Both the intermolecular separation and inter-row spacing for Au(111) and Ag(100) are identical within experimental uncertainty, highlighting that the assembly of bi-isonicotinic acid networks on both metal surfaces is predominantly driven by intermolecular hydrogen-bonding and that the potential energy variation due to the substrate has relatively little influence. Nonetheless, the surface plays a key role in molecular organisation: symmetry-breaking induces prochiral behaviour, which drives the molecular enantiomers to form a racemic mixture of rows of different handedness. We adapt a tiling model previously introduced to model the formation of 2D networks of tetracarboxylic derivatives [Blunt et al. Science 322, 1077 (2008)] to the bi-isonicotinic acid system, providing key insights into the growth kinetics and attaining good agreement with the molecular morphologies observed in experiment.
GRAPHICAL ABSTRACT
1. Introduction
Symmetry is an essential aspect of the physical sciences [Citation1]. Phase changes during the evolution of the early universe, the pivotal role of group theory in chemistry, and the conservation of energy and momentum via Noether's remarkable theorem [Citation2] are all key examples of just how symmetries form the bedrock of our understanding of countless systems in nature. In the context of molecular physics, and, more specifically, in the field of molecule-surface interactions, adsorption of an otherwise achiral species is a simple and effective method of breaking mirror-symmetry, giving rise to adsorbed phases and superstructure whose ordering has a pronounced handedness [Citation3]. This induced chiral behaviour, arising only from the reduced symmetry imposed by a surface and generally known as prochirality, has driven a significant research effort in the surface science and nanoscience communities (see [Citation4–6] for particularly helpful reviews), especially with regard to its relationship to hydrogen-bonding in adsorbed molecular, and supramolecular, assemblies.
The molecule on which we focus in this paper, bi-isonicotinic acid (4,4'-COOH-2,2'-bpy, Figure (a)), is not only a prototypical prochiral species but a key component of the ruthenium dye known as ‘N3’ or Ru535 – in full, cis-bis(isothiocyanato) bis(2,2'-bipyridyl-4,4'-dicarboxylic acid) ruthenium(II) – that is in turn at the heart of many model dye-sensitised solar cell systems [Citation7]. These include the highly influential Grätzel architecture [Citation8]. The N3 ruthenium complex bonds to oxide surfaces such as TiO – the substrate used in the Grätzel cell (in a nanostructured form) – via the carboxyl groups of the bi-isonicotinic acid ligands. Charge transfer will therefore be strongly mediated by the adsorption, conformation, and intermolecular interactions of the tethered bi-isonicotinic acid groups. There has thus been a series of studies focussed on the adsorption of bi-isonicotinic acid on a variety of surfaces (with an unsurprising emphasis on TiO
), and in bulk, or thin film, form [Citation9–11]. In particular, one of the authors (JNOS) and co-workers have carried out extensive photoemission, X-ray absorption spectroscopy, and, more recently, resonant inelastic X-ray scattering (RIXS) measurements of not just bi-isonicotinic acid (sub)monolayers and thin films on metal and oxide substrates, but of the entire adsorbed N3 complex [Citation12–14]. Although aggregates of N3 on Au(111) have been imaged using scanning tunnelling microscopy (STM) [Citation15], scanning probe microscopy measurements of bi-isonicotinic acid assemblies have been lacking to date.
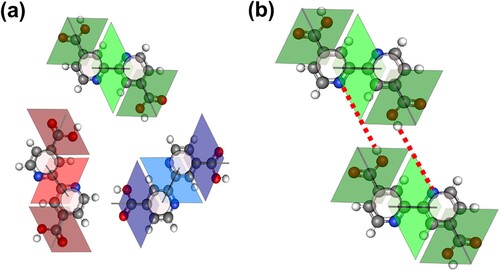
Figure 1. (a) Ball-and-stick model of bi-isonicotinic acid with the primary OH··· N hydrogen-bonds shown as dotted lines. (Grey: C, white: H, red: O, blue: N); (b) Constant height qPlus AFM image acquired at 4.5 K (with a CO-functionalised tip) of rows of hydrogen-bonded bi-isonicotinic acid molecules on Au(111). Scale bar: 1 nm. Oscillation amplitude: 200 pm (± 20 pm). (c) Simulated AFM image using the Hapala et al. [Citation21] probe particle model.
![Figure 1. (a) Ball-and-stick model of bi-isonicotinic acid with the primary OH··· N hydrogen-bonds shown as dotted lines. (Grey: C, white: H, red: O, blue: N); (b) Constant height qPlus AFM image acquired at 4.5 K (with a CO-functionalised tip) of rows of hydrogen-bonded bi-isonicotinic acid molecules on Au(111). Scale bar: 1 nm. Oscillation amplitude: 200 pm (± 20 pm). (c) Simulated AFM image using the Hapala et al. [Citation21] probe particle model.](/cms/asset/740dc285-b7d4-42d0-bb53-650b0a6896b7/tmph_a_2192824_f0001_oc.jpg)
Here we discuss the results of submolecular resolution STM and atomic force microscopy (AFM) imaging of bi-isonicotinic acid assemblies on Au(111) and Ag(100). We prepared submonolayer molecular coverages on two surfaces with very different symmetries and electronic structures in order to ascertain the relative influence of molecule-substrate vs intermolecular interactions. Near to thermal equilibrium, the molecular organisation we observe is influenced very little by the underlying surface structure (although dI/dV maps provide evidence of an intriguing enantiomer-dependent interaction). Moreover, our data not only provide the first real space, (sub)molecular resolution confirmation of the hydrogen-bonding mechanism that has been hypothesised for 2D bi-isonicotinic acid assemblies [Citation12,Citation13], but we rationalise the strong dependence of photoemission and X-ray absorption spectra on the kinetics of the bi-isonicotinic acid deposition process [Citation16]. In order to explore the self-assembly kinetics in more detail, we have adapted the random tiling approach used to model spatial correlations in 2D networks of tetracarboxylic acid derivatives (and related systems) [Citation17,Citation18]. Monte Carlo simulations based on the tiling model are interpreted and classified on the basis of a preference score for OH··· N hydrogen bonds, and are in good agreement with our experimental observations.
2. Materials & methods
Bi-isonicotinic acid (Figure (a)) was deposited from a Knudsen cell, operating at a temperature of , onto a Au(111) or Ag(100) surface cleaned in ultrahigh vacuum (UHV) using standard sputter-anneal cycles. Two low temperature (LT, ∼ 5 K) UHV scanning probe microscope systems, namely a ScientaOmicron LT STM-AFM and a Createc STM-AFM, were used to image and spectroscopically probe the molecular assemblies at low temperatures, whereas a ScientaOmicron variable temperature STM-AFM was used for both deposition and imaging at room temperature (i.e. molecular adsorption onto a substrate at ambient (293 (
) K) temperature). Both low temperature probe microscopes were equipped with a qPlus sensor [Citation19] for high resolution dynamic force microscopy (also known as non-contact (NC) AFM.
In order to resolve intramolecular structure, we followed the traditional published recipesFootnote1 for functionalisation of the tip apex with a CO molecule [Citation20]. Differential conductivity (dI/dV) images were acquired at constant height using the conventional lock-in amplification technique by applying a modulation voltage of between 10 and 50 mV amplitude at a frequency of ∼ 1 kHz. To better interpret our submolecular resolution qPlus-AFM images of bi-isonicotinic acid assemblies, we used the approach introduced by Hapala et al. [Citation21] whereby the tip is modelled as a flexible ‘probe particle’ that interacts with the potential energy landscape associated with the adsorbed molecules. Electrostatic forces were not included in the simulation.
3. Results
The hydrogen-bond motif underpinning the self-assembly of bi-isonicotinic acid on both Au(111) and Ag(100) is shown in Figure (a). As previously suggested in the context of the interpretation of X-ray photoelectron and X-ray absorption spectra [Citation12,Citation13], the intermolecular interactions in an adsorbed (sub)monolayer of bi-isonicotinic acid on metal surfaces are driven by O-H ··· N hydrogen bonds, which lead to the formation of extended chains of molecules. In high-resolution qPlus AFM images acquired with a CO-functionalised tip the pyridine rings and carboxyl groups of the adsorbed bi-isonicotinic acid are clearly resolved and a simple ball-and-stick model of the molecule can be overlaid to highlight the location of the primary OH··· N hydrogen bonds (Figure (b)). It is worth mentioning that our AFM and STM data confirm the ‘flat-lying’ adsorption geometry for bi-isonicotinc acid on Au(111) that was previously put forward on the basis of near-edge X-ray absorption fine structure spectroscopy (NEXAFS) [Citation12] measurements. There is, however, some ambiguity with regard to the orientation of the carboxyl groups – these are almost certainly free to rotate during adsorption. The orientation we have chosen in Figure (b) ensures closer placement of the -OH group to the nitrogen of its neighbouring pyridine ring, in line with the greater propensity of pyridinyl N to act as a hydrogen-bonding acceptor [Citation22].
We also note that the vast majority (∼99%) of bi-isonicotinic acid molecules we imaged were in a trans conformational state. Although cis conformers were found with higher frequency at step edges on the Au(111) surface, with some evidence for the influence of Au adatoms on molecular organisation near steps, their fraction of occurrence away from step edges was extremely small.
Along hydrogen-bonded rows on Au(111), the molecules have a mean separation of 7.6 (± 0.2) Å(excluding areas of local disorder where OH··· N hydrogen bonds are disrupted (see below)), whereas the inter-row separation is 11.5 (± 0.2) Å. On Ag(100) (see inset to Figure (a)) we find intermolecular and inter-row spacings of 7.5 (± 0.2) Åand 11.3 (± 0.2) Å, respectively. In other words, these values are identical, within experimental uncertaintyFootnote2 to their counterparts on Au(111). That bi-isonicotinic acid forms the same 2D superstructure, with very similar intermolecular and interrow spacings, on both metal surfaces – despite their different symmetry, lattice constant, and electronic structure – strongly suggests that the molecular ordering is driven almost entirely by hydrogen-bonding and that the influence of the periodic surface potential is, at most, extremely weak. A lack of perturbation of the bi-isonicotinic acid molecular orbitals by the underlying Au(111) surface has also been inferred from resonant photoemission and X-ray absorption spectroscopy [Citation12].
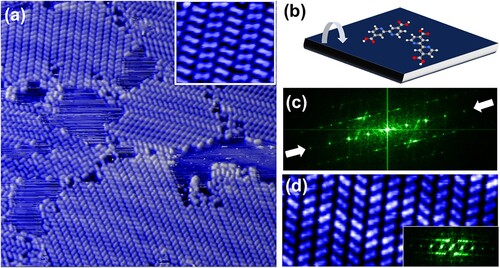
Figure 2. (a) 46 × 45 nm STM image of submonolayer domains of bi-isonicotinic acid on Au(111), deposited and imaged at room temperature. (Sample bias voltage: +1.5 V, tunnel current: 50 pA.) The majority of the image is taken up by molecular rows whose constituent molecules comprise either one or the other of the two enantiomers of the prochiral bi-isonicotinic acid. Inset: STM image (6 × 4.9 nm
) of bi-isonicotinic acid rows on Ag(100) showing the relative orientation of the enantiomers. (b) Schematic illustration of prochiral adsorption. The enantiomers are produced, in a 50:50 mixture, by adsorption of one of the ‘faces’ of the molecule onto the surface. When adsorbed, the molecule is locked into one enantiomeric form – without desorption and subsequent re-adsorption, a given enantiomer cannot switch state. (c) Modulus squared (i.e. power spectrum) of the two-dimensional Fourier transform of (a). The arrows highlight maxima arising from the interrow separation. (See text.) (d) Zoom of single-domain region of (a) highlighting variation in molecular orientation. The inset is the modulus squared of the corresponding 2D Fourier transform.
A naïve estimation of the OH··· N bond length (i.e. not taking into account distortions due to the flexibility of the CO tip) from high resolution AFM images, such as that shown in Figure (b), suggests that it is 2.7 () Åin length. At the lower limit of the uncertainty, the hydrogen bond is relatively short (for OH··· N) and its associated strength would help explain why intermolecular forces apparently entirely override the influence of the substrate (at least close to thermal equilibrium – see discussion below.) Figure (b) also clearly shows that the molecular rows are staggered with respect to each other, an effect common to all of our STM and AFM images of bi-isonicotinic acid on both the Au(111) and Ag(100) surfaces. Carboxyl groups in neighbouring rows are offset, strongly suggesting that there may also be a secondary H-bond interaction between the pyridine rings and the carboxyl groups. Although C-H is a weaker hydrogen bond donor than O-H (or N-H) due to the lower electronegativity of carbon, CH··· O hydrogen bonds have been found in pyridine-carboxylic acid co-crystals [Citation23].
A simulation using the probe particle model introduced by Hapala et al., Figure (c), provides broad agreement with the experimental image of Figure (b). The simulation, however, was calculated at a slightly lower tip-sample separation than was the case for the experimental image so as to emphasise the artefactual nature of the simulated intermolecular ‘bond’ features [Citation24–27]. Echoing the observations of Hämäläinen et al. [Citation24], we observe only weak contrast in the simulation in the region of the strongest hydrogen-bonds (i.e. OH··· N). Instead, inter-row features located at positions where CH··· O H-bonds might be expected are predominant in the simulation. Moreover, in the experimental AFM image, intensity in the OH··· N hydrogen bond regions is comparable, at best, to that of the features observed between the rows. In any case, and as discussed at length by a number of groups (including our own) [Citation24–27], the intermolecular features arise not from a direct observation of hydrogen bonding but from the flexibility of the CO molecule at the tip apex as it experiences the potential energy landscape of the underlying molecular assembly.
4. Prochirality and non-equilibrium assembly
Although the discussion of Figure above covers the key hydrogen-bonding interactions that drive molecular assembly, the growth kinetics and resulting adsorbed bi-isonicotinic acid structures are complicated substantially both by the prochiral nature of the molecule and its very weak interaction with the substrate. While the molecules of Figure (b) are staggered with respect to their counterparts in neighbouring rows, they all have the same orientation. This, however, is a very local picture. Figure instead provides a more global overview of the typical variation in near-equilibrium molecular order and orientation across the surface.
The STM images shown in Figure were acquired following deposition of bi-isonicotinic acid onto a room temperature Au(111) surface. (Imaging was also carried out at room temperature.) The majority of the surface is covered with large domains comprising extended molecular rows. (A small region of a different, metastable and locally ordered, phase is also observed in the image. We return to a discussion of phases of this type below.) As compared to Figure , however, the bi-isonicotinc acid molecules adopt two distinct orientations within those rows due to the enantiomers arising from the prochiral nature of adsorption (sketched schematically in Figure (b)). Adsorption on Ag(100) produces molecular row organisation whose local order is indistinguishable from that on Au(111) – a typical STM image of bi-isonicotinic adid on Ag(100) is shown in the inset to Figure (a). The weak substrate-molecule interaction is also evident from the signature of the herringbone reconstruction of Au(111) in Figure (a): there is a small, but clearly discernable, modulation of the molecular rows due to the underlying superstructure. Adsorption of bi-isonicotinic acid therefore does not remove the native Au(111) surface structure. Moreover, in regions free of molecular islands, room temperature STM images show a great deal of ‘streakiness’ due, most probably, to the presence of weakly bound molecules diffusing under the tip.
The modulus squared of a two-dimensional Fourier transform of Figure (a) is shown in Figure (c). Although the reciprocal space representation is complicated by the presence of multiple domains, the row separation and majority orientation can be discerned from the maxima along the line indicated in the figure. More importantly, there is no indication of the underlying symmetry of the Au(111) substrate in the 2D power spectrum. To aid interpretation, we include a zoom of a single-domain region in Figure (d), with its 2D Fourier transform shown in the inset. While the inter-row separation is well-defined in reciprocal space (relatively sharp spots), there is only a 50% probability of a neighbouring row having the same enantiomeric state. We expect a 50% probability on the basis of the equal chance of a bi-isotinic acid molecule adsorbing ‘face up’ or ‘face down’, but we have also confirmed this by direct counting of rows of different enantiomers in the STM images. This leads to only local order and thus much more diffuse maxima in the Fourier transform. A high resolution AFM image of two neighbouring molecular rows of different enantiomeric state is shown in Figure (a). Intra-row order remains driven by O-H··· N hydrogen bonding, just as in Figure (b). The only difference is that both enantiomeric forms are now present.
Figure 3. (a) nm
constant-height qPlus AFM image of neighbouring molecular rows comprising either one or the other of the two bi-isonicotinic acid enantiomers, acquired with a CO-functionalised tip. Inset: Constant-height dI/dV image of molecular rows acquired with a bias voltage of -1.17 V. As compared to the STM images shown in Figure (particularly the inset to Figure (a)), the dI/dV image shows a local contrast maximum, rather than a node, at the centre of the molecule. Note also the difference in brightness of that central maximum for different enantiomers. (b) Ball-and-stick model of the primary hydrogen bonds underpinning molecular organisation.
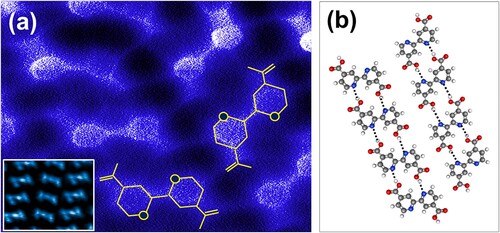
In order to probe the electronic structure of the molecular assemblies in more detail, we acquired constant-height differential conductivity images at a bias of -1.17 V, which coincided with a relatively narrow peak in dI/dV vs V spectra of single molecules (on Ag(100)). An example is shown in the inset to Figure (a). Unlike standard STM images, where there is a clear node in contrast between the pyridine rings, giving rise to a ‘peanut’ shape for the bi-isonicotinic acid molecules (see the inset to Figure (a) in particular), the dI/dV images show an anti-node at the centre of the molecule with neighbouring ‘wings’. We interpret this difference in overall contrast to the dI/dV maps being more sensitive to the oxygen and nitrogen lone pair charge density at the particular bias chosen. It is also intriguing to note that the central feature is less intense for the middle row in the inset to Figure (a), as compared to the neighbouring rows. (dI/dV images of larger areas show the same variation in intensity of the central feature for rows of different enantiomeric state.) This could suggest that on Ag(100) at least, the underlying substrate may indeed have some influence on the electronic structure of the adsorbed bi-isonicotinic acid molecules, despite the close similarity of the molecular superlattice parameters on both the silver and gold surfaces.
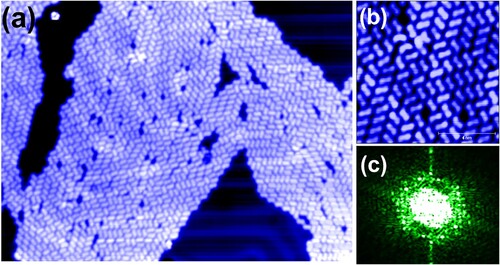
Another example of the not-entirely-negligible role of the substrate comes from STM images acquired following molecular deposition on a Au(111) surface that had not equilibrated to room temperature following removal of the sample from the liquid helium cooled (i.e. 4.5 K) microscope (Figure ). At this lower substrate temperature, only very small regions (of order a few nanometres in size) of ordered rows are observed; the molecular assembly is kinetically trapped in a state in which extended row formation is precluded (see Figure (b) in particular, which highlights the short-range order present in the assembly). Very similar kinetic effects have been shown to dramatically influence photoemission and X-ray absorption spectra of bi-isonicotinic acid monolayers and multilayers on a number of substrates [Citation12,Citation13,Citation16], although in those cases it was the molecular flux rather than the substrate temperature that was varied.
Figure 4. (a) nm
STM image of a far-from-equilibrium bi-isonicotinic acid assembly on Au(111), prepared via deposition onto a sample that had not equilibrated to room temperature. Note again the presence of contrast modulations in the molecular overlayer due to the underlying herringbone reconstruction, which is also clearly visible in the molecule-free regions of the surface. Image acquired at a sample bias of +3 V and tunnel current of 50 pA. (b) Offline zoom (
nm
) of a region of (a), highlighting absence of long-range order. (c) 2D Fourier transform (power spectrum) of (a) showing weak six-fold symmetry indicative of the influence of the surface potential on the molecular arrangement in this non-equilibrium case.
Regardless of the method used to modify the growth kinetics, Figure demonstrates clearly that a bi-isonicotinic acid assembly can be readily trapped far from equilibrium in a state whereby many molecules have not achieved their optimal hydrogen-bonding configuration. This will in turn strongly influence core-level photoelectron spectra (particularly the N 1s spectrum) due to both the lower number of hydrogen-bonds formed and the wider range of H-bond lengths arising from the lack of long-range order. Both effects will change the chemical environment of the N atoms and thus influence the initial state (and possibly the final state) of the photoemission process.
A 2D Fourier transform of Figure (a) (where, again, we plot the power spectrum) does not show the highly anisotropic structure observed in reciprocal space for molecules deposited onto a room temperature substrate (i.e. Figure (c) and the inset to Figure (d)). Instead, Figure (c) indicates that although the molecules have a reasonably well-defined mean separation – a broad annulus (perhaps better described as a ‘quasi-annulus’) is observed in Fourier space – the level of long-range order is insufficient to produce spots in the reciprocal space image. Nonetheless, the annulus in Fourier space is not entirely radially isotropic; weak six-fold symmetry, which we attribute to the influence of the underlying Au(111) surface, is apparent.
The lack of long-range order in Figure (a) is unsurprising. Although we do not have a value for the strength of the OH··· N hydrogen bond in the bi-isonicotinic acid-on-Au(111) system, we can make a simple estimate of the H-bond energy on the basis of a comparison to other, relatively comparable, systems. In a study motivated by an intriguing variation in hydrogen bonding interactions in polymorphs of 2-(phenylamino)nicotinic acid, Li et al. [Citation22] used the second-order Møller–Plesset perturbation approach (MP2) (correcting for basis set superposition errors) to determine the difference in the hydrogen bond energy of OH··· O vs OH··· N. They found that the latter was more energetically favourable, at a bond energy of ∼ 0.390 eV, by a substantial amount (more than 0.1 eV). Assuming that the dissociation of the OH··· N hydrogen bond represents the primary barrier to molecular diffusion, and that the Arrhenius pre-factor is constant, a bond energy of 0.39 eV is sufficient to freeze out appreciable molecular diffusion for temperatures even moderately below 293 K.
5. Monte Carlo simulations and tiling
Blunt et al. [Citation17] and Stannard et al. [Citation18] describe the application of rhombus tiling models to the self-assembly of molecular, and supramolecular, systems. This is a powerful approach that not only enables a much more robust, quantitative determination of molecular order but has deep parallels with wider tiling and tesselation problems both in pure mathematics and in non-equilibrium physics (such as those pertaining to aperiodic, glassy, and kinetically trapped systems.) In order to explore the hydrogen-bond mediated growth of 2D bi-isonicotinic acid assemblies, we have adopted the tiling model used by Blunt et al., albeit with substantial modifications of the tile-to-molecule mapping strategy. For one, due to the prochiral nature of bi-isonicotinic acid adsorption, the lack of reflection symmetry requires a doubling of the number of tiles used to represent a molecule. Moreover, the staggered nature of the molecular rows (see both Figures (b) and (a)) means that it is not possible to represent a molecule by a single rhombus tile.
In order to take these constraints into account, yet still ensure that intermolecular interactions can be accurately captured by the tiling model, we represent each molecular orientation – six in total, i.e. three rotations for each enantiomer – by a set of three coupled rhombi, as shown in Figure (a) for one enantiomer. The tiling configurations were established on the assumption that molecules would only bond with those whose outer two rhombi were of the same form as each other. This restriction imposes two types of interaction: alignment of a carboxyl group with a pyridinyl nitrogen, i.e. a OH··· N hydrogen bond (see Figure (b)) or the alignment of carboxyl groups. As discussed at length above, in experiment there is a clear preference for the former.
Figure 5. (a) Mapping of the bi-iosnicotinic acid molecule to a rhombus tile representation. In order to meet the constraints of the molecular lattices observed in experiment – in particular, the presence of two prochiral enantiomers and the staggered nature of the molecular rows – each molecular orientation is represented by three coupled rhombus tiles. Here we show only the orientations for one enantiomer. Another set of three rhombus tile blocks are required for the other enantiomer, resulting in a total of six sets of tile ‘triads’ to account for all possible orientations. Darker rhombus shading represents carboxyl groups, whereas the lighter-shaded central rhombus in each case represents the pyridinyl nitrogens. (b) Example of tile configuration for a OH··· N hydrogen bond between tiles of the same orientation. The OH··· N hydrogen bond is illustrated with a dotted red line.
The energy of a particular molecular configuration, , is defined as follows:
where
is the strength of the intermolecular interaction due to a carboxyl to nitrogen hydrogen bond,
the carboxyl-to-carboxyl hydrogen bond strength, and μ is the chemical potential of the lattice.
and
represent the number of nearest neighbours of each bond type (or, equivalently, tile type.) Once molecules are deposited in experiment they do not leave the surface. We therefore set μ constant for all simulated molecular arrangements – its value does not drive the evolution of the system. The Boltzmann weight of a particular molecular configuration,
(where i is simply a label for the state), is in turn given by:
where
is the Boltzmann constant and T is the temperature of the system. The probability of occupation of molecular state i is then
where
is the partition function.
To model the self-assembly of bi-isonicotinic acid islands and networks, we incorporate the tiling configurations and associated Boltzmann weights within a standard heat bath Monte Carlo algorithm (rather similar to that used by Blunt et al. [Citation17] and Stannard et al. [Citation18]). The tiles assemble on a triangular lattice and so a six-fold symmetry is imposed (in terms of the underlying simulated lattice) that is only apparent in experiment for low temperature, i.e. far from equilibrium, assembly on Au(111) (see Figure ). Nonetheless, the tiling simulation provides important insights into the evolution towards equilibrium, as discussed in the following.
We first populate the surface with an appropriate coverage of randomly placed and oriented tiles, ensuring equal numbers of each enantiomer. In this initial ‘deposition’ stage, the only consideration is whether a tile will fit into the randomly chosen site – there is no consideration of the energy balance. Once the surface is populated, rather than selecting a random site, a random molecule is considered. Only translation and rotations of that molecule are considered; a switch of enantiomeric state is prohibited, just as in experiment. The possible configurations of the molecule are appropriately weighted and a selection is made on the basis of comparison with a random number. Molecules are then visited in random order. Each Monte Carlo simulation ran for 10,000 molecular transition events, with 100 repetitions of every run.
6. From 2D gas to molecular lattice: the ‘Goldilocks’ zone
Representative outputs of Monte Carlo simulations for a range of effective temperatures spanning an order of magnitude, with a bond strength, of 1.14 and a fixed coverage of 0.42 monolayers are shown in Figure . The ratio of ϵ to effective temperature, T, is a key parameter in the simulation. The tiling model allows for both OH··· N and OH··· O bonding and thus each molecule has four potential bonding sites available to it. (Although in experiment we observe a clear preference for hydrogen bonding due to interactions with the pyridinyl nitrogen, the parameter space of the simulation was designed to be as flexible and free of bias as possible. As shall become clear, incorporating both types of hydrogen bonding in the simulation led to important insights into the predominance of OH··· N hydrogen bonding in experiment.)
Figure 6. Output of Monte Carlo simulations at a fixed coverage (0.42 monolayer) and bond strength () for a range of effective temperatures. Each simulation was run for 10,000 Monte Carlo steps and the final arrangement of molecular tiles in each case is presented along with the associated normalised number of bonds per molecule, N. The molecular arrangements shown are individual results from simulations, whereas the values for N are a statistical average of final state lattices for one hundred Monte Carlo simulations at a given effective temperature.
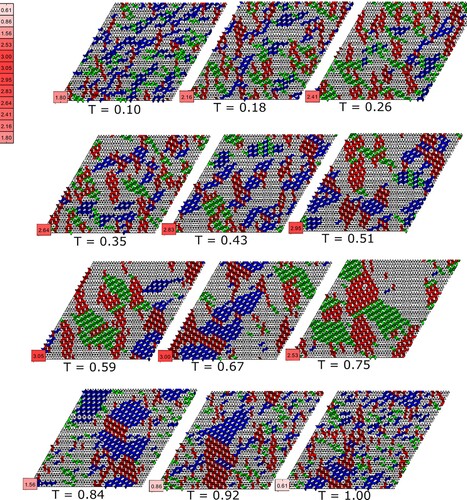
At the lowest effective temperatures there is limited long-range order, echoing our experimental observations (Figure ). Similarly, at the highest effective temperatures, extended molecular networks do not form (but for the opposite reason: the thermal energy is such that molecules easily detach from their neighbour(s).) There is clearly a critical temperature at which a so-called ‘Goldilocks’ criterion is met: molecular diffusion is sufficient to ensure that a given molecule can explore the potential energy landscape sufficiently to find a low energy binding site but not so high that the cohesive energy of the lattice is overridden by the heat bath. In the simulated molecular assemblies of Figure it would appear that this critical effective temperature is ∼ 0.6 (i.e. a thermal energy whose magnitude is approximately 60% of the intermolecular bond strength.)
To better quantify the degree of molecular organisation, and its relationship to , we have introduced a simple parameter, the normalised bond number, N (in effect, a rudimentary order parameter):
where
is the number of bonds between molecules and
is the total number of molecules on the lattice. If there is at least one bond per molecule on average, that is
, the lattice can be considered to be in a bound state where thermal energy has not overcome the formation of small localised molecular clusters. Significantly, the value of N also scales directly with the size of simulated molecular islands. Smaller but more numerous islands will lead to a lower number of average bonds per molecule in a given lattice, whereas coordination in larger islands will be higher, leading to an increase in the value of N. (The limiting value of N, i.e. four bonds per molecule, will never be achieved in practice as it would require a perfect, defect-free simulated lattice.) The critical temperature of the simulated molecular assemblies presented in Figure is at T = 0.59, where the average number of bonds per molecule is maximal at N = 3.05.
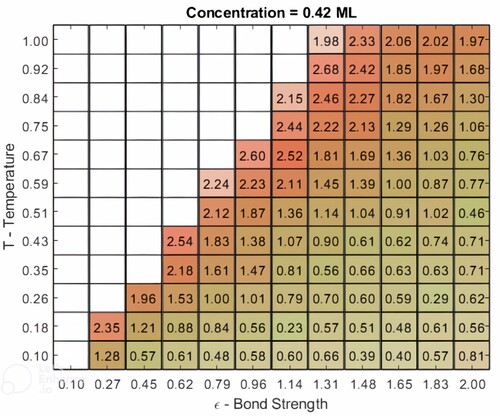
For a given coverage, a phase space map of ϵ vs T can be generated. An example is shown in Figure for the same molecular coverage as in Figure , i.e. 0.42 ML. The number in each square corresponds to the average number of bonds per molecule, N, and is shaded in red with an opacity that is a measure of the average number of OH··· N bonds per molecule, and in green with an opacity that scales linearly with the average number of OH··· O bonds. It is particularly intriguing to note that, despite the assumption of equivalent values for and
, the simulations still predict the strong preference for OH··· N hydrogen bonding seen in experiment.
Figure 7. A map of the variation in the normalised bond number, N, and preference score, P, as a function of effective temperature and bond strength in the Monte Carlo simulations. The number in each grid entry is the value of N (averaged over 100 runs); the shading and colour are mapped to the preference score: a deeper red (green) represents a higher (lower) value of P, i.e. a larger proportion of OH··· N (OH··· O) bonds. Regions of the phase map associated with a disordered lattice gas are left blank, i.e. are numberless.
We in turn quantify this higher propensity for OH··· N interactions using a preference score, P, which, like N, is an effective order parameter:
where
and
are the number of OH··· N bonds and OH··· O bonds respectively, and
is the total number of bonds formed in the lattice. (We note that our model currently does not include the hydrogen bonding interaction of carboxyl groups in neighbouring rows. Although, as mentioned above, this interaction is very likely to be rather weak, and so not have a major influence on the preference seen for OH··· N hydrogen bonding, our experimental data nonetheless clearly show that CH··· O bonding contributes to molecular organisation. In future work, we will incorporate this into the Monte Carlo code.) As ordered domains grow, i.e. N increases, the regions within the domain also coarsen with a preference being given to OH··· N hydrogen bonding. This is driven by the lowering of the total energy of the assembly when the number of molecules having equivalent orientation and chirality is maximised. As can be gleaned from an inspection of Figure , the preference score (i.e. the relative strengths of the red and green shading in the figure) shows a similar evolution with bond-strength and temperature as N. In other words, the preference for OH··· N hydrogen bonding increases concomitantly with average molecular domain size.
7. Conclusions
Near thermal equilibrium, bi-isonicotinic acid assembles on Au(111) and Ag(100) into large well-ordered domains whose structures are determined by a preference for the formation of OH··· N hydrogen bonds. Submolecular resolution STM and AFM imaging reveals that the domains comprise H-bonded rows having distinct handedness, and therefore orientation, arising from the prochirality of bi-isonicotinic acid. The inter-row and intermolecular separation within these well-ordered domains are identical (within experimental uncertainty) on both the Au(111) and Ag(100) substrates, highlighting the predominant influence of hydrogen-bonding in the self-assembly process. Away from thermal equilibrium, local molecular order appears instead to be weakly influenced by the substrate potential. Monte Carlo simulations involving the mapping of molecular structure to a rhombus tiling architecture reproduce the preference for OH··· N bonding seen in experiment.
Acknowledgments
We thank Peter Beton for helpful discussions regarding rhombus tiling models. The graphical abstract image was created by Filipe Junqueira, School of Physics & Astronomy, University of Nottingham, whom we gratefully acknowledge.
Disclosure statement
No potential conflict of interest was reported by the author(s).
Additional information
Funding
Notes
1 It is, however, perhaps worth highlighting that the CO ‘pick-up’ process is not especially routine; this point is arguably not entirely evident from the literature. The target CO molecule will often – in our experience, sometimes as regularly as 90% of attempts – either hop to a neighbouring adsorption site or apparently transfer to the tip without the concomitant inversion of contrast of surface-adsorbed carbon monoxide molecules that is the signature of an appropriately functionalised tip. In this context, Aldritt et al.'s automated tip functionalisation strategy [Citation28] is particularly noteworthy.
2 The experimental uncertainties were determined via measurement of molecular separation across ten images in distinct sample regions, for rows that were at least ten molecules wide or long. A standard error was then calculated from the repeated measurements.
References
- J. Schwintenberg, Physics From Symmetry (Springer, Cham, 2018).
- D.E. Neuenschwander, Emmy Noether's Wonderful Theorem (John Hopkins University Press, 2010).
- O. Stetsovych, M. Svec, J. Vacek, J.V. Chocholousová, A. Janvcarík, J. Rybácek, K. Kosmider, I.G. Stará, P. Jelínek and I. Starý, Nat. Chem. 9 (3), 213–218 (2017). doi:10.1038/nchem.2662
- K.-H. Ernst, Phys. Status Solidi B. 249 (11), 2057–2088 (2012). doi:10.1002/pssb.201248188
- F. Zaera, Chem. Soc. Rev. 46 (23), 7374–7398 (2017). doi:10.1039/C7CS00367F
- S.M. Barlow and R. Raval, Surf. Sci. Rep. 50 (6-8), 201–341 (2003). doi:10.1016/S0167-5729(03)00015-3
- A. Hagfeldt, G. Boschloo, L. Sun, L. Kloo and H. Pettersson, Chem. Rev. 110 (11), 6595–6663 (2010). doi:10.1021/cr900356p
- B. O'Regan and M. Grätzel, Nature 353 (6346), 737–740 (1991). doi:10.1038/353737a0
- L. Patthey, J. Chem. Phys. 110 (12), 5913–5918 (1999). doi:10.1063/1.478491
- A.G. Thomas, W.R. Flavell, C. Chatwin, S. Rayner, D. Tsoutsou, A.R. Kumarasinghe, D. Brete, T.K. Johal, S. Patel and J. Purton, Surf. Sci. 592 (1-3), 159–168 (2005). doi:10.1016/j.susc.2005.07.013
- P. Persson, S. Lunell, P.A. Brühwiler, J. Schnadt, S. Söndergren, J.N. O'Shea, O. Karis, H. Siegbahn and N. Mårtensson, J. Chem. Phys. 112 (9), 3945–3948 (2000). doi:10.1063/1.480945
- J.B. Taylor, L.C. Mayor, J.C. Swarbrick and J.N. O'Shea, J. Chem. Phys. 127 (13), 134707 (2007). doi:10.1063/1.2781510
- R.H. Temperton, A.J. Gibson, K. Handrup and J.N. O'Shea, J. Chem. Phys. 147 (5), 054703 (2017). doi:10.1063/1.4996746
- R.H. Temperton, S.T. Skowron, K. Handrup, A.J. Gibson, A. Nicolaou, N. Jaouen, E. Besley and J.N. O'Shea, Chem. Phys. 151, 074701 (2019. doi:10.1063/1.5114692
- L.C. Mayor, A. Saywell, G. Magnano, C.J. Satterley, J. Schnadt and J.N. O'Shea, J. Chem. Phys. 130 (16), 164704 (2009). doi:10.1063/1.3122685
- J.N. O'Shea, Y. Luo, J. Schnadt, L. Patthey, H. Hillesheimer, J. Krempasky, D. Nordlund, M. Nagasono, P.A. Brühwiler and N. Mårtensson, Surf. Sci. 486 (3), 157–166 (2001). doi:10.1016/S0039-6028(01)01058-5
- M.O. Blunt, J.C. Russell, M. del Carmen Giménez-López, J.P. Garrahan, X. Lin, Martin Schröder, N.R. Champness and P.H. Beton, Science 322 (5904), 1077–1081 (2008). doi:10.1126/science.1163338
- A. Stannard, J.C. Russell, M.O. Blunt, C. Salesiotis, M. del Carmen Giménez-López, N. Taleb, M. Schröder, N.R. Champness, J.P. Garrahan and P.H. Beton, Nat. Chem. 4 (2), 112–117 (2012). doi:10.1038/nchem.1199
- F. J.Giessibl, Rev. Sci. Instr. 90 (1), 011101 (2019). doi:10.1063/1.5052264
- L. Bartels, G. Meyer, K.-H. Rieder, D. Velic, E. Knoesel, A. Hotzel, M. Wolf and G. Ertl, Phys. Rev. Lett. 80 (9), 2004–2007 (1998). doi:10.1103/PhysRevLett.80.2004
- P. Hapala, G. Kichin, C. Wagner, F.S. Tautz, R. Temirov and P. Jelínek, Phys. Rev. B. 90 (8), 085421 (2014). doi:10.1103/PhysRevB.90.085421
- T. Li, P. Zhou and A. Mattei, CrystEngComm 13, 6536 (2011. doi:10.1039/C1CE05967J
- D. Singh and J.B. Baruah, CrystEngComm 11 (12), 2688 (2009). doi:10.1039/b911084d
- S.K. Hämäläinen, N. van der Heijden, J. van der Lit, S. den Hartog, P. Liljeroth and I. Swart, Phys. Rev. Lett. 113 (18), 186102 (2014). doi:10.1103/PhysRevLett.113.186102
- N. Néel and Jörg Kröger, Nano Lett. 21 (5), 2318–2323 (2021). doi:10.1021/acs.nanolett.1c00268
- M. Ellner, Pablo Pou and Rubén Pérez, ACS Nano 13 (1), 786–795 (2019). doi:10.1021/acsnano.8b08209
- S.P. Jarvis, M. Abdur Rashid, A. Sweetman, J. Leaf, S. Taylor, P. Moriarty and J. Dunn, Phys. Rev. B. 92 (24), 241405(R) (2015). doi:10.1103/PhysRevB.92.241405
- B. Alldritt, F. Urtev, N. Oinonen, M. Aapro, J. Kannala, P. Liljeroth and A.S. Foster, Comp. Phys. Comm. 273, 108258 (2022). doi:10.1016/j.cpc.2021.108258