
 ?Mathematical formulae have been encoded as MathML and are displayed in this HTML version using MathJax in order to improve their display. Uncheck the box to turn MathJax off. This feature requires Javascript. Click on a formula to zoom.
Abstract
The title reaction has been the topic of a large body of research over many decades, but accurate quantum state information for the reaction product is not available up to now. Using a novel ion-molecule crossed-beam spectrometer we aim to resolve state-to-state differential cross sections by velocity map imaging. Here we present the design parameters for this setup as well as Monte Carlo simulations of the expected product energy resolution for two different assumed reaction mechanisms. The simulation results show that the product vibrational levels can be separated up to about 0.8 eV of internal excitation, which corresponds to two vibrational quanta in either the symmetric or the asymmetric stretching vibration. Using coincidence imaging of both products, even higher excitation may be imaged with vibrational resolution.
GRAPHICAL ABSTRACT
1. Introduction
is the simplest electronically stable, poly-atomic molecular ion. It has been the subject of extensive studies since its discovery in 1911 by J. J. Thomson [Citation1]. Being an efficient proton donor, it is one of the most important precursors for chemical reactions in the interstellar medium, where ion-molecule reactions are key drivers of chemical evolution [Citation2–4]. It has been proven that
ions are found in both dense and diffuse interstellar clouds [Citation5,Citation6], and also in planetary atmospheres such as Jupiter [Citation7,Citation8]. The deuterium fractionation of
in collisions with HD [Citation9] has been used to probe the properties of dense cores that are close to the formation of new stars [Citation10].
The production of occurs via proton transfer to molecular hydrogen. In interstellar space, this happens mainly via the title reaction
which proceeds at the capture limit with a Langevin rate coefficient of
over a wide range of energies, see e.g. [Citation11–13]. At very low collision energies, quantum effects have been shown to increase the cross section [Citation14,Citation15]. The reaction is exothermic by 1.74 eV.
reactants are formed by cosmic ray-induced ionization of neutral
molecules. An alternative pathway to forming
is radiative association in dilute environments or three-body collisions at higher densities [Citation16].
The efficient formation reaction makes the dominant ion in molecular hydrogen plasmas, e. g. in cool stars or cold interstellar clouds [Citation17]. The main destruction pathways of
in dense molecular clouds are proton transfer reactions [Citation4,Citation18]. In diffuse interstellar clouds, the destruction of
mainly happens via dissociative recombination, where
reacts with an electron and forms either an
molecule and atomic hydrogen or three hydrogen atoms [Citation19,Citation20]. After many years of controversy, the energy dependence of the recombination rate constant, which depends sensitively on the rotational quantum state as well as the ortho or para hyperfine state of
, has been measured and calculated in reasonable agreement [Citation21–24].
features an equilateral triangle geometry with 0.85 Å bond lengths in its electronic ground state, while most electronically excited states are unstable with respect to dissociation [Citation25–27]. Theoretical work predicts that there is also a metastable triplet state with linear geometry and
symmetry that supports bound rovibrational states [Citation28]. In the ground state, the ion has no permanent dipole moment, therefore there should be no pure rotational spectrum. However,
has an instantaneous rotational spectrum due to centrifugal distortions [Citation29]. In contrast, deuterated
D
and
D
have a permanent dipole moment [Citation30].
has two vibrational modes, a symmetric breathing mode
, which retains the
symmetry and is infrared inactive, and an asymmetric two-dimensional bending mode
, which is infrared active [Citation31]. The latter is associated with a vibrational angular momentum quantum number l and would be l + 1-fold degenerate in the harmonic approximation.
Figure represents the calculated vibrational energy level diagram of all vibrational levels up to about
, with an estimated accuracy of better than
[Citation32]. More recently, an even more accurate potential energy surface became available [Citation33]. The diagram includes anharmonic effects and shows the lifting of the degeneracy of the
levels. Fundamental vibrational spectroscopy of
has been pioneered by Takeshi Oka [Citation34]. A number of vibrational overtone transitions have been studied spectroscopically [Citation35–37], using the cryogenic 22-pole radiofrequency ion trap developed by Dieter Gerlich [Citation38].
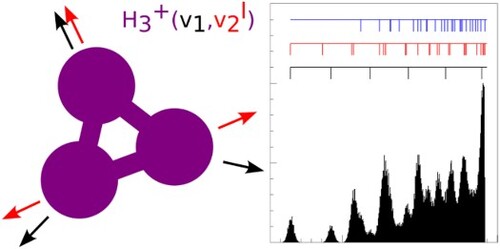
Figure 1. Energy level diagram of the rotationless vibrational levels of
. Pure symmetric vibrations are marked in black, pure asymmetric vibrations are marked in red, and combination bands are marked in blue. The energy values are taken from Ref. [Citation32]
![Figure 1. Energy level diagram of the rotationless vibrational levels (v1,v2l) of H3+. Pure symmetric vibrations are marked in black, pure asymmetric vibrations are marked in red, and combination bands are marked in blue. The energy values are taken from Ref. [Citation32]](/cms/asset/faa787ff-e670-4ac7-91ae-689dd6a6d505/tmph_a_2194455_f0001_oc.jpg)
Despite many years of research, there is still only limited information on the state-to-state dynamics of the title reaction. In particular, there is no experimental information on the rovibrational quantum states of the product. An early crossed-beam experiment showed evidence for forward-backward symmetric scattering [Citation39]. About 25% to 40% of the available energy was found to be partitioned into product recoil energy for scattering energies between 1.5 and 5.3 eV [Citation39]. Low-energy merged-beam experiments were modeled with a similar fraction of recoil energy [Citation12].
Also theoretically, a full quantum mechanical description of the title reaction remains a challenge. Glenewinkel-Meyer and Gerlich stated back in 1997 that this reaction ‘can be considered to be a prototype four-center reaction and it promises to be accessible to fully quantum mechanical theoretical studies’ [Citation11]. 25 years later full-dimensional quantum scattering calculations are still not available. However, later a high quality potential energy surface for the system has been computed [Citation40] and classical molecular dynamics with quantum transitions have been used to compute the total reaction cross section for
+
in good agreement with experiment [Citation41]. Furthermore, the symmetry properties of a reaction involving four identical atoms have been investigated [Citation42].
High resolution crossed-beam scattering experiments offer an opportunity to directly observe the angle-differential scattering cross section and the product vibrational states of the +
reaction. Crossed-beam experiments [Citation43] combined with velocity map imaging [Citation44] have been a well-established technique for studying chemical reaction dynamics [Citation45]. Usually, either universal electron impact ionization [Citation46], multiphoton ionization [Citation47], or Rydberg tagging [Citation48] is employed to probe the reaction product. For ion-molecule reactions, no ionization step is necessary as the charge is conserved, and the ionic product can be detected directly. In our group, we have investigated a range of positive and negative ion-molecule reactions using crossed-beam velocity map imaging, see e. g. [Citation49–51].
In this article, we present the design parameters of a newly developed ion-molecule crossed-beam imaging spectrometer and discuss the expected product velocity and corresponding energy resolution. This spectrometer will be built to achieve product vibrational resolution for a range of fundamental three- and four-atom ion-molecule reactions. In the next section, we describe the characteristics of the spectrometer and how we simulate its product energy and angular resolution. In the results section, we discuss this in light of the different product vibrational levels that may be populated in the product ions of the title reaction. We end with a conclusion section that also contains an outlook on the planned experiments.
2. Design parameters of a new crossed-beam spectrometer
Our group has been operating an ion-molecule crossed-beam imaging spectrometer for many years, which has been used to determine angle- and velocity-differential cross sections and product ion branching ratios for a variety of cation-neutral and anion-neutral reactions [Citation52–54]. In that spectrometer, reactant ions are created by igniting a plasma in a supersonic expansion of a suitable precursor gas and, after mass selection, thermalising the ion packet in an ion trap. The kinetic energy spread of the ion beam, measured in the reaction region, is typically 0.2 eV (FWHM) with an angular spread of approx. (FWHM). The neutral reactant beam, also created by supersonic expansion, has a typical speed ratio
and similar angular spreads. The velocity resolution for product ions in the center of mass frame and, therefore, the one associated with the measurement results depends on the scattering angle and product velocity and can be calculated from the properties of the reactant beams [Citation55].
Presently we are designing a new high-resolution crossed-beam imaging spectrometer, which will overcome the current limitations in velocity and angular resolution. A drawing of its design is shown in Figure . It contains an ion beamline and a supersonic neutral beam source that crosses the ions under 45. The length of the ion beamline from the source to the interaction region is about 750 mm. This beamline contains an ion accelerating column, two sets of X-Y deflectors, one ion lens, and a deceleration column. A velocity map imaging spectrometer is located around the interaction region, which extracts product ions perpendicular to the scattering plane. Our design goal is to reach a high velocity resolution for the products that emerge from ion-molecule crossed-beam scattering, which allows for the separation of product vibrational levels for a range of reactions involving hydrogen atoms, such as the title reaction.
Figure 2. Drawing of the new crossed-beam imaging spectrometer that is currently being built in our group. It shows a top down view of a horizontal slice through the setup. Two pulsed valves and skimmers are colored in red, the UV photoionization laser is sketched in purple. The ion and neutral beam paths are illustrated as green and red arrows. They intersect in the interaction region of a velocity map imaging spectrometer. The bottom part of the figure shows a heat map of applied voltages on the ion optics needed to produce a beam of 0.5 eV ions with minimised energy and angular spread. The optimisation has been performed and the heat map plot has been created with the COMSOL software package [Citation56].
![Figure 2. Drawing of the new crossed-beam imaging spectrometer that is currently being built in our group. It shows a top down view of a horizontal slice through the setup. Two pulsed valves and skimmers are colored in red, the UV photoionization laser is sketched in purple. The ion and neutral beam paths are illustrated as green and red arrows. They intersect in the interaction region of a velocity map imaging spectrometer. The bottom part of the figure shows a heat map of applied voltages on the ion optics needed to produce a beam of 0.5 eV H2+ ions with minimised energy and angular spread. The optimisation has been performed and the heat map plot has been created with the COMSOL software package [Citation56].](/cms/asset/d4fd8c7e-ede1-48d8-9c77-167c43e478e3/tmph_a_2194455_f0002_oc.jpg)
Regarding the ion beam, we plan to use multiphoton photoionization with nanosecond pulsed lasers. This will allow the creation of ions in a small volume at a well-defined electrostatic potential. The ionization volume can be further optimised using cylindrical lenses. Information about the initial internal state of the reactants is crucial for the experiment. ions can be produced by multiphoton ionization at 355 nm predominantly in the ground vibrational level [Citation57]. Alternatively, they may be produced by 3+1 REMPI between 300 and 320 nm [Citation11,Citation39].
The electrostatic electrodes along the ion beam path (shown in Figure ) are designed to slowly accelerate and transfer the ions from their origin towards the interaction region. Ions are then decelerated just before the collision using a set of ion lenses. A low number of ions will be created to suppress Coulomb repulsion effects. The potential of the ion source can be tuned to obtain different relative energies in center of mass frame before the collision. We have carried numerical simulations of the electrostatic potentials of the ion beamline using the COMSOL software package [Citation56] and have used these potentials for charge particle tracing simulations of a packet of 500 ions moving through the beamline, including mutual Coulomb repulsion. The electrode voltages along the beamline have then been optimised to minimise the spread of the ion kinetic energies when passing through the interaction region with the neutral beam. The simulated electrostatic potential from the optimised voltages is shown as a heat map below the electrodes in Figure . In this case, these potentials were optimised to produce ions with 7000 m/s in the interaction region, which corresponds to 0.5 eV kinetic energy. The COMSOL simulations lead to an energy resolution for an
reactant beam of 18 meV (FWHM) and an angular spread of 1
(FWHM), see Figure . For comparison, for the current experimental spectrometer, the FWHM uncertainties in kinetic energy and angle are 0.2 eV and 4
, respectively.
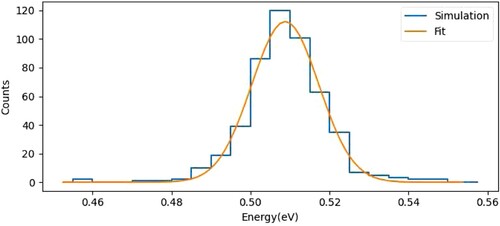
Figure 3. Histogram of the ion kinetic energy in the interaction region, simulated for a packet of ions moving through the potential energy landscape of the ion beamline. With optimised electrode voltages, a kinetic energy resolution of 18 meV (FWHM) is obtained.
The beam of neutral reactants will be created by an Even-Lavie-valve and passed into the interaction region through a single skimmer. From the design geometry, we expect an angular spread of approximately 1.6 (FWHM) for a 1.5 mm diameter skimmer. The velocity of a supersonic
beam is 2900 m/s, and we expect speed ratios of up to 50 at 50 bar backing pressure [Citation58].
The two beams will collide under an angle of 45 in the reaction region, as shown in the laboratory frame Newton diagram in Figure . The kinematics presented above yield a relative collision energy for the title reaction of 0.14 eV for 0.5 eV ion beam energy. Given an estimated supersonic beam density of 10
cm
in the interaction region and a Langevin capture cross section of about 10
cm
, the product ion yield is estimated to be about one
ion per bunch crossing for 500 reactant ions per pulse. This has to be compared to an estimated background rate within the few microsecond detection time window of less than 10
counts.
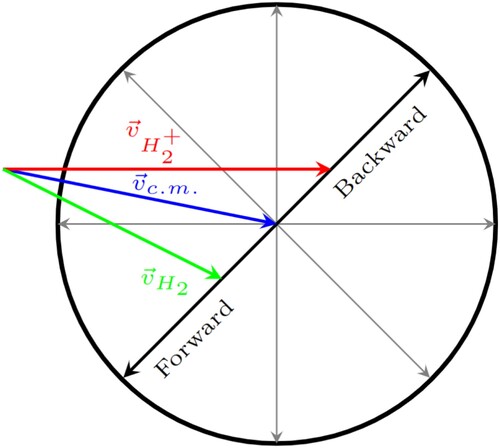
Figure 4. Newton diagram for reactive collisions of the title reaction in the laboratory frame of reference. The red and green arrows show the velocity vectors of the reactant beams used for the present simulation, the blue arrow shows the center of mass velocity. The black circle marks the kinematic cutoff velocity, the maximum product velocity for the given reactant velocities.
3. Monte Carlo method
To simulate differential cross section images for the title reaction, product ion velocities are calculated for different vibrational levels of the reaction product. The collision events are sampled using a Monte Carlo algorithm that we have implemented in a C++ class based on the ROOT framework [Citation59]. For each event, an ion velocity vector and a neutral velocity vector are randomly drawn from a three-dimensional Gaussian distribution with fixed mean velocity (7000 m/s and 2900 m/s for
and
, respectively) and different r.m.s. widths in the parallel and the two perpendicular directions (53 m/s and 52 m/s for the parallel and perpendicular widths of the ion beam, and 58 m/s and 35 m/s for the respective widths of the neutral beam, calculated from the expected angular and energy spreads or speed ratios given in the previous section). For each collision event, a product scattering angle and a rotation angle of the scattering plane about the relative velocity axis are randomly drawn. Then the product ion velocity vector in the laboratory frame is calculated based on the initial relative velocity vector, the exothermicity of the reaction, and a chosen internal energy for a specific vibrational level of
. The product ion velocity vector is then stored in a ROOT Tree structure in a data file. This process is repeated for a chosen number of events per vibrational level.
Two different simulations have been carried out, one for isotropic scattering into all accessible vibrational levels, and one for forward scattering with a preference for low product internal excitation. In the first case, an isotropic distribution is selected for the scattering angle θ and the number of events that are simulated per vibrational level is chosen to be 10 times the vibrational degeneracy l + 1. In the second case, forward scattering is assumed to follow a Gaussian distribution in
with an r.m.s. width of 0.1. In this case, the excited vibrational levels in the product ion are assumed to be exponentially suppressed by a factor
with
eV. For each of the two simulations, a data file is created. This file is then analysed using the same analysis software that we use for all our crossed-beam scattering experiments [Citation49,Citation55], i.e. the product relative velocity vector and the product internal energy are calculated from the product ion velocity for each event. From these events, the internal energy histograms shown in Figure are produced. For plotting the two-dimensional scattering images, the axial velocity component
along the reactant relative axis and the radial component
perpendicular to this axis are calculated. The intensity is weighted with
in order to provide images that represent a slice through the three-dimensional velocity distribution.
Figure 5. Diagram of the product velocities for the
+
reaction at 0.14 eV collision energy in the center of mass frame for all accessible
vibrational levels. The outermost circle represents the kinematic cutoff with no internal excitation in the
product. The circles with dashed lines show the pure symmetric vibrational levels, the circles with continuous lines show the pure asymmetric vibrational levels, and the circles with dotted lines show the combination vibrations. Superimposed are several ellipses denoting the radial and angular product velocity resolution for selected velocities and scattering angles (a) for the running velocity map imaging spectrometer [Citation55] and (b) for the currently constructed spectrometer. The ellipses are calculated with Gaussian error propagation based on the expected resolution of the reactant beams. Note that the ellipses for the new apparatus are so small that they become barely visible.
![Figure 5. Diagram of the H3+ product velocities for the H2+ + H2 reaction at 0.14 eV collision energy in the center of mass frame for all accessible H3+ vibrational levels. The outermost circle represents the kinematic cutoff with no internal excitation in the H3+ product. The circles with dashed lines show the pure symmetric vibrational levels, the circles with continuous lines show the pure asymmetric vibrational levels, and the circles with dotted lines show the combination vibrations. Superimposed are several ellipses denoting the radial and angular product velocity resolution for selected velocities and scattering angles (a) for the running velocity map imaging spectrometer [Citation55] and (b) for the currently constructed spectrometer. The ellipses are calculated with Gaussian error propagation based on the expected resolution of the reactant beams. Note that the ellipses for the new apparatus are so small that they become barely visible.](/cms/asset/16093524-2302-41a7-bf57-098caa3a4e24/tmph_a_2194455_f0005_oc.jpg)
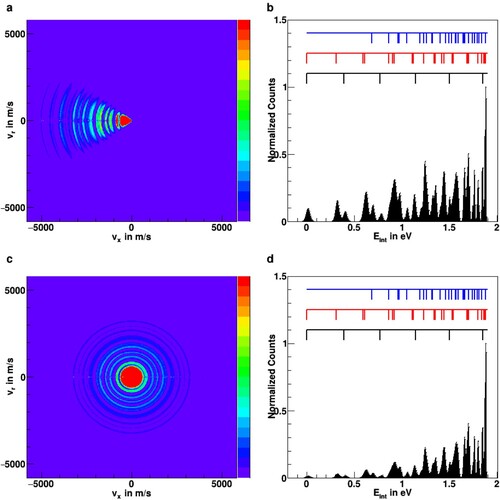
Figure 6. Monte Carlo simulations of ion scattering images after reaction at a collision energy of 0.14 eV for two different types of assumed reaction mechanisms, (a) forward scattering with reduced probability for high internal excitation and (c) isotropic scattering with statistical partitioning into all available vibrational levels (see text for details). Panels (b) and (d) show the respective internal energy distributions after integration over the scattering angle. The positions of vibrational levels are represented by the black (symmetric vibrations), red (asymmetric vibrations), and blue (combination vibrations) markers (see also Figure ).
4. Simulation results
Based on the design parameters of the novel ion-molecule crossed-beam imaging spectrometer, we have computed the expected product velocity resolution as a function of scattering angle and we have simulated differential cross section images in order to visualise the expected velocity spreads in the center of mass frame and the resolving power of the spectrometer for the vibrational excitation. The simulations have been performed for the title reaction using the known vibrational energy levels of the products ion up to 1.9 eV (about
) vibrational excitation (see Figure ).
In Figure , we show two Newton diagrams in the center of mass frame of the collision of with
for our running spectrometer [Citation55] and our currently constructed spectrometer (with forward scattering (see also Figure ) pointing in the negative
direction). The Newton diagrams show the product ion velocities for the different
vibrational levels. The outermost rings in panels Figure (a-b) correspond to the kinematic cutoff, where the full relative energy is transferred to kinetic energy of the products. The kinematic cutoff is calculated according to the exothermicity of the title reaction and the relative collision energy. The inner rings in Figure denote lower product velocities due to the excitation of the specific vibrational modes in
. This includes purely symmetric vibrational levels, which are shown in red, and purely asymmetric vibrational levels, shown in black. The blue rings represent the levels that combine both symmetric and asymmetric vibrational excitation.
The ellipses show the expected resolution for the product ion velocity. Their two axes correspond to the calculated r.m.s. accuracy of the product velocity in angular and radial direction, respectively. These are calculated by Gaussian error propagation from the kinematic parameters of the reactants, the velocity of the ion beam, the neutral beam, and the angular spread of ion and neutral beams [Citation55]. The main contribution stems from the ion beam velocity and angular spreads. When comparing both diagrams, it becomes obvious that with the conditions of the new spectrometer, the sizes of the ellipses are significantly smaller compared to the ellipses calculated for the running spectrometer. For example for forward scattering at the kinematic cutoff, the existing spectrometer shows r.m.s. widths of 300 m/s and 430 m/s in the parallel and perpendicular direction, respectively. In contrast, the calculation for the new design offers r.m.s. widths of 32 m/s and 87 m/s in the forward direction. This shows that the product ion uncertainties are significantly reduced, which is mainly due to the tenfold improved reactant ion energy resolution, which has been simulated for the new spectrometer (see above).
To obtain a more detailed insight if nearby vibrational levels are resolvable in product ion images, we have performed Monte Carlo simulations for the differential cross sections of the product ions. These simulations are shown in Figure (a–d). As described in the previous section, they have been carried out using the kinematic conditions of the new spectrometer at a relative collision energy of 0.14 eV. Rotational states of
were not considered in the simulation. Panels Figure (a,c) show simulated two-dimensional velocity distributions in the scattering plane, whereas panels Figure (b,d) show the product internal energy distributions that are obtained from the images after integrating over the scattering angle.
Two types of reaction mechanisms are considered for the simulations shown in Figure . In panels Figure (a-b) the majority of the product flux is assumed to be scattered in the forward direction, the direction of the neutral beam. This corresponds to previous results for the direct proton transfer reactions of
with CO [Citation60]. For this mechanism, we assume a reduced coupling of the relative translational energy to internal degrees of freedom, which we impose in the simulation by suppressing the probability for higher-lying vibrational levels. In contrast, in panels Figure (b,d), we consider a fully isotropic, complex-mediated reaction. Here population transfer is assumed into all energetically accessible vibrational levels according to their quantum degeneracy.
These reaction model cases are used as possible differential scattering cross sections, instead of the differential cross section determined by Pollard et al.. On the one hand, our limiting cases roughly encompass their result and should therefore also be relevant if we measure the same differential cross section. On the other hand, without the velocity map imaging technique, it has been a major challenge in the past to observe low-velocity product ions. We therefore expect to see more of these low-velocity products in our experiment and consider it important to include them in the simulations.
It is evident from the internal energy plots (Figure (b,d)) that it is possible to assign several of the peaks in the internal energy distribution to the different vibrational levels of . From the simulations, both assumed reaction mechanisms will allow for the possibility of resolving and quantifying vibrational level populations. The first asymmetric and the first and second symmetric stretching excitation may be clearly separated. The levels of the second asymmetric excitation, which are split by the different vibrational angular momentum values l = 0 and 2 (see Figure ), are more difficult to assign, as they also lie close to the first combination band
, but with good signal-to-noise ratio, it should still be possible to obtain their relative population from a fit to their respective energy peaks. Above 0.8 eV of vibrational excitation, where the level spacing becomes increasingly dense, the resolution of individual vibrational levels will be more challenging, but certain groups of vibrational levels may still be assigned.
The reactant ions will be produced by photoionization of normal- in J = 0, 1. The ions will therefore be produced with low rotational states as well. How much orbital angular momentum will be transferred to product rotational excitation is not known. By carefully analyzing the peaks in the energy-differential scattering measurements for the individual vibrational levels, in particular the ground state and the first and second excited levels, we will be able to characterise the rotational excitation as well, similar to what has already been achieved for
[Citation61].
In the simulations discussed here, the product energy is dominated by the exoergicity of about 1.7 eV. Lowering the collision energy further will therefore not provide a better resolving power of the high lying vibrational levels. Instead, coincidence imaging of both product velocities, neutral H and ionic would provide a means to enhance the internal energy resolution. In this way, higher vibrational levels will be resolvable and more information on the rotational level population will become available. To achieve sensitive and selective ionization of the neutral hydrogen atoms, we are currently setting up a Rydberg tagging detection scheme [Citation62], which is being successfully used in crossed beam scattering [Citation48] and in atom-surface collisions [Citation63].
5. Conclusion and outlook
and the collision and reactions it is involved in have been a life-long research topic of Dieter Gerlich. Here we have presented an experimental approach that will open up the opportunity to resolve the vibrational levels of this ion after formation in the
+
reaction. We have designed a new crossed beam velocity map imaging spectrometer with reactant beam parameters that will allow us to provide this information. The spectrometer is currently being constructed and commissioned.
We have carried out Monte Carlo simulations of the achievable product velocity and internal energy resolution, which predict that we can identify and quantify the population of a range of vibrational levels up to about 0.8 eV of internal excitation. For larger internal energies vibrational density of states becomes too large and the simulated energy peaks show a significant overlap. With an additional coincidence detection of neutral hydrogen atom products, the resolution may be further improved and even higher lying vibrational levels may be resolved.
With the novel spectrometer, not only the title reaction but a range of reactions of fundamental as well as astrophysical interest will be studied, such as collisions with helium or neon, for which quantum scattering calculations have already been performed [Citation64,Citation65]. Also deuterated species, more complex molecular ions such as protonated hydrocarbons, or negative ions may be studied. We hope that our future experiments will inspire further quantum calculations on three- and four-atom ion-molecule reactions, as they represent excellent opportunities for benchmarking calculations of energy partitioning and product angular distributions.
Acknowledgments
We are thankful to Dieter Gerlich for many inspiring scientific discussions over a time span of twenty years, many of which have sparked ideas for new experiments.
Disclosure statement
No potential conflict of interest was reported by the author(s).
Additional information
Funding
References
- J.J. Thomson, Proc. R. Soc. Lond. A 89, 1–20 (1913). doi:10.1098/rspa.1913.0057
- E. Herbst and W. Klemperer, Astrophys. J. 185, 505–534 (1973). doi:10.1086/152436
- A.G.G.M. Tielens, Rev. Mod. Phys. 85, 1021 (2013). doi:10.1103/RevModPhys.85.1021
- V. Wakelam, J.C. Loison, E. Herbst, B. Pavone, A. Bergeat, K. Béroff, M. Chabot, A. Faure, D. Galli, W.D. Geppert, D. Gerlich, P. Gratier, N. Harada, K.M. Hickson, P. Honvault, S.J. Klippenstein, S.D.L. Picard, G. Nyman, M. Ruaud, S. Schlemmer, I.R. Sims, D. Talbi, J. Tennyson and R. Wester, Astrophys. J. Suppl. Ser. 217, 20 (2015). doi:10.1088/0067-0049/217/2/20
- B.J. McCall, K.H. Hinkle, T.R. Geballe and T. Oka, Faraday Discuss. 109, 267–280 (1998). doi:10.1039/a800655e
- T. Oka, Proc. Nat. Acad. Sci. 103, 12235–12242 (2006). doi:10.1073/pnas.0601242103
- P. Drossart, J.P. Maillard, J. Caldwell, S.J. Kim, J.K.G. Watson, W.A. Majewski, J. Tennyson, S. Miller, S.K. Atreya, J.T. Clarke, J.H. Waite and R. Wagener, Nature 340 (6234), 539 (1989). doi:10.1038/340539a0
- T. Stallard, S. Miller, G. Millward and R.D. Joseph, Icarus 156 (2), 498–514 (2002). doi:10.1006/icar.2001.6793
- D. Gerlich, E. Herbst and E. Roueff, Planet. Space Sci. 50, 1275 (2002). doi:10.1016/S0032-0633(02)00094-6
- H. Roberts and T. Millar, Philos. Trans. R. Soc. A 364 (1848), 3063–3080 (2006). doi:10.1098/rsta.2006.1878
- T. Glenewinkel-Meyer and D. Gerlich, Isr. J. Chem. 37, 343 (1997). doi:10.1002/ijch.v37.4
- P. Allmendinger, J. Deiglmayr, O. Schullian, K. Hoeveler, J.A. Agner, H. Schmutz and F. Merkt, ChemPhysChem 17 (22), 3596–3608 (2016). doi:10.1002/cphc.v17.22
- I. Savic, S. Schlemmer and D. Gerlich, ChemPhysChem 21 (13), 1429–1435 (2020). doi:10.1002/cphc.v21.13
- P. Allmendinger, J. Deiglmayr, K. Hoveler, O. Schullian and F. Merkt, J. Chem. Phys. 145, 244316 (2016). doi:10.1063/1.4972130.
- E.I. Dashevskaya, I. Litvin, E.E. Nikitin and J. Troe, J. Chem. Phys. 145 (24), 244315 (2016). doi:10.1063/1.4972129
- D. Gerlich, R. Plašil, I. Zymak, M. Hejduk, P. Jusko, D. Mulin and J. Glosík, J. Phys. Chem. A 117, 10068 (2013). doi:10.1021/jp400917v
- C.M. Samuell and C.S. Corr, Plasma Sources Sci. Technol. 25 (1), 015014 (2015). doi:10.1088/0963-0252/25/1/015014
- V. Aquilanti and G.G. Volpi, J. Chem. Phys. 44 (6), 2307–2313 (1966). doi:10.1063/1.1727039
- G. Sundström, J.R. Mowat, H. Danared, S. Datz, L. Brostrom, A. Filevich, A. Kallberg, S. Mannervik, K.G. Rensfelt, P. Sigray, M. Af Ugglas and M. Larsson, Science 263, 785 (1994). doi:10.1126/science.263.5148.785
- D. Strasser, L. Lammich, S. Krohn, M. Lange, H. Kreckel, J. Levin, D. Schwalm, Z. Vager, R. Wester, A. Wolf and D. Zajfman, Phys. Rev. Lett. 86, 779–82 (2001). doi:10.1103/PhysRevLett.86.779
- H. Kreckel, M. Motsch, J. Mikosch, J. Glosik, R. Plasil, S. Altevogt, V. Andrianarijaona, H. Buhr, J. Hoffmann, L. Lammich, M. Lestinsky, I. Nevo, S. Novotny, D.A. Orlov, H.B. Pedersen, F. Sprenger, A.S. Terekhov, J. Toker, R. Wester, D. Gerlich, D. Schwalm, A. Wolf and D. Zajfman, Phys. Rev. Lett.95, 263201 (2005). doi:10.1103/PhysRevLett.95.263201
- S.F. dos Santos, V. Kokoouline and C.H. Greene, J. Chem. Phys. 127, 124309 (2007). doi:10.1063/1.2784275
- B.A. Tom, V. Zhaunerchyk, M.B. Wiczer, A.A. Mills, K.N. Crabtree, M. Kaminska, W.D. Geppert, M. Hamberg, M. Af Ugglas, E. Vigren, W.J. van der Zande, M. Larsson, R.D. Thomas and B.J. McCall, J. Chem. Phys. 130, 031101 (2009). doi:10.1063/1.3065970
- H. Kreckel, O. Novotný, K.N. Crabtree, H. Buhr, A. Petrignani, B.A. Tom, R.D. Thomas, M.H. Berg, D. Bing, M. Grieser, C. Krantz, M. Lestinsky, M.B. Mendes, C. Nordhorn, R. Repnow, J. Stützel, A. Wolf and B.J. McCall, Phys. Rev. A 82, 042715 (2010). doi:10.1103/PhysRevA.82.042715
- C.A. Coulson, Math. Proc. Cam. Phil. Soc. 31, 244–259 (1935). doi:10.1017/S0305004100013347
- K. Kawaoka and R.F. Borkman, J. Chem. Phys. 54 (10), 4234–4238 (1971). doi:10.1063/1.1674665
- M.J. Gaillard, D.S. Gemmell, G. Goldring, W.J.P.I. Levine, J.C. Poizat, A.J. Ratkowski, Z.V.J. Remillieux and B.J. Zabranksy, Phys. Rev. A 17, 1797 (1978). doi:10.1103/PhysRevA.17.1797
- O. Friedrich, A. Alijah, Z. Xu and A.J.C. Varandas, Phys. Rev. Lett. 86, 1183–1186 (2001). doi:10.1103/PhysRevLett.86.1183
- F.S. Pan and T. Oka, Astrophys. J. 305, 518–525 (1986). doi:10.1086/164264
- T. Furtenbacher, T. Szidarovszky, C. Fábri and A.G. Császár, Phys. Chem. Chem. Phys.15, 10181–10193 (2013). doi:10.1039/c3cp44610g
- T. Oka, Phys. Rev. Lett. 45, 531–534 (1980). doi:10.1103/PhysRevLett.45.531
- M. Pavanello, L. Adamowicz, A. Alijah, N.F. Zobov, I.I. Mizus, O.L. Polyansky, J. Tennyson, T. Szidarovszky and A.G. Császár, J. Chem. Phys. 136, 184303 (2012). doi:10.1063/1.4711756
- I.I. Mizus, O.L. Polyansky, L.K. McKemmish, J. Tennyson and N.F. Zobov, Mol. Phys. 117, 1663 (2019). doi:10.1080/00268976.2018.1554195
- T. Oka, Rev. Mod. Phys. 64 (4), 1141 (1992). doi:10.1103/RevModPhys.64.1141
- J. Mikosch, H. Kreckel, R. Wester, R. Plasil, J. Glosik, D. Gerlich, D. Schwalm and A. Wolf, J. Chem. Phys. 121, 11030–11037 (2004). doi:10.1063/1.1810512
- H. Kreckel, D. Bing, S. Reinhardt, A. Petrignani, M. Berg and A. Wolf, J. Chem. Phys. 129 (16), 164312 (2008). doi:10.1063/1.2994730
- M. Pavanello, L. Adamowicz, A. Alijah, N.F. Zobov, I.I. Mizus, O.L. Polyansky, J. Tennyson, T. Szidarovszky, A.G. Császár, M. Berg, A. Petrignani and A. Wolf, Phys. Rev. Lett. 108, 023002 (2012). doi:10.1103/PhysRevLett.108.023002
- D. Gerlich, Phys. Scr. T95 (T59), 256 (1995). doi:10.1088/0031-8949/1995/T59/035
- J.E. Pollard, L.K. Johnson, D.A. Lichtin and R.B. Cohen, J. Chem. Phys. 95 (7), 4877–4893 (1991). doi:10.1063/1.461704
- C. Sanz-Sanz, O. Roncero, M. Paniagua and A. Aguado, J. Chem. Phys. 139 (18), 184302 (2013). doi:10.1063/1.4827640
- C. Sanz-Sanz, A. Aguado, O. Roncero and F. Naumkin, J. Chem. Phys. 143, 234303 (2015). doi:10.1063/1.4937138
- N. Douguet, E. Assemat and V. Kokoouline, Eur. Phys. J. D 70 (11), 228 (2016). doi:10.1140/epjd/e2016-60587-9
- Y.T. Lee, Science 236 (4803), 793 (1987). doi:10.1126/science.236.4803.793
- A.T.J.B. Eppink and D.H. Parker, Rev. Sci. Instrum. 68 (9), 3477–3484 (1997). doi:10.1063/1.1148310
- K. Liu, Annu. Rev. Phys. Chem. 52 (1), 139–164 (2001). doi:10.1146/physchem.2001.52.issue-1
- P. Casavecchia, F. Leonori, N. Balucani, R. Petrucci, G. Capozza and E. Segoloni, Phys. Chem. Chem. Phys. 11, 46–65 (2009). doi:10.1039/B814709D
- A.J.R. Heck and D.W. Chandler, Annu. Rev. Phys. Chem. 46 (1), 335–372 (1995). doi:10.1146/physchem.1995.46.issue-1
- T. Wang, J. Chen, T. Yang, C. Xiao, Z. Sun, L. Huang, D. Dai, X. Yang and D.H. Zhang, Science342 (6165), 1499–1502 (2013). doi:10.1126/science.1246546
- J. Meyer and R. Wester, Annu. Rev. Phys. Chem. 68 (1), 333–353 (2017). doi:10.1146/physchem.2017.68.issue-1
- E. Carrascosa, J. Meyer and R. Wester, Chem. Soc. Rev. 46 (24), 7498–7516 (2017). doi:10.1039/C7CS00623C
- R. Wester, Mass Spectrom. Rev. 41, 627–644 (2022). doi:10.1002/mas.v41.4
- T. Michaelsen, T. Gstir, B. Bastian, E. Carrascosa, A. Ayasli, J. Meyer and R. Wester, Mol. Phys.119, e815885 (2020). doi:10.1080/00268976.2020.1815885
- B. Bastian, T. Michaelsen, M. Ončák, J. Meyer and R. Wester, Chin. J. Chem. Phys. 33 (2), 210 (2020). doi:10.1063/1674-0068/cjcp2002018
- J. Meyer, V. Tajti, E. Carrascosa, T. Györi, M. Stei, T. Michaelsen, B. Bastian, G. Czakó and R. Wester, Nat. Chem. 13, 977–981 (2021). doi:10.1038/s41557-021-00753-8
- R. Wester, Phys. Chem. Chem. Phys. 16, 396–405 (2014). doi:10.1039/C3CP53405G
- COMSOL Multiphysics v. 5.5. www.comsol.com. COMSOL AB, Stockholm, Sweden.
- X. Urbain, B. Fabre, E.M. Staicu-Casagrande, N. de Ruette, V.M. Andrianarijaona, J. Jureta, J.H. Posthumus, A. Saenz, E. Baldit and C. Cornaggia, Phys. Rev. Lett. 92, 163004 (2004). doi:10.1103/PhysRevLett.92.163004
- M. Hillenkamp, S. Keinan and U. Even, J. Chem. Phys. 118 (19), 8699–8705 (2003). doi:10.1063/1.1568331
- R. Brun and F. Rademakers, in Proceedings AIHENP'96 Workshop, Nucl. Inst. & Meth. in Phys. Res. A (Lausanne), Vol. 389, pp. 81–86. doi:10.1016/S0168-9002(97)00048-X. See also http://root.cern.ch/.
- E. Carrascosa, M.A. Kainz, M. Stei and R. Wester, J. Phys. Chem. Lett. 7 (14), 2742–2747 (2016). doi:10.1021/acs.jpclett.6b01028
- T. Michaelsen, B. Bastian, E. Carrascosa, J. Meyer, D.H. Parker and R. Wester, J. Chem. Phys. 147, 013940 (2017). doi:10.1063/1.4983305
- L. Schnieder, K. Seekamp-Rahn, E. Wrede and K.H. Welge, J. Chem. Phys. 107, 6175–6195 (1997). doi:10.1063/1.474283
- O. Bünermann, H. Jiang, Y. Dorenkamp, D.J. Auerbach and A.M. Wodtke, Rev. Sci. Instrum.89, 094101 (2018). doi:10.1063/1.5047674
- M. Hernandez Vera, R. Wester and F.A. Gianturco, J. Phys. B 51, 014004 (2018). doi:10.1088/1361-6455/aa97b0
- P. Gamallo, F. Huarte-Larranaga and M. Gonzalez, J. Phys. Chem. A 117, 5393–5400 (2013). doi:10.1021/jp402400g