
 ?Mathematical formulae have been encoded as MathML and are displayed in this HTML version using MathJax in order to improve their display. Uncheck the box to turn MathJax off. This feature requires Javascript. Click on a formula to zoom.
Abstract
Atomic oxygen ions, O+, created by photoexcitation of a cold supersonic beam of O2 by the output of a free-electron laser operating in the 128–122 nm region are detected by sliced velocity map imaging. Analysis of the richly structured high resolution kinetic energy and angular distributions obtained show that O+ production is due to the second and third harmonics present in the laser output. Excellent slicing and optimal velocity mapping allows separation of overlapping signal from dissociative photoionisation processes driven by 20 eV versus 30 eV photons. A two-colour experiment combining the free electron laser and a nanosecond dye laser output at 225.6 nm allowed detection of direct photodissociation of the metastable O2 + b4Σg- (v = 0–4) state is observed and assigned to a parallel b4Σg- – (c4Σu-)4s Rydberg transition followed by dissociation to O+ (4S) + O(3P2).
GRAPHICAL ABSTRACT
KEYWORDS:
Introduction
Tunable vacuum ultraviolet (VUV) radiation plays an important and growing role in current molecular physics research. Narrowband VUV, for example, was key in metrological measurements of the ionisation potential and dissociation of energy of H2, shown by Ubachs and co-workers [Citation1] to provide sensitive tests to the stability of universal constants of nature. Intense step-tunable VUV, as delivered by the unique VUV free electron laser-Dalian Coherent Light Source (DCLS) is exceptionally useful in determining and understanding the photodynamics of highly excited rovibronic states of small molecules such as water [Citation2]. Fully tunable VUV, particularly from synchrotron lasers, is highly efficient in laboratory astrophysics research on photodesorption from ice grain mimics [Citation3], and in photoelectron dichroism studies of molecular chirality [Citation4]. Furthermore, tunable VUV is necessary for efficient and recoil-free 1 + 1’ REMPI detection processes [Citation5,Citation6]. In most of the aforementioned examples, tunable VUV is combined with the powerful detection method velocity map imaging [Citation7] (VMI), which provides internal state and recoil velocity (angle and speed) information on photoproducts of VUV-molecule interactions.
We study here the interaction of molecular oxygen, O2, with DCLS radiation tuned in the VUV to wavelengths near H atom Lyman α (121.4 nm) transition, corresponding to photon energy around 10 eV. The absorption spectrum of O2 in the 10 eV wavelength region, shown in Figure (a), is dominated by two strong bands corresponding to transitions to the E(v = 0 and 1) upper state. O2 photodissociation dynamics at these two bands has been studied in detail by by Houston and coworkers {Lambert, 2004 #2109} O2 has a ‘window’ of very weak absorption at the H atom Lymann alpha band, 121.6 nm, allowing strong VUV emission at this wavelength from the sun to penetrate deep (down to ∼70 km) into earths’ atmosphere. It is thus important to know what happens to O2 on absorption in the wavelength region near Lymann α, where spin–orbit coupling and other state mixing processes give transition strength to numerous weak transitions underlying the X→E bands [Citation8]. In our 10 eV photodissociation experiment we study these weak transitions by detecting the angular and distributions and polarisation of O(3P2) photofragments using 2 + 1 resonance enhanced multiphoton ionisation (REMPI) at 225.625 nm. Because absorption by O2 in the 10 eV region away from the E 3Σu- (v = 0, 1) bands is relatively weak, see Figure (a), we decided not to use a gas filter in the VUV FEL, which allows more 10 eV photons but also the weak higher harmonic 20 and 30 eV photons into the apparatus. Molecular oxygen also absorbs at these photon energies (Figure (b) and figure caption) leading to signals that could interfere with the 10 eV dissociation data, which will be published separately. This paper describes imaging of O2 photodynamics with step-tunable radiation in the 20 and 30 eV regions. While the photodynamics of O2 in these ranges has been studied in great detail in the past [Citation8–10], our specially designed slice imaging apparatus offers higher fragment kinetic energy resolution, and the O(3P2) REMPI probe yields more insight on the photodissociation of the metastable b 4Σg- state of O2+ formed by 20 eV and/or 30 eV excitation of O2.
Figure 1. Absorption spectra of O2 in photon energy range of (a) 10 eV region adapted from Ref. [Citation8] at 10 eV and the total O+ yield spectrum (black line) around (b) 20 eV from Ref. [Citation9], where the red line marked (*) is O+ paired with low energy (<1 eV) electrons. Positions of the n, v states of the (B2Σg-) n(v)pσu Rydberg series are labelled in panel (b) Absolute cross sections are shown for the 10 eV range; absorption cross sections for the 20 and 30 eV (not shown) range can be estimated from Ref. [Citation10]. In the 30 eV region the absorption spectrum is constant with a cross section of ∼2 × 10⁻¹⁷ cm2. The FEL was set at the energy positions of the vertical dashed lines, corresponding to 127.96, 126.0, 125.01, 123.76, and 122.01 nm in the 10 eV spectrum. Other details shown in the figure are explained later in the text.
![Figure 1. Absorption spectra of O2 in photon energy range of (a) 10 eV region adapted from Ref. [Citation8] at 10 eV and the total O+ yield spectrum (black line) around (b) 20 eV from Ref. [Citation9], where the red line marked (*) is O+ paired with low energy (<1 eV) electrons. Positions of the n, v states of the (B2Σg-) n(v)pσu Rydberg series are labelled in panel (b) Absolute cross sections are shown for the 10 eV range; absorption cross sections for the 20 and 30 eV (not shown) range can be estimated from Ref. [Citation10]. In the 30 eV region the absorption spectrum is constant with a cross section of ∼2 × 10⁻¹⁷ cm2. The FEL was set at the energy positions of the vertical dashed lines, corresponding to 127.96, 126.0, 125.01, 123.76, and 122.01 nm in the 10 eV spectrum. Other details shown in the figure are explained later in the text.](/cms/asset/7a054ec6-9a29-4f22-965a-d086e9b31090/tmph_a_2195506_f0001_oc.jpg)
A general picture of the dynamics of O2 following excitation in the 10, 20, and 30 eV regions can be ascertained from its potential energy curves, shown schematically in Figure for the most relevant electronic states. Optically allowed transitions couple the X 3Σg- ground electronic state with 3Σu- and 3Πu excited states, and the 10 eV region includes a bound-bound transition to the allowed E 3Σu-(3s) Rydberg state and the strong bound-free transition to the B 3Σu- valence state, known as the Schumann-Runge transition. The B and E states undergo an avoided crossing in the 10 eV region and spin–orbit coupling via the mixed B/E state gives transition strength to a number of nearby Rydberg states in this region, as reported in detail by Lewis and coworkers [Citation8]. In the 20 eV region, absorption/ionisation produces the X, a (not shown) and b states of O2+, while all know bound ionic states of O2+ can be formed by absorption of 30 eV photons.
Figure 2. Schematic potential energy curves for the electronic states of O2 (black lines) and O2+ (graylines) most relevant to this study. The separated-atoms or dissociation limits are labelled in increasing energy and indicated by horizontal lines as neutral dissociation limits (NDL) for O2 and ionic dissociation limits (IDL) for O2+ (Table ). Dissociation limits correlating with O(3P) products are indicated by gray horizontal lines. EA represents the lowest energy position for production of neutral excited atoms.
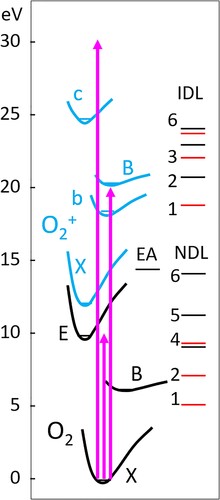
Our apparatus velocity maps O+ ions from O2, which are either created after VUV photodissociation followed by 2 + 1 REMPI of neutral O(3P2) photofragments, and/or directly by the 20 or 30 eV photons from free electron laser. 10 eV photons should not create O+ since the lowest energy threshold for O2 + 1hν → O+ + O + e- being 18.733 eV, labelled as IDL1 for O2+ in Figure . Table lists the first six dissociation limits of O2+ in more detail along with their molecular precursor states. While 20 eV photons can access only IDL1 of O2+ directly, they can also lead to production of electronically excited atoms (EA in Figure ) which, if their energy is above IDL1, can autoionise to form O+. In this study we have found no evidence of ion-pair formation which has a threshold of 17.3 eV, as a source of O+ ions. Absorption of 30 eV photons opens up many channels for O+ production and the threshold for double ionisation to produce O2++ is at 36.3 eV. Extensive studies of O2 photoexcitation in the 20-50 eV region have shown that a probable pathway after absorption is the process O2** → O2+* + e-, where O2+* is one of the bound electronic states of O2+ which include the X 2Πg, a 4Πu, A 2Πu, b 4Σg-, B 2Σg-, c 4Σu-, and C 2Σu- states below 30 eV. When the internal energy of molecules in any of these electronic states exceed a dissociation limit, then rapid pre-dissociation can occur to produce O+ ions. The c(v = 0, 1) and B(v) states are particularly active in this so-called dissociative photoionisation (DPI) process.
Table 1. Dissociation limits of O2+ and their correlating molecular states.
In a DPI process, the electron carries away the excess energy produced on formation of the O2+* electronic state. Regardless of the photon energy, the kinetic energy release of the resulting O+ ion from the dissociation step has a fixed value. We show here intricate radial pattern of O+ images produced by the FEL acting alone does not change significantly when changing the VUV photon energy between 9.7 and 10.1 eV. Most, but not all, of the O+ arises from absorption of 30 eV FEL photons during the 1.5 ps pulselength, producing O+ by dissociative photoionisation. Compared to previous studies of this process at photon energies in the 20 and 30 eV region, the excellent imaging quality of our slice imaging VMI setup on the FEL allows higher resolution of the vibrational patterns and weaker dissociation limits. Furthermore, we observe and analyze photodissociation of O2+* to produce O(3P2) atoms when overlapping the FEL-excited O2 sample with a dye laser beam tuned to 225.625 nm.
Experimental methods
In the present experiment, the photodissociation dynamics of O2 + hν (20, 30 eV) → O+ + O(3P2) + e- have been studied using the time-sliced velocity-mapped ion imaging (TSVMI) apparatus combined with the harmonics of VUV radiation in the 120–130 nm region and radiation at 225.625 nm from a pulse dye laser synchronised with the FEL. A detailed description of the FEL [Citation11] and the TSVMI apparatus used for VUV photodissociation of small molecules has been reported previously [Citation12]. A pulsed molecular beam of 10% O2 in Ar is produced by supersonic expansion through a General valve (Parker, series 9, nozzle diameter 1.0 mm) operating at 10 Hz with a stagnation pressure of ∼1 bar. The O2 molecular beam is collimated by a conical skimmer (Beam Dynamics, Model No. 1) with 1.0 mm orifice diameter prior to entering the photoexcitation/photoionisation region along the axis of velocity-mapped ion imaging optics, where it is crossed perpendicularly with the VUV beam and the UV beam that are counter-propagating to each other. The step-tunable VUV beam is generated by a FEL facility operating in the high gain harmonic generation (HGHG) mode in which a seed laser (λseed) is injected to interact with the electron beam in the modulator. The λseed (in the wavelength range of 240∼360 nm) is produced from a picosecond (ps) Ti:sapphire laser. The electron beam is generated from a photocathode radio frequency gun and accelerated to a beam energy of ∼300 MeV by seven S-band accelerator structures, with a bunch charge of 500 pC. The micro-bunched beam is then sent through the radiator which is tuned to the 2nd/3rd/4th harmonic of the seed wavelength, and coherent FEL radiation with wavelength λseed/2, λseed/3, or λseed/4 is emitted. Optimising the linear accelerator yields a high-quality beam with emittance of ∼1.5 mm·mrad, energy spread of ∼1‰, and pulse duration of ∼1.5 ps. In this work, the FEL operates in a specified step-tunable range of 120–130 nm (and the higher harmonics) with a typical spectral bandwidth of ∼50 cm−1 and pulse energy of ∼2μJ. The UV beam is generated by frequency doubling of a Nd-YAG pumped dye laser tuned to 225.625 nm for 2 + 1 REMPI detection of the nascent O(3P2) photoproducts from O2 photodissociation. The O+ ions are then accelerated by the ion imaging optics and velocity mapped onto a position sensitive dual microchannel plate (MCP) backed by a phosphor screen (Photek, VID275), which is positioned at the end of a 75 cm time-of-flight tube. The MCP detector is gated with a fast high-voltage pulser (∼30 ns effective gain width of the slice) in order to detect only the central part of the O+ ion cloud. The actual gain width is smaller as indicated by analysis of the measured images by the FINA software [Citation13] which yielded an effective slice width of only 8%. The light corresponding to the <30 ns slice of O+ ion signals from the phosphor screen is imaged by a charge coupled device camera. During data acquisition, a real-time event counting method is performed for signals of each image. The velocity for accumulated image is calibrated by the O+ image for multiphoton dissociation/ionisation process of O2 molecules [Citation14]. Angular distributions of the O+ photofragments are obtained from using the Cartesian basis set expansion option of the FINA program. The anisotropy parameters β are obtained by fitting each radial portion of the image data to f (θ) ∝ 1 + βP2(cos θ) where θ is the angle between the recoil velocity and the polarisation direction of the FEL-VUV or the REMPI laser, and P2(x) is the second order Legendre polynomial. In the limiting case of axial dissociation via a pure parallel or perpendicular transitions, β equals 2 or −1.
Results
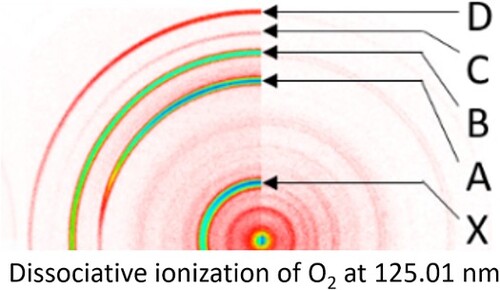
Raw, sliced velocity-mapped O+ images produced by crossing the seeded supersonic beam of O2 molecules with the FEL laser are shown on the right hand side in Figure for four different wavelengths in the VUV. An image taken at 126.0 nm (not shown) was weaker than the images shown in Figure . In the images shown on the left hand side of the Figure the O(3P2) REMPI laser was also present. For the images taken at 123.71 (lower right corner) and 125.01 nm, the relative sensitivity for both sides of the image are the same, for the 122.01, 123.71 (upper right corner) and the 127.96 nm images the FEL-only side is shown at higher sensitivity in order to better visualise the ring structure. Most of the FEL + O(3P2) REMPI rings are much stronger than the FEL-only rings, which arise from the much lower intensity 20 and 30 eV harmonics, since – as mentioned earlier – 10 eV photons should not produce O+ from O2. For the FEL + O(3P2) REMPI signal the strongest rings are labelled X, A, B, C, and D and assigned in Table .
Figure 3. Raw O+ images from FEL-only (right side) and FEL + O(3P2) REMPI (left side) crossing an O2 molecular beam. Intensity is shown on a log scale to bring out the weaker rings, a colour coding bar for linear colour scale images is shown in Figure . For both lasers linear polarisation is used with the E field direction along the vertical axis of the figure. The more intense rings seen with VUV+REMPI are labelled (D–X) in the 125.01 nm image.
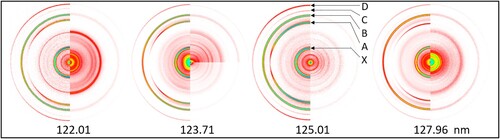
Table 2. Assignments of main peaks in the FEL + REMPI images.
Rings X, B, and D are due to the presence of only the O(3P2) REMPI laser. There is significant accidental overlap of rings B and D with FEL-only signal. Rings A and C arise from O(3P2) photofragment atoms from VUV (10 eV) photoexcitation/dissociation of O2. Note that the focused O(3P2) REMPI laser converts ∼1-10% of O(3P2) to O+ and probes only roughly 10−4 of the sample volume created by the FEL-molecular beam overlap, which supplies the full FEL-only signal. This suggests that the 20, 30 eV harmonics of the FEL output are at least 106 weaker than the 10 eV component. In our study of neutral O2 photodissociation by VUV the critical rings are C and A, which arise from photodissociation by the VUV FEL. Overlap of C and A with the (20, 30 eV) FEL-only and (20, 30 eV) FEL + REMPI lasers are analyzed in this paper.
O+ total kinetic energy release distributions for the four images of Figure are shown in Figure using a linear signal scale (a.u.). Because the time-sliced velocity-mapped ion imaging (TSVMI) apparatus in Dalian attains excellent slicing, the images were analyzed using the Cartesian Basex option of the FINA inversion software[Citation13], which indicated for these images an impressive 8% slice. The distributions were first normalised to peak B (FEL + REMPI) of Table and then expanded on the vertical axis to emphasise the FEL-only signal (lower blue curves). The FEL and FEL + REMPI curves were taken using the same experimental conditions for all wavelengths. Most striking in the FEL-only images and the corresponding TKER curves are numerous sharp well-resolved rings especially at lower TKER.
Figure 4. Total kinetic energy release (TKER) distributions for the O+ images shown in Figure , using the FINA inversion program. The upper (gray) curves are from FEL + REMPI images while the lower (dark gray curves) are from FEL only images. Peaks seen in the FEL + REMPI curves are also indicated in Fig and assigned in more detail in Figure . Several peaks labelled with (*) are from excited atom (EA) pathways. Symbols connected to vertical drops lines for the FEL only curves and drop-down vertical lines in the FEL + REMPI curves are explained in the text and following figures. [See colour online].
![Figure 4. Total kinetic energy release (TKER) distributions for the O+ images shown in Figure 3, using the FINA inversion program. The upper (gray) curves are from FEL + REMPI images while the lower (dark gray curves) are from FEL only images. Peaks seen in the FEL + REMPI curves are also indicated in Fig 3 and assigned in more detail in Figure 6. Several peaks labelled with (*) are from excited atom (EA) pathways. Symbols connected to vertical drops lines for the FEL only curves and drop-down vertical lines in the FEL + REMPI curves are explained in the text and following figures. [See colour online].](/cms/asset/b4fe5d69-fd76-43be-82e6-2dab402360bf/tmph_a_2195506_f0004_oc.jpg)
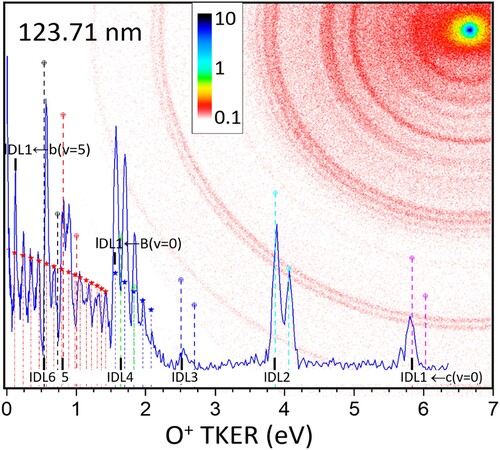
The lower TKER region of the FEL-only 125.01 nm image is shown in more detail in Figure along with a portion of the image, now shown on a linear intensity scale. The full TKER distribution and partial image (log scale colour coding to bring out the weak high energy rings) at 123.71 nm presented in Figure show a similar rich structure at lower TKER and a well-resolved pair of rings at 4 eV TKER.
Figure 5. Low energy region of the raw FEL-only image and TKER curve at 125.01 nm using a linear colour scale. The symbols on the vertical striped lines represent dissociation of the B-state (open squares) and b-state (filled circles). Peaks marked by and asterisk (*) indicate possible excited atom (EA) states with a perpendicular angular distribution.
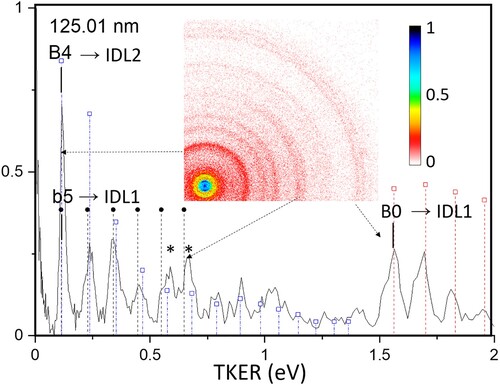
Figure 6. Detailed FEL-only TKER curve and partial image (log intensity) at 123.71 nm.
Discussion
Most of the peaks observed in the FEL-only TKER distributions shown in Figures can be easily assigned based on the results of the numerous previous studies of O2 dissociative photoionisation (DPI) [Citation10, Citation15–23] Only in the 0.5–1.5 eV TKER region is a full assignment not possible due to overlap of peaks. Overall, the images in Figure and their TKER curves (Figure ) are similar to each other over a range of photon energies covering up to several eV at 30 eV (Figure (c)), which is characteristic of DPI. From the absolute cross sections shown in Figure (a) and the known laser intensity it is possible estimate the probability of one-photon excitation of O2 by VUV photons as being P = N1/N0 ∼ sIt where N the state population, σ the absorption cross section in cm−2, Ι the laser intensity in photons/cm2s and τ the VUV laser pulselength in seconds. With the given experimental conditions P < 10−4. This excludes the possibility of multi-step excitation by the VUV laser only, which would require unrealistically large cross sections for the second and third photons steps due to the low value of N1 in the process. Instead, direct excitation by the (weak) 20 and 30 eV harmonics present in the VUV laser beam takes place. As mentioned above, we scale the measured signal strength to peak B in the FEL-REMPI TKER curves, which depends only on the O2 molecular beam and the REMPI sensitivity. The relative peak A (see Table ) signal strengths plotted in Figure (a) as open circles on the 10 eV curve agree well with the absorption spectrum after scaling at 125.01 nm. This can be expected since peak A corresponds to one VUV photoexcitation / dissociation to DL2 of neutral O2, the dominant dissociation limit for O2 excitation in this VUV energy region. The match of 10 eV specific signal strength and the 10 eV absorption spectrum confirms also that the VUV intensity is constant across the scanning region.
The main O+ production processes observed in this study can be described with the help of the simplified set of potential energy curves shown in Figure , where solid lines denote the c 4Σu-, B 2Σg-, and 3 2Πu states of O2+ and dashed lines denote series of Rydberg states that converge to those bound states. In addition, the b 4Σg- bound state is also shown. While many of these states correlate with IDL1,3, or 5, the small fraction of the FEL-excited sample probed precludes detection of neutral O(3P2) products from DPI by the O(3P2) REMPI laser.
Figure 7. Schematic potential energy curves relevant to this work showing O2+ bound states and one of their Rydberg progressions, adapted from Ref. [Citation27]. Curves corresponding to the c-state, which correlates with IDL2 and its precursor Rydberg states are colour coded in black, similar grouping are shown for the 32Πu states (IDL5 – blue) and the B-states (IDL3 – green). Resonances in the absorption spectrum corresponding to transitions to the B-states group are labelled in the 20 eV graph in Figure . [See colour online].
![Figure 7. Schematic potential energy curves relevant to this work showing O2+ bound states and one of their Rydberg progressions, adapted from Ref. [Citation27]. Curves corresponding to the c-state, which correlates with IDL2 and its precursor Rydberg states are colour coded in black, similar grouping are shown for the 32Πu states (IDL5 – blue) and the B-states (IDL3 – green). Resonances in the absorption spectrum corresponding to transitions to the B-states group are labelled in the 20 eV graph in Figure 1. [See colour online].](/cms/asset/c5125277-ca91-4593-a5b3-7b71c52642d8/tmph_a_2195506_f0007_oc.jpg)
30 eV Photons
Inspection of Figures and show a large part of the higher TKER FEL-only signal arises from dissociative photoionisation of the O2+ c-state, formed after absorption of 30 eV photons. Photoelectron imaging and/or O+ TKER curves using photons in the 25–50 eV region show formation of all accessible bound states, with the c-state and B-state leading to the most O+ production. These states also produce the main O+ signals observed here. The very shallow c-state well around 24.5 eV is due to an avoided crossing and supports only two vibrational levels, v = 0 and v = 1. Tunnelling from the v = 1 level to the adiabatic c-state curve (Figure ) is rapid and the level is found to connect exclusively with DL2 [Citation21], which is in accord with the absence of v = 1 peaks for DL1, DL3 and DL5 assigned as shown in Figures and . Note that while the expected position of the DL6 signal is indicated in Figure , only DL5 signals have been observed previously, in accord with our assignment in Figure . In addition, the c-state relative peak heights and also the angular distributions extracted from the images for the higher TKER region agree well with previous measurements by Nahon and coworkers at 25.4 eV [Citation21], who used electron-ion coincidence settings to avoid signal from the B-state. Vrakking and coworkers [Citation23] reported ion and electron velocity mapped images for O2 excitation at 46 eV, and observed – as is typical in previous studies – O+ signals mainly arising from the O2+ B- and c- states, with a B: c proportion in signal strength similar to ours shown in Figure . While their work did not achieve vibrational resolution, their vibrational envelope agreed well with our smooth decrease in vibrational populations for dissociation of the B-state to the DL1 limit (TKER ∼ 1.8 eV) from v = 0 to v = 4 for all wavelengths except 122.01 nm, which is discussed next. Angular distributions measured for the resolved B-state vibrational levels in our work agreed quite well with those measured by Tang and coworkers [Citation22] at 22.4 eV. Their study has shown that B(v > 4) levels can also dissociate via the DL2 level, but with a branching ratio < 0.05. The expected TKER values for this channel are included in Figure and the B(v) peaks are seen to almost perfectly overlap the peak positions for dissociation of O2 + b(v + 1) to DL1. Considering the high signal levels in the low energy region compared to that for B(v)→DL1, we conclude these peaks observed in the 0-0.5 eV TKER region do not correspond to B(v)→DL2 dissociation, but to b(v’) → DL1.
While most of the O+ formation at 30 eV can be assigned to DPI via the c- and B- states, it is known that other bound states, especially the 32Πu and the C2Σu- states can yield additional signals particularly in the 0–3 eV TKER range [Citation21]. In addition, excited atoms are known to be produced by neutral dissociation/autoionisation, these processes also yield O+ signals mainly in the 0–3 eV TKER range.
20 eV Photons
The lower TKER region of Figure displays many extra peaks that are significantly stronger than those observed previously with pure 30 eV radiation, which we attribute to the 20 eV photons present in the FEL output. Four important energy thresholds (see Figure ) in the studied 19.378–20.323 eV region are 18.170 eV for formation of O2+b(v = 0), O2+ DL1 at 18.733 eV, 20.353 eV for formation of O2+B(v = 0) and O2+ DL2 at 20.700 eV. A progression of Rydberg states, each with a manifold of rovibrational levels, approach each bound state from below in the potential energy curve diagram. A series of overlapped peaks in the 20 eV region lead to O+ production, with the more prominent peaks assigned to the Rydberg progression (B)nσu v = 2 levels indicated in Figure (b), and the (B)5σu potential energy curve is shown in Figure .
For photon energy below 20.353 eV, photoelectron studies show excitation to these (B) Rydberg states lead to formation of O2+ in the X-, a-, and particularly b- states, where b(v > 4) can dissociate to DL1, leading to O+ production. The total amount of O+ formed is also known to rise on reaching the threshold for formation of O2+ B(v = 0). This is seen in the O+ yield curve marked by a (*) in Figure (b), which is filtered for low energy but not exclusively threshold electrons correlating to B-state production. While the shortest FEL wavelength selected in the 20 eV region, (122.01 nm/2) or 20.325 eV, is just below the B(v = 0) threshold, taking into account the FEL bandwidth profile at this energy ∼10 meV FWHM and the rotational envelope [Citation16], limited excitation to B(v = 0) can be expected and is observed. This explains one of the few significant differences between the images and TKER curves shown in Figures and , respectively, in the region between 1-2 eV. At 122.01 nm a large signal corresponding to O2 + B(v = 0) → DL1 appears, in accord with excitation by the second VUV overtone in the 20 eV region. Two additional, broad rings also appear for this wavelength at lower TKER that agree well with the positions expected for autoionisation of the electronically excited atom O 3s” (1Po and 3Po) levels at total energy 14.372 + 5.117 = 19.489 and 14.123 + 5.117 = 19.240 eV, respectively. An (overly simplified) explanation for production of these EA is direct excitation to the repulsive wall of the 3sσ’ Rydberg state correlating to the 32Πu bound state shown in Figure , which crossed the Franck-Condon window for 20 eV excitation. This Rydberg state correlates with the O 3s” (1Po, 3Po) dissociation limit and involves excitation of a perpendicular Σ→Π dipole transition leading to production with negative beta angular distribution, where β ∼ −0.2 for both O 3s” (1Po and 3Po).
The O 3s” (1Po, 3Po) levels are often seen as neutral dissociation products from direct (one-photon excitation) of O2 in the 20-30 eV region, and also following four-photon excitation of O2 at 248 nm [Citation24], equivalent to direct excitation at 20.00 eV. These and other Excited Atom (EA) signals, marked by an asterisk (*) in the TKER diagrams of in Figure , are known to increase in intensity commensurate with O2+ B-state production. Angular distributions for excited atoms are often perpendicular (β < 0) in nature [Citation25], as observed in our study. Several of the unassigned rings in the 1–1.5 eV region also show a perpendicular nature and could thus arise from numerous possible excited atoms lying higher in energy than the assigned O 3s” (1Po and 3Po) levels.
Photodissociation of the O2+ b 4Σg-state at 225.625 nm (5.49 eV).
Dissociative photoionisation is found to dominate O+ production following 20 and 30 eV excitation of O2 by the FEL laser. However, 20 and 30 eV excitation can also lead to formation of a wide range of O2+ states with internal energy less than 18.733 eV, IDL1, which do not lead to O+ production, but which will most likely will pre-dissociate at different rates to neutral O atoms. Several weak but clear rings appear around 1.7 eV in the FEL + REMPI images, at energies slightly higher than peak A (Table ), that cannot be assigned to VUV photodissociation of O2. An expanded portion of the 123.71 nm image is shown in Figure where one of these rings is indicated by a dashed line. The energy positions of these extra signals agree perfectly with positions (indicated by drop lines from the top horizontal axis in Figure ) for photodissociation of O2+ b(v) to DL2. From Table the DL2 products are O+(4S) + O(1D), which means that the REMPI detection laser is driving molecular ion photodissociation but not, in addition, resonantly ionising the neutral fragment. Optical excitation from the b 4Σg- state can access 4Σu- and 4Πu states which can couple adiabatically with dissociation limits DL2-5.
Figure 8. Expanded portion of the 123.71 nm FEL +O(3P2) – REMPI laser image with one of the rings corresponding to photodissociation of the O2+ b(v = 2) state (see Figure ) indicated by a dashed line. The angular distribution of this ring is superimposed above the image along with its best-fit angular distribution parameter curve for β = 1.9 ± 0.2 (see text).
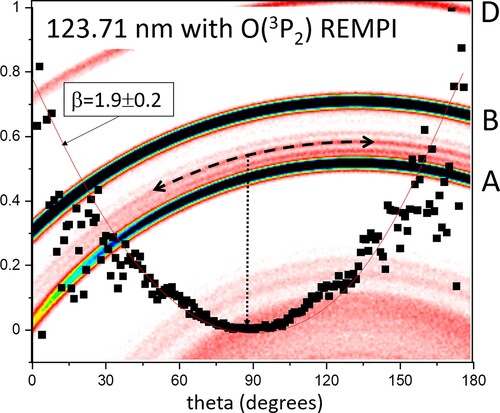
The production of stable O2+ b-state after 20 eV irradiation of O2 is known previously via detection of emission assigned to the b 4Σg- – a 4Πu First Negative System bands, which are observed on excitation of O2 in the 20 eV region [Citation20,Citation26,Citation27]. The envelope of O2+ b-state photodissociation peaks appear most clearly where minimum overlap with peak A occurs, which is at the longest VUV (x2) wavelength 127.61 nm. A maximum in the vibrational profile is seen here for O2 + b(v = 1) → DL2, in accord with previous measurements of the nascent b-state population distribution [Citation20]. The angular distribution shown in Figure with β ∼1.9 indicates a pure parallel transition to an upper level of 4Σu- symmetry. Such a transition, to the to the repulsive wall of the c 4Σu- (4sσu) Rydberg state, is shown in Figure , which is a dipole-allowed, parallel transition. Analysis of the other b-state photodissociation signals yielded slightly lower values of beta, most likely due to overlap with the tail of the much stronger and less anisotropic peak B. Droplines are also shown for photodissociation of O2+ b-state to the DL1 (yielding O(3P2) products) around 5.5 eV, where no signal is discernable, and for DL3 around 2 eV which overlaps the B → DL2 bands. O2 + b(v < 5) levels are lower in energy than DL1 and are metastable with measured lifetimes in the picosecond region [Citation20]. In our experiment, the REMPI laser has a 4 ns pulselength that is in temporal overlap with the 1.5 ps FEL.
No 225 nm photodissociation signals were observed starting from the B-state, which is much shorter lived than the b-state. Photoexcitation of the X- and a- states do not reach DL1 with 5.5 eV photons and thus are not expected to produce O+ ions, although the tightly focused REMPI laser could drive a multiphoton dissociation. The only clear signal observed is b-state photodissociation to DL2.
Finally, the images and corresponding TKER distributions shown here are of significantly higher resolution than of previous studies, partly due to excellent slicing, but mainly due to the fact that we carry out non-coincidence imaging. The most informative previous studies [Citation21,Citation22] of O2 excitation in the energy regions we study here were recently carried out by synchrotron based double imaging photoelectron photoion coincidence VMI apparatus in Saclay or Heifei. Slight compromises are made especially in O+ imaging part of these setups in order to improve mass resolution and to employ static fields for the electron and ion detectors. This has the result that up to now such high resolution O+ images at 20 eV as shown here have not been obtained previously. Electron images with comparable resolution to ours can be obtained, and in general, the multidimensional information available from coincidence filtering gives a more complete overall picture of the ensuing molecular dynamics. For dominant processes such as DPI in O2, however, it is desirable not to compromise on ion resolution. We show here higher imaging resolution that gives unique PDI vibrational specific population and angular distributions, and allows observation of photodissociation of metastable stable states. With the present rapid advancement of imaging detector technology, similar gains in resolution in coincidence mode imaging setups may be expected in the future.
Summary
Velocity map imaging of O+ ions from the interaction of O2 with the DCLS have been reported for several VUV photon energies in the 9–11 eV range. This paper describes O+ production processes due to the second and third harmonics of the VUV output of the FEL, and shows that the main production process is dissociative photoionisation of the O2+ b-state following excitation by 20 eV photons, and the O2+, c- and B-states from 30 eV photons. The O+ production pathways, fragment internal state population and angular distributions are in good agreement with previous studies in the 20–50 eV range. In addition, photodissociation of the O2+ b-state, most likely via the 4s Rydberg c-state is observed when a second REMPI detection laser at 225.625 nm is present. Excellent image resolution is obtained by the slicing apparatus, used in non-coincidence configuration.
Acknowledgements
We thank the staff team of the Dalian Coherent Light Source for technical support.
Disclosure statement
No potential conflict of interest was reported by the author(s).
Additional information
Funding
References
- E. Reinhold, R. Buning, U. Hollenstein, A. Ivanchik, P. Petitjean and W. Ubachs, Phys. Rev. Lett. 96, 151101 (2006). doi:10.1103/PhysRevLett.96.151101
- Z. Luo, Y. Zhao, Z. Chen, Y. Chang, S.-e. Zhang, Y. Wu, J. Yang, Y. Cheng, L. Che, G. Wu, D. Xie, X. Yang and K. Yuan, Sci. Adv. 7, eabg7775 (2021). doi:10.1126/sciadv.abg7775
- R. Dupuy, M. Bertin, G. Feraud, X. Michaut, P. Marie-Jeanne, P. Jeseck, L. Philippe, V. Baglin, R. Cimino, C. Romanzin and J.-H. Fillion, Phys. Rev. Lett. 126, 156001 (2021). doi:10.1103/PhysRevLett.126.156001
- R. Hadidi, D.K. Božanić, H. Ganjitabar, G.A. Garcia, I. Powis and L. Nahon, Commun. Chem. 4, 72 (2021). doi:10.1038/s42004-021-00508-z
- V. Plomp, X.-D. Wang, F. Lique, J. Kłos, J. Onvlee and S.Y.T. van de Meerakker, J. Phys. Chem. Lett. 12, 12210–12217 (2021). doi:10.1021/acs.jpclett.1c03643
- X.-D. Wang, D.H. Parker, S.Y.T. van de Meerakker, G.C. Groenenboom and J. Onvlee, Mol. Phys. 120 (1–2), e1979264 (2021). doi:10.1080/00268976.2021.1979264
- A.T.J.B. Eppink and D.H. Parker, Rev. Sci. Instrum. 68, 3477 (1997). doi:10.1063/1.1148310
- J. Lacoursiere, S.A. Meyer, G.W. Faris, T.G. Slanger, B.R. Lewis and S.T. Gibson, J. Chem. Phys. 110, 1949 (1999). doi:10.1063/1.477852
- P. Erman, A. Karawajczyk, E. Rachlew-Kallne, M. Stankiewiczy and K. Yoshiki Franzen, J. Phys. B At. Mol. Opt. Phys. 29, 5785 (1996). doi:10.1088/0953-4075/29/23/020
- D.M.P. Holland, D.A. Shaw, S.M. McSweeney, M.A. MacDonald, A. Hopkirk and M.A. Hayes, Chem. Phys. 173, 315–331 (1993). doi:10.1016/0301-0104(93)80148-3
- Y. Chang, S. Yu, Q. Li, Y. Yu, H. Wang, S. Su, Z. Chen, L. Che, X. Wang, W. Zhang, D. Dai, G. Wu, K. Yuan and X. Yang, Rev. Sci. Instrum. 89, 063113 (2018). doi:10.1063/1.5017757
- Y. Zhao, J. Chen, Z. Luo, Z. Li, S. Yang, Y. Chang, F. An, Z. Chen, J. Yang, G. Wu, W. Zhang, X. Hu, D. Xie, H. Ding, K. Yuan and X. Yang, J. Phys. Chem. Lett. 13, 9786–9792 (2022). doi:10.1021/acs.jpclett.2c02757
- J.O.F. Thompson, C. Amarasinghe, C.D. Foley and A.G. Suits, J. Chem. Phys. 147, 013913 (2017). doi:10.1063/1.4979305
- B. Buijsse, W.J. van der Zande, A.T.J.B. Eppink, D.H. Parker, B.R. Lewis and S.T. Gibson, J. Chem. Phys. 108, 7229–7243 (1998). doi:10.1063/1.476141
- L.E. Berg, P. Erman, E. Källne, S. Sorensen and G. Sundström, Phys. Scr. 44, 328 (1991). doi:10.1088/0031-8949/44/4/004
- P. Baltzer, B. Wannberg, L. Karlsson, M.C. Göthe and M. Larsson, Phys. Rev. A. 45, 4374 (1992). doi:10.1103/PhysRevA.45.4374
- Y. Lu, Z.X. He, J.N. Cutler, S.H. Southworth, W.C. Stolte and J.A.R. Samson, J. Electr. Spectrosc. Relat. Phenom. 94, 135–147 (1998). doi:10.1016/S0368-2048(97)00099-6
- A. Lafosse, J.C. Brenot, A.V. Golovin, P.M. Guyon, K. Hoejrup, J.C. Houver and D. Dowek, J. Chem. Phys. 114, 6605–6617 (2001).
- A. Lafosse, J.C. Brenot, P.M. Guyon, J.C. Houver, A.V. Golovin, M. Lebech and R.R. Lucchese, J. Chem. Phys. 117, 8368–8384 (2002). doi:10.1063/1.1512650
- D.A. Shaw, D.M.P. Holland, E.E. Rennie and L.G. Shpinkova, J. Phys. B Atom. Mol. Opt. Phys. 38, 173 (2005). doi:10.1088/0953-4075/38/3/004
- X. Tang, G.A. Garcia and L. Nahon, J. Chem. Phys. 148, 124309 (2018). doi:10.1063/1.5011046
- X. Tang, X. Zhou, M. Wu, Y. Cai, S. Liu and L. Sheng, J. Phys. Chem. A. 116, 9459–9465 (2012). doi:10.1021/jp3034038
- P. Johnsson, W. Siu, A. Gijsbertsen, J. Verhoeven, A.S. Meijer, W. Van der Zande and M.J.J. Vrakking, J. Mod. Opt. 55, 2693–2709 (2008). doi:10.1080/09500340802393062
- B.L. Bakker, D.H. Parker, P.C. Samartzis and T.N. Kitsopoulos, J. Chem. Phys. 112, 5654–5659 (2000). doi:10.1063/1.481140
- Y. Zhou, Q. Meng and Y. Mo, J. Chem. Phys. 141, 014301 (2014). doi:10.1063/1.4884906
- H. Helm, P.C. Cosby and D.L. Huestis, J. Chem. Phys. 73, 2629–2640 (1980). doi:10.1063/1.440476
- H. Liebel, S. Lauer, F. Vollweiler, R. Müller-Albrecht, A. Ehresmann, G. Schmoranzer, B. Mentzel, K.-H. Schartner and O. Wilhelmi, Phys. Lett. A. 267, 357–369 (2000). doi:10.1016/S0375-9601(00)00138-9