
 ?Mathematical formulae have been encoded as MathML and are displayed in this HTML version using MathJax in order to improve their display. Uncheck the box to turn MathJax off. This feature requires Javascript. Click on a formula to zoom.
Abstract
Polyacenes among other polycyclic aromatic hydrocarbons (PAHs) were suggested to be abundant in the dense regions of the interstellar medium (ISM) and to be responsible for some of the diffuse interstellar bands (DIBs). The identification of DIB carriers requires the laboratory spectra of cold cations for comparison with astrophysical observations. We employed He-tagging spectroscopy to record the spectrum of tetracene cations. In contrast to previous measurements of other polyacene cations, we found very narrow absorption bands of tetracene +. This makes the detection of tetracene+ in the ISM much easier compared to other studied polyacene cations. The four absorption bands of tetracene+ that are the best suited for the detection in observational spectra appeared at 859, 850.9, 838.8, and 827.3 nm. We did not find any DIBs at these positions. However, the observational spectra in this region from ground-based telescopes are heavily contaminated with telluric absorption bands, which greatly complicates the detection of DIBs. Comparison with observations performed by space telescopes is expected to significantly increase the sensitivity of the detection of the DIBs that could potentially be assigned to tetracene+.
GRAPHICAL ABSTRACT
KEYWORDS:
Introduction
Polycyclic aromatic hydrocarbons (PAHs) were suggested to be abundant in astrophysical environments based on the detection of unidentified infrared emission (UIE) bands [Citation1–3]. The UIE bands are 3.3, 6.2, 7.7, 8.6, 11.2, and 12.7 μm emission bands observed from various objects in the interstellar medium (ISM). Besides being good candidates for the carriers of UIE bands, PAHs were also proposed to be responsible for some of the diffuse interstellar bands (DIBs) [Citation4,Citation5], which are absorption features of dense areas of the ISM. These suggestions have resulted in numerous spectroscopic studies of PAHs under conditions similar to those found in the ISM [Citation6–13]. PAHs are expected to be present mainly in the cationic and neutral states in the ISM in areas where DIBs are detected [Citation14]. The spectroscopy of neutral molecules is relatively simple. The spectra of neutral molecules cooled in supersonic jets can be measured by various techniques. The spectroscopy of cations was in turn a rather complex technical problem. Due to Coulomb repulsion, it is practically impossible to create a high number density of cations at low temperatures in the gas phase. At the same time, the use of alternative measurement methods, such as trapping ions in various media, for example, in inert gas matrices, causes additional issues. A considerable shift of the position of the absorption bands that appears due to the interaction with the environment prevents direct comparison with observational spectra. For these reasons, highly sensitive spectroscopic methods, e.g. cavity ring-down spectroscopy [Citation6,Citation15,Citation16], had to be used. Another possibility to obtain information about cations is to perform zero kinetic energy (ZEKE) or mass-analyzed threshold ionisation (MATI) spectroscopy [Citation17]. However, due to the limitation of the maximum energy of photons produced by tuneable lasers, these methods are mainly used to obtain information about the vibrations of cations.
A more universal approach to solve these problems is to use mass spectrometric techniques, which are extremely sensitive. In this case, the spectroscopy can be performed by adding a weakly bound tag that detaches upon absorption of a single photon. In the past, the most used tags were rare-gases atoms [Citation18–20] or H2 molecules [Citation21]. The shift of the absorption bands caused by the tag is relatively small compared to the matrix isolation technique and can be also approximately evaluated by recording the spectra with a different number of tagged species [Citation20]. However, still a notable shift caused by the addition of a single tagged species makes the error in the evaluation of the positions of the absorption bands of gaseous ions relatively large. A breakthrough in the method was achieved when experimentalists managed to use helium atoms as tags. Helium, as the most inert and non-polarisable atom, gives a much smaller shift, which makes it possible to minimise the error in determining the position of the absorption bands of gaseous ions. However, these properties of helium also have a drawback, since they lead to extremely weak bonds between the He atoms and the ions under study. Thus, a very low temperature of about a few degrees Kelvin should be achieved to add the helium tags to the investigated ions. This makes the method difficult to achieve in a laboratory. Cooling to these low temperatures using supersonic expansion is possible but extremely challenging, particularly when ions are produced from neutral species due to high energy input. Such weakly bound complexes can be alternatively formed in cryogenic ion drift tubes [Citation22] or in cryogenic radio frequency (RF) ion traps by collisions with He buffer gas [Citation23]. Dieter Gerlich developed the first cryogenic multipole ion trap [Citation24], further improvement of which led to the development of the 22-pole ion trap [Citation25], which is currently used in different laboratories around the world.
Such cryogenic multipole ion traps were first utilised for He-tagging spectroscopy of cations [Citation26] and began to be widely used for this purpose. The 22-pole ion trap developed by Dieter Gerlich was also used to generate helium-tagged C60 cations, enabling the spectroscopy experiments which confirmed C60+ as carriers of several DIBs in the near infrared (NIR) [Citation27–29]. This finding in combination with the non-detection of absorption bands of neutral C60 [Citation30] shifted the focus of the study of DIBs to cations. The increased demand for the spectral data of cold cations required a further improvement of the spectroscopic techniques. An alternative approach to produce He-tagged ions was suggested based on the use of the He droplet technique, which allowed a considerable increase in the number of produced He-tagged ions [Citation31] and as a consequence an increase in the rate of the spectral data collection.
Among other PAHs, polyacenes were suggested as promising candidates for DIB carriers [Citation32]. The laboratory absorption spectra of several polyacene cations such as naphthalene [Citation19], anthracene [Citation33], and heptacene [Citation34] are available at a quality allowing the direct comparison with the astrophysical observations. At the same time, for tetracene (Tet) cations, only spectra in an inert matrix are available [Citation35]. Therefore, in this article, we used the He-tagging method to perform the spectroscopy of tetracene Tet+, and compare their spectra with the observational ones.
Experimental
Superfluid helium nanodroplets were formed via supersonic expansion of helium gas (99.9999% purity) through a cooled nozzle with a diameter of 5 μm. The helium stagnation pressure and nozzle temperature were tuned to optimise the ion yield of He-tagged Tet+, with stagnation pressure values ranging from 27 to 30 bar and nozzle temperatures in the range of 8.5–9.6 K. This generates He droplets with a mean droplet size of a few million He atoms. After passing through a skimmer (0.8 mm diameter) the droplets are subjected to electron ionisation at electron energies between 35 and 39 eV with an electron current of 320–380 µA. For each experiment, these parameters were adjusted in these ranges in such a way as to maximise the production of He-tagged ions. It results in the production of multiply charged droplets with an estimated average charge state of around +10e [Citation36]. Mutual Coulomb repulsion of the cationic charge centres arranges them in minimum energy configurations close to the surface of these droplets [Citation37]. The multiply charged helium droplets are doped with Tet molecules in the pick-up chamber. For this, Tet powder (Sigma-Aldrich, 99% purity) is placed in an oven maintained at 100°C. Gas-phase Tet molecules are picked up by the multiply charged helium droplets upon collision. After the pickup of a Tet molecule by the droplet, the dopant is ionised via charge transfer from He+. Helium-tagged dopant ions are liberated from the surrounding He matrix upon collision of these large helium droplets with a polished stainless-steel surface at a normal incidence angle [Citation31]. Most dopant ions have up to several 100 He atoms attached. The mass of these Tet+ Hen is small enough to be measured by mass spectrometry. Electrostatic fields are used to extract these ions from the collision chamber. A stack of Einzel lenses is used to guide these ions to the mass spectrometer which is an orthogonal extraction reflectron time-of-flight mass spectrometer (ToF-MS, Tofwerk AG model HTOF).
A tunable pulsed laser (EKSPLA NT242, laser linewidth < 5 cm−1) is utilised to perform action spectroscopy upon electronic excitation of the helium-tagged ions. The laser was calibrated using a wavelength metr (SHR High-Resolution Wide-Range Wavelength Metr). All spectral data provided in the article are given in air wavelengths. The frequency of the extraction pulses of the mass spectrometer is 12 kHz for the measurement from 400-600 nm and 10 kHz for all others. The repetition rate of the tuneable laser was 1 kHz. The synchronisation between the laser and the ToF-MS allows the illumination of ions before every twelfth or tenth extraction pulse, respectively. Mass spectra both with and without laser illumination are then recorded while scanning the laser wavelength. The comparison of mass spectra with and without laser irradiation allows us to obtain the spectra for each mass detected by the mass spectrometer. Absorption of a photon leads to the evaporation of He atoms. This gives us the possibility to collect spectra in two different ways. Absorption spectra can be obtained by monitoring an increase in the number of bare tetracene ions. The advantage here is an extremely high signal-to-noise ratio since the signal increase comes from the many precursor ions tagged with different numbers of helium atoms produced in the collision chamber. The downside of this method is a broadened absorption band due to a potentially different matrix shift of Tet+Hen with different n. Alternatively, we can also monitor the depletion of the individual Tet+Hen ions, which results in narrower bands but also a much lower signal-to-noise ratio. Since the current measurements reveal a very tiny shift of the absorption bands with the variation of n, we mainly used the first method of spectra collection. The depletion spectra were used only for the exact evaluation of the position of the absorption bands. All absorption spectra have been corrected for the variation of laser intensities at different wavelengths, assuming a direct correlation between the laser power and the change in ion signal.
Results and discussion
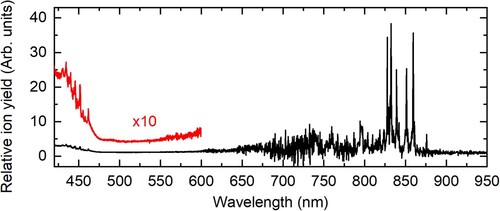
Figure shows the spectra of Tet+ recorded in the broad wavelength range from 400 to 1000 nm. The poor signal-to-noise ratio in the range between 600 and 800 nm is due to the low laser intensity in the specified range. As can be seen, the width of most absorption bands is quite small, less than 10 cm−1. This reveals that both the intrinsic width of absorption bands of Tet+ as well as the shift of the positions of absorption bands that are caused by the attachment of He atoms to Tet+, are very small. This is in drastic difference to our previous measurements of the spectra of other polyacene cations anthracene [Citation33] and heptacene [Citation34], where broad absorption bands and notable shifts of their positions with the change in n were observed. The spectrum of Tet+ shows strong absorption in the NIR range. The first strong absorption band at 859.5 nm can be assigned to the 0–0 transition from the ground state to the first electronically excited state of Tet+ based on the results of the previous measuremetns [Citation35,Citation38]. The first two electronically excited states of Tet+ are very close in energy and the transitions to these two states can cause absorption in the NIR wavelength range. The transitions to the next three electronic states of Tet+ are parity forbidden. Therefore, there is no absorption of Tet+ in most of the visible range. The increase in the yield of Tet cations started when the laser wavelength went below 470 nm. A broad band can be seen in the blue range of the spectrum. On top of this broad absorption feature, there are several weak narrow absorption bands that should be assigned to parity forbidden electronic transitions of Tet+.
Figure 1. The increase in the yield of Tet+ as a function of the laser wavelength interacting with Tet+Hen complexes.
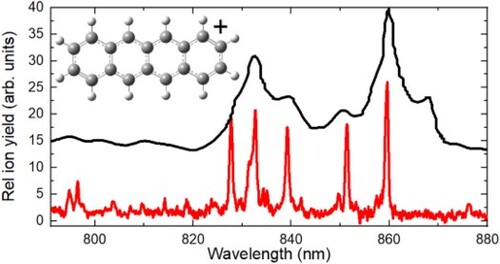
Our measurements are in general agreement with previous absorption spectra of Tet+ isolated in an Ar matrix. The comparison of the matrix isolation spectrum adopted from [Citation35] and the one obtained in our measurements is given in Figure . Almost all strong main absorption bands observed in the matrix isolation spectrum are also seen in our measurements. The only missing band is on the red side of the 0–0 bands of Tet+. In previous measurements, it was assigned to the origin band of Tet+ present in a sub-matrix site. The absence of this band in our spectra strengthens that assignment. However, the same assignment was given also to the first band on the blue side of the main 0–0 band. This band is present in our measurements at 851.4 nm (113 cm−1). Therefore, the previous assignment should be reviewed. The correct assignment is complicated due to the presence of two very close-lying electronic states. In Ref. [Citation35] the 2B2g and 2B1u symmetries of the two first electronically excited states are given. This makes the transition from the ground state (2Au) of Tet+ to the second excited electronic state parity forbidden. Therefore, all bands on the blue side from the 0–0 band, which are shown in Figure , were assigned to vibronic transitions. In the later work, however, the symmetries of the first two electronically excited states were found to be 2B2g and 2B3g which makes the transitions to both states allowed [Citation38]. We performed our calculations using time-dependent density functional theory (TD-DFT) with the 6–311G+(d,p) basis set. The obtained results are very similar to that of Ref. [Citation38]. We found two allowed electronic transitions to the first and second electronically excited states at 801 and 845 nm. Considering the low accuracy of such calculations in the determination of the energy of excited states, the obtained match is rather good and the difference of ∼650 cm−1 between the two states is within the error of these calculations. However, the calculated vibronic spectra for both electronic transitions do not match the obtained experimental spectrum. The experimental spectrum also cannot be reproduced by any combination of these two calculated spectra. The vibrational frequencies of Tet+ in the ground state (168, 310, 628, and 777 cm−1) found in ZEKE spectra [Citation17] were not detected in the experimental spectrum. This suggests that a strong vibronic coupling between the two close-lying electronically excited states modifies the spectra. This might also be the reason for a much longer lifetime of these excited states that resulted in much narrow absorption bands of Tet+ compared to many other measured PAH cations. Because the vibrational frequency of 113 cm−1 is not found in any of our computational spectra and was not reported in the previous works, we can assign the band at 859.5 nm to the 0–0 band of the first electronic transition while the band at 851.4 (113 cm–1) can be assigned to the second electronic transition. Other bands on the high-energy side could be then assigned to vibronic transitions. However, this assignment is tentative and requires further confirmation.
Figure 2. a) Comparison of spectra of Tet+ in the range of the first two electronically excited transitions obtained using the He-tagging method (bottom) and the matrix isolation technique (top, data adapted from Ref. [Citation38] and shifted to the blue by 845 cm–1). b) The spectrum of Tet+ in wavenumbers scaled relative to the origin band at 859.5 nm.
![Figure 2. a) Comparison of spectra of Tet+ in the range of the first two electronically excited transitions obtained using the He-tagging method (bottom) and the matrix isolation technique (top, data adapted from Ref. [Citation38] and shifted to the blue by 845 cm–1). b) The spectrum of Tet+ in wavenumbers scaled relative to the 000 origin band at 859.5 nm.](/cms/asset/8919a426-170f-4ebc-8def-44bc303ba73a/tmph_a_2202271_f0002_oc.jpg)
Comparison with astrophysical observations and implications
As can be seen in Figure , the most intense absorption bands of Tet+ are in the NIR range. The absorption bands in the blue side of the visible range are weak and not suitable for their detection in the observational spectra. The other strong absorption bands of Tet+ appear in the ultraviolet part of the spectrum below 400 nm. Since their intensities are comparable to the intensities of the NIR bands and the quality of the observational spectra deteriorates in the ultraviolet region, we conclude that NIR bands are best suited for the detection of Tet+ in the ISM. The five most intense absorption bands of Tet+ from Figures and are equally well suited for comparison with observational spectra. To obtain the parameters of these absorption bands that can be directly compared with the observational spectra, we evaluated the depletion of the ion signal on the masses of Tet+Hen with n = 1–9. The full width at half maximum (FWHM) and the positions of the maxima of the absorption bands (λmax) are given in Table . Unfortunately, we failed to obtain reliable parameters of the 832.5 nm (376 cm–1) band, which may be due to the presence of more than one band in this position. The gain spectrum is the sum of the spectra of Tet+Hen complexes, with n from 1 up to a few hundred, while the depletion spectrum probes only complexes with n = 1–9. This results in the shifts of λmax by up to 0.4 nm to the red in the gain spectrum and the broadening of the bands of up to 0.6 nm. The measured FWHMs of the absorption bands in the depletion spectra are often lower than the declared laser linewidth. Therefore, it is likely that our measurements reflect the linewidth of the laser and that the real FWHMs of the absorption bands of Tet+He1-9 are lower. This low bandwidth and the relatively small shift of λmax (∼0.4 nm) when comparing hundreds to nine attached He atoms suggest that further shift of λmax going from n = 1–9 to n = 0 should be extremely small, we estimate it to be less than 0.1 nm. Therefore, in the table, we give the positions of the Tet+ bands in the gas phase, which are shifted by 0.1 nm to the blue side relative to the positions of Tet+He1-9 bands. Since the real shift could be much smaller, we also provide the uncertainty of 0.1 nm in the determination of λmax.
Table 1. The parameters of the most intense absorption bands of Tet+Hen obtained from depletion (D) and gain (G) spectra and the prediction for Tet+. The FWHM and λmax are given in nanometres. The wavelengths are estimated for air. The relative integrated intensities of the bands (η) are calculated relative to the intensity of the origin band.
In the literature, no DIBs are mentioned at the positions of these Tet+ bands. We also did not find such DIBs in the observational archival spectra for several lines of sight which are commonly used for DIB searches. However, the absorption bands of Tet+ lie in a range with many strong interfering absorption bands. The absorption bands of Tet+ either have direct overlap with telluric absorption bands or lie on the shoulders of strong hydrogen absorption lines. This reduces the sensitivity of the detection of possible DIBs in this region.
The absorption bands of cations of other polyacenes such as naphthalene [Citation19], anthracene [Citation33], and heptacene [Citation34] were not detected in observational spectra either. However, the absorption bands of these, particularly those of anthracene and heptacene are much broader. High widths considerably reduce the sensitivity of the detection of the corresponding bands in observational spectra. Therefore, Tet+ is potentially best suited for its detection in the ISM among polyacenes with available experimental spectra. The present work further shows that broad absorption bands which are not comparable with most DIBs, are not a universal characteristic property of all polyacene cations, and therefore they can still be considered promising candidates for DIB carriers.
Conclusions
Our measurements reveal four absorption bands of Tet+ that are best suited for the detection in the observational spectra. The narrow width of these absorption bands makes Tet+ potentially the most easily detectable polyacene cation. It also shows that the broad absorption bands found in the studies of other polyacene cations, which greatly exceed the width of most DIBs are not characteristic of the entire class of these molecules. Since a missing match of our presently determined absorption bands of Tet+ with observational data might be related to the poor quality of the observational spectra available to us, a further search of the absorption of Tet+ in observational spectra obtained from space-based instruments is desirable. It is also desirable to record the spectra of Tet+ using a laser with a narrower linewidth than the one used in the current measurement which would allow defining the intrinsic width of the absorption bands of Tet+.
Acknowledgements
B. R. gratefully mentions a grant from the Agency for Education and Internationalisation OeAD.
Disclosure statement
No potential conflict of interest was reported by the author(s).
Additional information
Funding
References
- A. Leger and J.L. Puget, Astron. Astrophys. 137 (1), L5 (1984).
- X.J. Yang, R. Glaser, A.G. Li and J.X. Zhong, New Astron. Rev. 77, 1 (2017). doi:10.1016/j.newar.2017.01.001
- L.J. Allamandola, A.G.G.M. Tielens and J.R. Barker, Astrophys. J. 290 (1), L25 (1985). doi:10.1086/184435
- A. Leger and L. Dhendecourt, Astron. Astrophys. 146 (1), 81 (1985).
- F. Salama, E.L.O. Bakes, L.J. Allamandola and A.G.G.M. Tielens, Astrophys. J. 458 (2), 621 (1996). doi:10.1086/176844
- A. Staicu, S. Krasnokutski, G. Rouillé, T. Henning and F. Huisken, J. Mol. Struct. 786 (2-3), 105 (2006). doi:10.1016/j.molstruc.2005.10.019
- C. Jäger, S. Krasnokutski, A. Staicu, F. Huisken, H. Mutschke, T. Henning, W. Poppitz and I. Voicu, Astrophys. J. Suppl. Ser. 166 (2), 557 (2006). doi:10.1086/507272
- S. Krasnokutski, G. Rouillé and F. Huisken, Chem. Phys. Lett. 406 (4-6), 386 (2005). doi:10.1016/j.cplett.2005.02.126
- G. Rouillé, S. Krasnokutski, F. Huisken, T. Henning, O. Sukhorukov and A. Staicu, J. Chem. Phys. 120 (13), 6028 (2004). doi:10.1063/1.1651476
- F. Salama, C. Joblin and L.J. Allamandola, J. Chem. Phys. 101 (12), 10252 (1994). doi:10.1063/1.467905
- F. Salama and L.J. Allamandola, J. Chem. Soc., Faraday Trans. 89 (13), 2277 (1993). doi:10.1039/ft9938902277
- F. Salama and L.J. Allamandola, Nature. 358 (6381), 42 (1992). doi:10.1038/358042a0
- F. Salama, G.A. Galazutdinov, J. Krelowski, L. Biennier, Y. Beletsky and I.O. Song, Astrophys. J. 728 (2, (2011). doi:10.1088/0004-637X/728/2/154
- R. Ruiterkamp, N.L.J. Cox, M. Spaans, L. Kaper, B.H. Foing, F. Salama and P. Ehrenfreund, Astron. Astrophys. 432 (2), 515 (2005). doi:10.1051/0004-6361:20040331
- L. Biennier, F. Salama, L.J. Allamandola and J.J. Scherer, J. Chem. Phys. 118 (17), 7863 (2003). doi:10.1063/1.1564044
- L. Biennier, F. Salama, M. Gupta and A. O'Keefe, Chem. Phys. Lett. 387 (4-6), 287 (2004). doi:10.1016/j.cplett.2004.02.025
- J. Zhang, L.S. Pei and W. Kong, J. Chem. Phys. 128 (10, (2008). doi:10.1063/1.2837467
- P. Bréchignac, T. Pino and N. Boudin, Spectrochim. Acta. A. 57 (4), 745 (2001). doi:10.1016/S1386-1425(00)00441-8
- T. Pino, N. Boudin and P. Bréchignac, J. Chem. Phys. 111 (16), 7337 (1999). doi:10.1063/1.480105
- P. Bréchignac and T. Pino, Astron. Astrophys. 343 (2), L49 (1999).
- M. Okumura, L.I. Yeh, J.D. Myers and Y.T. Lee, J. Phys. Chem. 94 (9), 3416 (1990). doi:10.1021/j100372a014
- T.M. Kojima, N. Kobayashi and Y. Kaneko, Zeitschrift Fur Physik D-Atoms Molecules and Clusters. 22 (3), 645 (1992). doi:10.1007/BF01426367
- M. Brummer, C. Kaposta, G. Santambrogio and K.R. Asmis, J. Chem. Phys. 119 (24), 12700 (2003). doi:10.1063/1.1634254
- D. Gerlich, Adv. Chem. Phys. 82, 1 (1992).
- D. Gerlich, Phys. Scripta. T59, 256 (1995). doi:10.1088/0031-8949/1995/T59/035
- M. Brümmer, C. Kaposta, G. Santambrogio and K.R. Asmis, J. Chem. Phys. 119 (24), 12700 (2003). doi:10.1063/1.1634254
- E.K. Campbell, M. Holz, J.P. Maier, D. Gerlich, G.A.H. Walker and D. Bohlender, Astrophys. J. 822 (1, (2016). doi:10.3847/0004-637X/822/1/17
- E.K. Campbell, M. Holz and J.P. Maier, Astrophys. J. Lett. 826 (1), L4 (2016). doi:10.3847/2041-8205/826/1/L4
- G.A.H. Walker, D.A. Bohlender, J.P. Maier and E.K. Campbell, Astrophys. J. Lett. 812 (1), L8 (2015). doi:10.1088/2041-8205/812/1/L8
- G. Rouillé, S. Krasnokutski and Y. Carpentier, Astron. Astrophys. 656, A100 (2021). doi:10.1051/0004-6361/202142078
- P. Martini, S. Albertini, F. Laimer, M. Meyer, M. Gatchell, O. Echt, F. Zappa and P. Scheier, Phys. Rev. Lett. 127 (26, (2021). doi:10.1103/PhysRevLett.127.263401
- A. Omont, H.F. Bettinger and C. Tonshoff, Astron. Astrophys. 625 (2019). doi:10.1051/0004-6361/201834953
- M. Meyer, P. Martini, A. Schiller, F. Zappa, S.A. Krasnokutski and P. Scheier, Astrophys. J. 913 (2), 136 (2021). doi:10.3847/1538-4357/abf93e
- M. Meyer, P. Martini, A. Schiller, F. Zappa, S.A. Krasnokutski and P. Scheier, To appear in Astron & Astrophys (2022).
- J. Szczepanski, J. Drawdy, C. Wehlburg and M. Vala, Chem. Phys. Lett. 245 (6), 539 (1995). doi:10.1016/0009-2614(95)01049-F
- F. Laimer, L. Kranabetter, L. Tiefenthaler, S. Albertini, F. Zappa, A.M. Ellis, M. Gatchell and P. Scheier, Phys. Rev. Lett. 123 (16, (2019). doi:10.1103/PhysRevLett.123.165301
- A.J. Feinberg, F. Laimer, R.M.P. Tanyag, B. Senfftleben, Y. Ovcharenko, S. Dold, M. Gatchell, S.M.O. O'Connell-Lopez, S. Erukala, C.A. Saladrigas, B.W. Toulson, A. Hoffmann, B. Kamerin, R. Boll, A. De Fanis, P. Grychtol, T. Mazza, J. Montano, K. Setoodehnia, D. Lomidze, R. Hartmann, P. Schmidt, A. Ulmer, A. Colombo, M. Meyer, T. Moller, D. Rupp, O. Gessner, P. Scheier and A.F. Vilesov, Physical Review Research. 4 (2, (2022). doi:10.1103/PhysRevResearch.4.L022063
- J.L. Weisman, A. Mattioda, T.J. Lee, D.M. Hudgins, L.J. Allamandola, C.W. Bauschlicher and M. Head-Gordon, Phys. Chem. Chem. Phys. 7 (1), 109 (2005). doi:10.1039/b415502e