
 ?Mathematical formulae have been encoded as MathML and are displayed in this HTML version using MathJax in order to improve their display. Uncheck the box to turn MathJax off. This feature requires Javascript. Click on a formula to zoom.
ABSTRACT
We report on the characterisation of the X
ground electronic state of MgNe
by photoionisation, mass-analysed threshold-ionisation (MATI) and pulsed-field-ionisation zero-kinetic-energy photoelectron (PFI-ZEKE-PE) spectroscopy and the observation of the metastable a
state of MgNe. Rotationally cold MgNe was generated in a laser-ablation supersonic-beam source in both the X
(
) ground state and a
metastable electronic state. PFI-ZEKE-PE spectra with full resolution of the vibrational structure and partial resolution of the rotational structure were recorded from the X
ground state following resonant
two-photon excitation via selected rovibrational levels of the C
intermediate state and from the a
metastable state following single-photon excitation. The lowest six vibrational levels of the X
state were observed, covering 80% of the X
potential-well depth. The experimental data were used to determine potential-energy functions, dissociation energies, and molecular constants for the X
, a
and C
states of MgNe and the X
state of MgNe
. With dissociation energies
of 12(3) cm−1 and 10(3) cm−1, respectively, the X
and a
states of
Mg
Ne are extremely weakly bound. In contrast, the X
state of
Mg
Ne
has a dissociation energy
of 185(3) cm
and 12 bound vibrational levels. From the difference between the adiabatic ionisation energies of the X
(61 498.5(4) cm
) and the a
(39 645.1(3) cm
) states, the term value of the a
ground vibrational level is determined to be 21 853.4(5) cm
. These results are compared with those of earlier experimental studies and ab initio quantum-chemical calculations.
GRAPHICAL ABSTRACT
1. Introduction
Diatomic molecules A-Rg consisting of an alkaline-earth metal atom (A=Be, Mg, Ca, Sr, Ba, Ra) and a rare-gas atom (Rg = He, Ne, Ar, Kr, Xe, Rn) are weakly bound in the electronic ground state and represent typical examples of van der Waals complexes ([Citation1–5]). They are also the neutral precursors of doubly charged dications A-Rg, many of which are thermodynamically stable [Citation6–11].
MgNe, the molecule of interest in the present study, is a particularly elusive, extremely weakly bound molecule that is difficult to study experimentally. Spectroscopic data on MgNe are limited to a single spectrum, the rotationally resolved laser-induced-fluorescence (LIF) spectrum of the C X
transition reported by Wallace and Breckenridge [Citation1]. The analysis of this spectrum led to the determination of the equilibrium internuclear distances in the X
state (
Å) and in the C
state (
Å) as well as the ground-state dissociation energy
cm
and the ground-state fundamental vibrational interval (8.5(2) cm
) [Citation1]. To generate MgNe, Wallace and Breckenridge used a similar laser-ablation supersonic beam source as used in studies of other A-Rg molecules [Citation12–15]. However, whereas the supersonic beams usually contain A-Rg in both the X
ground and a
metastable state, the a
metastable state of MgNe could not be observed, which was attributed to this state being too weakly bound [Citation12]. Experimental information on MgNe was also obtained in studies of Mg-Ne optical collisions [Citation16] and the diffusion of Mg in Ne [Citation17]. The current knowledge on the electronic structure of MgNe originates primarily from theoretical and computational investigations of the lowest singlet and triplet states of Σ and Π symmetry [Citation3,Citation6,Citation18–20]. Without exception, these states are weakly bound, which, for the Rydberg states, can be explained by the fact that the X
ground state of MgNe
is itself weakly bound.
MgNe is equally elusive. The only spectrum reported for this cation so far concerns the A
X
(0,1) and B
X
(0,1) band systems, which Reddic and Duncan observed [Citation21] as a long progression of vibrational levels in the A
state and structureless continua for the B
state. Reddic and Duncan derived the vibrational fundamental wavenumber in the X
state (i.e.,
) to be 41 cm
and determined the spin-orbit splitting and the vibrational structure of the A
state. Ab initio calculations are also a key source of information on the electronic structure of MgNe
and have been used to confirm the assignment of the A
X
band system and to analyse the factors determining the bond strength in MgNe
[Citation6,Citation7,Citation22–24].
We report here on an experimental study of the X , C
, and a
states of MgNe and the X
state of MgNe
by high-resolution threshold-ionisation spectroscopy and present data that significantly extend our knowledge of MgNe and MgNe
.
2. Experimental setup and procedure
The experimental setup and procedure have been described in Ref. [Citation25] and were only slightly modified for the measurements presented in this work. In brief, the experimental setup consists of a laser-ablation source of Mg in a pulsed supersonic expansion of Ne, used to generate a cold molecular beam containing MgNe in the X ground state and the a
metastable state. The molecular beam passes a 3-mm-diameter skimmer located ∼26 cm downstream from the nozzle. The beam is intersected perpendicularly by one or two excitation lasers in a magnetically shielded photoexcitation region on the axis of a resistively coupled cylindrical electrode stack used to apply pulsed electric fields and extract the electrons or ions generated by photoionisation. Depending on the polarity of the electric fields, photoions or electrons are detected on a microchannel-plate (MCP) detector at the end of a time-of-flight mass spectrometer after extraction in the direction perpendicular to the axes of the molecular beam and the laser.
The MgNe molecules were photoexcited with the output of one or two Nd:YAG-pumped pulsed dye lasers after frequency doubling with β-barium-borate crystals (pulse energy 0.5 mJ, linewidth 0.1 cm). The fundamental wavenumbers of the lasers were calibrated using a commercial wavemeter with a specified accuracy of 0.02 cm
.
Two photoexcitation schemes were employed to photoionise MgNe (see Figure ). In the first scheme, ground-state MgNe molecules are photoionised in a resonance-enhanced multi-photon ionisation (REMPI) process via selected rovibrational levels of the C
intermediate state (blue arrows in Figure ). The C
X
transition was first characterised by scanning the frequency
of the first laser while keeping the frequency
fixed above the X
ionisation threshold. The pulse energy of the first laser had to be reduced to below 10 μJ to avoid power broadening. Pulsed-field ionisation zero-kinetic-energy photoelectron (PFI-ZEKE PE) spectroscopy was then used to characterise the X
state of MgNe
. In these measurements, the frequency of the first laser was kept fixed to select specific (ro)vibrational levels of the C
state, and the wavenumber
of the second laser was scanned across the ionisation thresholds. The PFI-ZEKE-PE spectra were obtained by monitoring the electrons generated by delayed pulsed field ionisation as a function of
, using a sequence of pulsed electric fields (typically
V/cm). All spectra were corrected for the field-induced shifts of the ionisation thresholds, which were determined from the PFI-ZEKE-PE spectrum of the Mg
ionising transition recorded with the same pulse sequence.
Figure 1. Excitation scheme used to study the X
ground state of MgNe
. The two-photon excitation scheme
is shown in blue and the one-photon excitation
in purple. The potential-energy functions for the X
, a
, and C
states are Morse-type functions with parameters derived from Ref. [Citation1] (
values and vibrational constants for the X
and a
state) and this work (
and vibrational constants for the C
state). The potential-energy function for the X
state (shown in red) has been derived from experimental data presented in this work (see Section 3.3 for details) and is shown enlarged in the upper inset along with horizontal bars indicating the energetic positions of all measured vibrational levels. The lower inset shows the enlarged potential-energy function of the X
state.
![Figure 1. Excitation scheme used to study the X+ 2Σ+ ground state of MgNe+. The two-photon excitation scheme X+2Σ+←C1Π←X1Σ+ is shown in blue and the one-photon excitation X+2Σ+←a3Π0 in purple. The potential-energy functions for the X 1Σ+, a 3Π0, and C 1Π states are Morse-type functions with parameters derived from Ref. [Citation1] (Re values and vibrational constants for the X 1Σ+ and a 3Π0 state) and this work (D0 and vibrational constants for the C 1Π state). The potential-energy function for the X+ 2Σ+ state (shown in red) has been derived from experimental data presented in this work (see Section 3.3 for details) and is shown enlarged in the upper inset along with horizontal bars indicating the energetic positions of all measured vibrational levels. The lower inset shows the enlarged potential-energy function of the X 1Σ+ state.](/cms/asset/63a34453-63e8-427e-bc1c-a4b933d65cfd/tmph_a_2297814_f0001_oc.jpg)
In the second excitation scheme, MgNe in the a metastable state was excited to the X
ionisation threshold in a single-photon process (purple arrow in Figure ). Photoionisation spectra and mass-analysed threshold ionisation (MATI) spectra were recorded by monitoring the ion signals generated by direct ionisation and delayed pulsed field ionisation, respectively.
3. Results
3.1.  REMPI spectra of the C X transition of MgNe
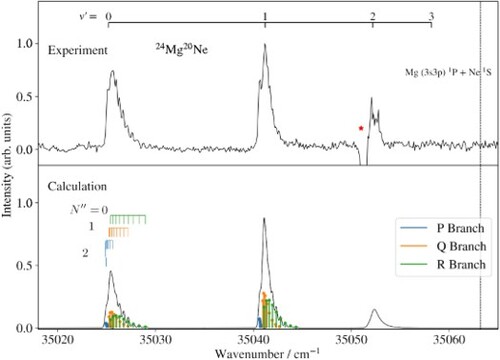
Figure (a) shows the (1+1) REMPI spectrum of the C
X
transition of
Mg
Ne. This transition was used to characterise the rotational temperature of the ground-state molecules in the molecular beam and as an intermediate step to reach the electronic ground state of MgNe
. The spectrum consists of three vibrational bands (
), two of which have been observed and assigned previously in Ref. [Citation1]. The negative signal near 35051 cm
marked by an asterisk is an artefact arising from the detector saturation caused by the very strong atomic (3s3p)
(3s
)
transition in Mg. This transition overlaps with the C
X
band, which makes the determination of the band origin less precise.
Figure 2. Experimental (a) and calculated (b) REMPI spectra of the
Mg
Ne C
X
(
) transition normalised to the maximal intensity. The blue, orange, and green bars indicate the positions of the P-, Q-, and R-branch lines, respectively. The numbers along the assignment bars in (b) correspond to the rotational-angular-momentum quantum number
of the X
ground state. The negative peak marked with an asterisk corresponds to the (3s3p)
(3s
)
transition of Mg. The vertical line marks the position of the dissociation limit Mg (3s3p)
P + Ne
S
. (c) Predicted REMPI spectrum of the C
X
(
) transitions.
All bands show partially resolved rotational structures. The observed and calculated rotational structure and band contours obtained after a least-squares fit of the band origins and rotational constants are compared in Figure (b). The X and the C
states are both well described by Hund's angular-momentum-coupling case (b), and their rotational levels are labelled with the quantum numbers
and
of the total angular momenta without spin of the X
and C
states, respectively. Each vibrational band consists of three rotational branches, which are depicted as coloured sticks:
(R branch, green),
(Q branch, orange), and
(P branch, blue). The assignment bars above the calculated spectrum indicate the initial-state rotational quantum number
.
To model the line intensities, we applied the standard expression for a Hund's case (b) to (b) transition [Citation26] and assumed a thermal distribution of the ground-state rotational levels. Additionally, the relative band intensities were estimated from Franck-Condon factors determined from the Morse-type potentials using parameters derived in Ref. [Citation1] and this work (see Section 3.3.2 for more details). The calculated relative intensities of the C X
transitions are 0.30, 0.59, and 0.11.
The rotational structure of the C (0) − X
(0) band could be adequately reproduced with the rotational constants reported in Ref. [Citation1] for the X
(0) and C
(0) states. In the analysis of the
band, the rotational constant
was adjusted to best match the measured spectrum. The band origin is slightly lower than reported in Ref. [Citation1], and the difference is attributed to the background signal observed in the LIF spectrum. The Mg resonance overlapping with the
band prevented the determination of the rotational constant of the C
(2) level (see Figure (a)).
The experimental and calculated spectra agree best for a rotational temperature of 3 K and a full width at half maximum of 0.2 cm
, which corresponds to the bandwidth of the first laser. Table lists the origins and rotational constants obtained for the three measured C
X
vibrational bands. Our results agree well with the values reported by Wallace and Breckenridge [Citation1] and complement them.
Table 1. Band origins of the C
X
transition of
Mg
Ne, vibrational term values
and rotational constants
of the C
state.
The measured spectrum does not show any lines at the calculated position of the C X
(0) band, which is indicated above the experimental spectrum in Figure (a). Based on the dissociation energy and the potential-energy function of the C
state determined from our spectra (see Section 3.3 for details), the potential of the C
state should only support four bound vibrational states. The estimated Franck-Condon factor of the C
X
transition is only 0.001, which explains why this transition could not be observed in our spectrum. The Mg (3s3p)
P + Ne
S
dissociation threshold is marked by the vertical line in Figure .
In the LIF spectrum of Ref. [Citation1], the C X
hot band was also observed but the C
X
band could not be detected. Our measurements do not show any hot bands, indicating a lower vibrational temperature in our MgNe supersonic beam. The calculated spectrum for the C
X
progression is displayed in Figure (c), where the band intensities correspond to Franck-Condon factors calculated from the potential-energy functions. The Franck-Condon factor for the C
X
band is negligibly small, which explains the absence of this band in the LIF spectrum of Wallace and Breckenridge [Citation1]. The calculated Franck-Condon factors for the C
X
bands are significant, but these bands are obscured by the Mg background in the LIF spectrum and could not be observed.
3.2. The X ground state of MgNe
The X
ground state of MgNe
was characterised by PFI-ZEKE PE and MATI spectroscopy following (i) two-photon excitation from the neutral ground state via the C
state and (ii) single-photon excitation from the metastable a
state. The two-photon excitation scheme offers the advantage of selecting individual isotopologues and subsets of rotational levels of the intermediate C
state, which simplifies the spectra and facilitates their assignment. Moreover, vibrationally excited levels of the C
state can be used to access higher vibrational levels of the X
ground state of MgNe
. This scheme also circumvents experimental challenges associated with the strong Mg
-ion (and electron) background arising in scheme (ii) because the X
a
ionisation thresholds are located near the atomic Mg
(3s)
Mg (3s3p)
P
ionisation threshold. As a side benefit, measuring transitions to the ionic ground state from both the X
ground state and the a
metastable state enables one to determine the relative positions of the singlet and triplet manifolds of MgNe.
3.2.1. The MgNe X MgNe C ionising transition
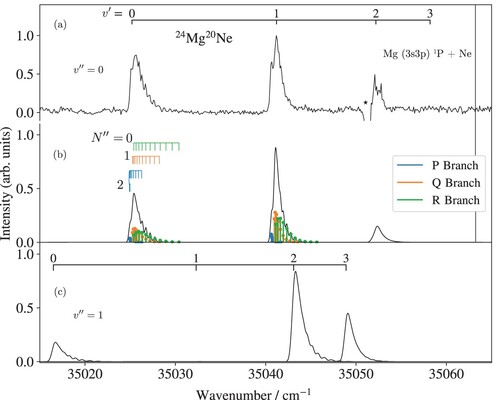
Figure compares the photoionisation spectrum of Mg
Ne in panel (a) with the PFI-ZEKE-PE spectrum of the X
ground state in panel (b), both recorded from the C
(1) state. For the overview spectra in Figure , the wavenumber of the first laser (
cm
) within the C
X
(0) band was chosen so as to minimise the contribution of other isotopologues.
Figure 3. (a) Photoionisation spectrum of Mg
Ne in the vicinity of the X
C
ionisation thresholds. The inset compares the photoionisation spectra of MgNe recorded from the C
(black trace) and from the a
state (red trace) shifted by
cm
. (b) Measured and (c) calculated PFI-ZEKE PE spectrum of the X
C
transition. Lines marked by an asterisk correspond to Mg ionisation thresholds. The vertical line indicates the position of the Mg
Ne dissociation threshold. See text for details.
The photoionisation spectrum exhibits a sharp rise of the MgNe ion signal at the position of the X
(0) ionisation threshold. The ion signal then increases stepwise each time the wavenumber of the second laser passes a new vibrational threshold. The amplitudes of the successive steps are related to the Franck-Condon factors of the corresponding X
C
(1) transition. This behaviour was not observed in similar measurements in MgRg (Rg = Ar, Kr, Xe) [Citation25,Citation27], where autoionisation resonances dominate the photoionisation spectra near the X
ionisation threshold. This difference indicates that the Rydberg states of MgNe belonging to series converging to vibrationally excited levels of MgNe
decay by predissociation rather than by autoionisation, whereas, in MgAr, MgKr and MgXe autoionisation dominates over predissociation. The likely explanation for the dominant role of predissociation in MgNe Rydberg states is the more weakly bound nature of the X
state, which implies that the vibrational wavefunctions of the Rydberg states converging on the X
(
) levels extend to large internuclear distances, where crossings with repulsive potential-energy functions are unavoidable.
The PFI-ZEKE-PE spectrum consists of eight lines, the first six of which are part of the vibrational progression of the X
state. The absolute vibrational assignment indicated above the measured spectrum is based on the correlation of the onset of the photoionisation signal with the lowest vibrational level (
). The adiabatic ionisation energy of the X
state of MgNe obtained with this vibrational assignment (
cm
) also agrees with the ionisation energy (
cm
) predicted from a thermochemical cycle using ab initio values for the dissociation energies [Citation6,Citation7] and the precisely known ionisation energy of Mg. The two lines marked with asterisks in Figure (b) can be attributed to ionising transitions of Mg. The weaker one corresponds to the single-photon Mg
(3s)
Mg (3s3p) ionisation threshold and the stronger one to the non-resonant two-photon Mg
(3s)
Mg (3s
) ionisation threshold, as verified by recording the corresponding MATI spectrum at the
Mg
mass (not shown). The vertical line in Figure (a,b) indicates the position of the Mg
(3s) + Ne dissociation limit determined in the analysis of the potential-energy functions (see Section 3.3.1). The MgNe
X
state is weakly bound (
cm
) and the observed vibrational levels cover
of the potential-well depth.
The X
C
PFI-ZEKE-PE spectrum was recorded from both the
and
vibrational levels, and the observed band positions are listed in Table . We performed a rotational-contour analysis of each vibrational band to determine the band centres. The rotational structure of the X
C
transition is well described by a Hund's case (b) to (b) transition. The rotational constants of the upper state were fixed to values calculated ab initio, as reported in Ref. [Citation7]. The populations of the rotational levels of the intermediate C
state selected in the first excitation step were reconstructed from the stick spectrum of the C
X
(0) transition (see Figure (b)) taking into account the excitation bandwidth and the saturation of the C
X
transition, which led to a Gaussian profile with a full width at half maximum of 0.5 cm
. These populations were then used as factors multiplying the rovibrational line intensities for a Hund's case (b) to (b) photoionising transition according to the expression derived by Buckingham, Orr, and Sichel [Citation28]
(1)
(1) In Equation (Equation1
(1)
(1) ),
is the angular-momentum quantum number associated with a single-centre expansion of the C
state orbital out of which the photoelectron is ejected,
is the corresponding projection quantum number on the internuclear axis, and
the coefficients of the single-centre expansion. In photoelectron spectroscopy, more rotational branches are observed than the P, Q and R branches seen in optical spectra because the photoelectron can take away angular momentum. The best agreement between calculated and experimental photoelectron spectra was achieved with
and
for
and 3, respectively. The term values
derived from this analysis for the two progressions X
C
agree with each other within the experimental uncertainties.
Table 2. Origins of the bands observed in the PFI-ZEKE-PE spectrum of the X
C
ionising transition of
Mg
Ne
, observed term values
, deviations
from term values calculated from the potential-energy function presented in Section 3.3, and calculated rotational constants
of the X
(
) vibrational levels. All values in cm
.
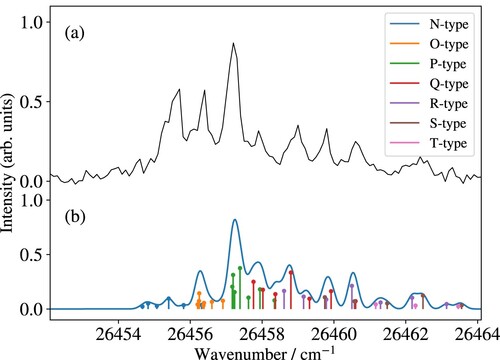
An example of a partially resolved rotational spectrum of the X C
transition measured at higher resolution is presented in panel (a) of Figure , where it is compared with the calculated spectrum in panel (b). Overall, the calculations reproduce the rotational structure well, except for two rotational lines of the N-type branch on the low-wavenumber side, which are underestimated in the calculated spectrum. We attribute this deviation to rotational channel interactions, which tend to enhance the intensity of rotational branches with negative values of
, as discussed in Ref. [Citation29].
Figure 4. Measured (a) and calculated (b) PFI-ZEKE-PE spectra of the X C
transition of MgNe. The sticks indicate the positions and intensities of individual rovibronic photoionising transitions, classified in different branches according to the value of
(see colour code).
Harmonic and anharmonic vibrational constants for the X
state of MgNe
were determined through a least-squares fit of the standard polynomial expansion of the vibrational term values [Citation30] to the experimentally measured vibrational band origins. The results are summarised in Table and agree well with calculated values reported in earlier work [Citation7].
Figure (c) displays the calculated PFI-ZEKE-PE spectrum of the X
C
ionising transition, using Franck-Condon factors estimated from the potential-energy functions derived as discussed in Section 3.3.1. The calculated and experimental intensities for high vibrational levels are in good agreement, but the calculation underestimates the line intensities of the transitions to the lowest X
vibrational levels. This discrepancy could originate from the R dependence of the electric-dipole moment, which is not considered in the calculation of the Franck-Condon factors.
3.2.2. The MgNe X MgNe a ionising transition
The X
ground state of MgNe
can be reached from the a
metastable state of MgNe in a single-photon excitation process. However, the transition frequency is very close to the atomic Mg
(3s)
Mg (3p3s)
P
(J = 0−2) photoionisation transitions, which produce a strong background signal of electrons or ions. This background prevented us from recording PFI-ZEKE-PE spectra of the MgNe
X
MgNe a
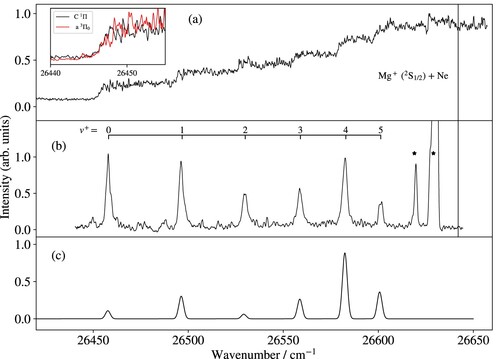
transition. Consequently, only photoionisation and MATI spectra could be measured in this case and are displayed in Figure (a,b), respectively. As in the case of the X
C
ionising transition, discrete steps are observed in the photoionisation spectrum at the positions of the vibrational levels of the X
state. The negative signals marked by asterisks are artefacts from the Mg
-ion background.
Figure 5. (a) Photoionisation spectrum of Mg
Ne in the vicinity of the X
a
ionisation thresholds. (b) Measured and (c) calculated MATI spectrum of the X
a
transition. Lines marked by an asterisk correspond to artefacts from the saturation of the MCP detector at the positions of strong Mg lines.
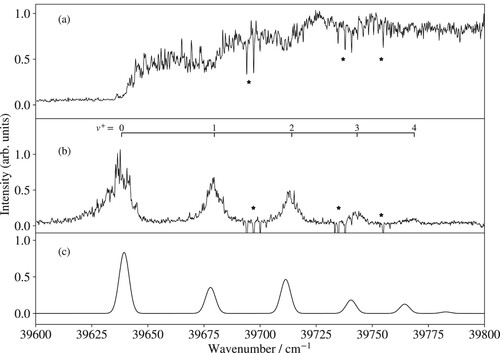
The inset of Figure compares the photoionisation spectra of Mg
Ne in the vicinity of the adiabatic ionisation threshold recorded from the a
state (in red) and the C
state (in black) under otherwise identical experimental conditions. For the comparison, the spectrum of the a
state was shifted by
cm
to match the onset of the ionisation threshold. This shift corresponds to the energetic difference between the a
(0) and the C
(1) states. Using the C
X
interval (35 041.15(20) cm
, see Table ), the term value of the a
metastable state of MgNe with respect to the X
ground state is determined to be 21 853.4(5) cm
.
Figure (c) displays the calculated MATI spectrum of the MgNe X
MgNe a
ionising transition. The positions of the band origins are calculated using the vibrational term values of the X
state (see Table ) and the term value of the a
state determined from the photoionisation spectrum. The relative intensities correspond to Franck-Condon factors calculated from the potential-energy functions reported in Section 3.3. The lines were modelled using a Gaussian line shape with a full width at half maximum of 5 cm
, corresponding to the expected linewidth resulting from the unresolved rotational structure and the electric-field pulse sequence used for field ionisation. To obtain a satisfactory agreement with the measured intensity distribution, the equilibrium distance of the potential of the a
state is assumed to be 6.8
, which is less than the value of 7.7
obtained ab initio by Leung et al. [Citation12]. However, given the very weakly bound nature of the a
state, it is questionable whether a Franck-Condon analysis based on Morse-type functions can give reliable values for the equilibrium geometry.
3.3. Determination of potential-energy functions
3.3.1. Potential-energy function of the X state
The vibrational progressions observed in the PFI-ZEKE-PE and MATI spectra of MgNe do not extend to the dissociation threshold Mg (3s)
S
S
. It was nevertheless possible to determine the dissociation energy of the ground state of MgNe
from the measured vibrational levels by reconstructing the potential-energy function of the X
state from the experimental data. We used the model potential-energy function
(2)
(2) to calculate vibrational energies by numerically solving the Schrödinger equation for the nuclear motion (in atomic units)
(3)
(3) We followed the same procedure as in our studies of MgAr
[Citation27,Citation31] and MgKr
[Citation25] and only summarise the main aspects here. The potential-energy function in Equation (Equation2
(2)
(2) ) comprises two Morse-type terms to describe the short-range interaction and a long-range interaction term
. The parameters A and C are related to the well depth
and the equilibrium internuclear distance
.
accounts for the dominant electrostatic interaction between Mg
(3s) and Ne and is expressed in atomic units as
(4)
(4) where
is the polarisability volume of neon and
is a term grouping together the charge–induced-quadrupole interaction and the dispersion interaction. The quadrupole polarisability volume of neon
and the dispersion coefficient
are taken from Refs. [Citation32] and [Citation20], respectively. We kept
and
fixed at the values of 2.57
[Citation33] and 24.79
. The switch functions
(5)
(5) ensure a smooth change from the short-range to the long-range part of the potential [Citation34]. When fitting the potential parameters to the experimental data, we fixed the value of
to the ab initio value calculated by Gardner et al. [Citation7]. Consequently, only three parameters were fitted:
, b, and ρ. The potential parameters determined in this analysis are summarised in Table and the differences between the calculated and observed term values
are listed in the fifth column of Table . The potential-energy function is displayed in the inset of Figure , where horizontal lines indicate the positions of the observed vibrational levels. The vibrational wavefunctions extend to internuclear separations beyond 10
and are sensitive to the long-range part of the potential. We therefore expect that this analysis provides a reliable estimate of the dissociation energy. We find a
value of 185(3) cm
, which is in good agreement with the ab initio value of 182.3 cm
calculated by Gardner et al. [Citation7], but larger than the value of 159.5 cm
reported in Ref. [Citation6]. Using the dissociation energy of the X
state of MgNe
, the dissociation energies of the neutral ground state (
cm
), the a
metastable state (
cm
) and the C
state (
cm
) can be derived using a simple thermochemical cycle involving the known ionisation energies of the (3s
)
S
, (3s3p)
P
, and (3s3p)
P states of Mg [Citation35] (see Table ).
Table 3. Parameters describing the potential-energy function of the X
state, obtained in a least-squares fit to the experimental term values.
Table 4. Molecular constants of the X , a
and C
states of MgNe and of the X
state of MgNe
.
3.3.2. Potential-energy functions of the X , a , and C states
Calculations of Franck-Condon factors for all transitions measured in this work require potential-energy functions for the X , a
, and C
states of MgNe, which we described with Morse potentials. Parameters for the X
and C
states were taken from this work and Ref. [Citation1], respectively. The dissociation energies of all states were fixed to the values reported above. Franck-Condon factors are particularly sensitive to the value of
. We found the best agreement between the calculated and predicted line intensities for both the C
X
and the X
C
transition for an
value of 7.43
for the C
state, which is slightly higher than reported in Ref. [Citation1]. Calculated parameters from Ref. [Citation12] were used to describe the Morse potential of the a
state. The intensity distribution observed in our MATI spectra of the MgNe
X
MgNe a
ionising transition only matches with the calculated Franck-Condon factors if we assume a significantly smaller
value for the a
state (6.8
vs. 7.75
[Citation12]), which we do not consider plausible given the high quality of the analysis reported in Ref. [Citation12]. Instead, we suspect that the Franck-Condon approximation could be inadequate in this case because the vibrational wavefunctions cover a large R-range. Consequently, the assumption that the electric dipole moment is independent of R may not be valid (see also Section 3.2.1).
4. Conclusion
We have presented a high-resolution spectroscopic investigation of the threshold-photoionisation and PFI-ZEKE-PE spectra of MgNe. Rotationally cold MgNe molecules ( K) were generated in a laser-ablation supersonic-expansion source, both in the X
ground state and the a
metastable state, which was observed for the first time. Molecular constants and potential-energy functions were derived for the X
, a
, and C
states of MgNe and the X
state of MgNe
. The new data, which include accurate dissociation energies and adiabatic ionisation energies, are compared with the results of ab initio calculations [Citation6,Citation7,Citation12] and of previous experimental studies by laser-induced fluorescence [Citation1] and photodissociation spectroscopy [Citation21] and considerably extend our knowledge on MgNe and MgNe
.
Before the present work, only the lowest two vibrational levels of the X
ground state of MgNe
had been observed experimentally [Citation21]. The vibrational levels of the X
state studied here extend over 80% of the potential-well depth, allowing for the determination of the dissociation energy
cm
of the X
state of MgNe
through a fit of the potential-energy function. With this value, the dissociation energies of the X
, a
, and C
states of MgNe were derived from thermochemical cycles using the value of
and the well-known term values of Mg [Citation35]. A remarkable property of MgNe is that both its ground electronic state and its metastable triplet state are extremely weakly bound, with
values of only 12(3) cm
and 10(3) cm
, respectively, and it is surprising that a significant MgNe population can be generated in the supersonic expansion after laser ablation.
In its X ground electronic state, MgNe can be regarded as consisting of two closed-(sub)shell atoms. Its dissociation energy
(12(3) cm
) is similar of that of Ne
(
cm
[Citation36]). The nature of the bond in this molecule thus essentially originates from the long-range (van der Waals) interaction between Ne and Mg. The weak bond in the metastable a
state of MgNe and the X
ground state of MgNe
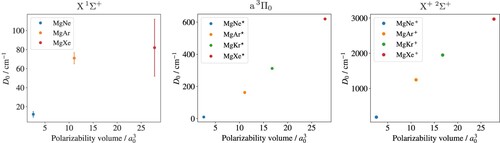
also indicate the long-range-force origin of the binding interaction. Figure compares experimental values of the dissociation energies
of these three states in the series MgNe, MgAr (X: [Citation37], a and X
: [Citation38]), MgKr (a and X
: [Citation25]), and MgXe (X: [Citation15], a and X
: [Citation39]). To emphasise the long-range nature of the bonding interactions, the
values are displayed as a function of the polarisabilities of the rare-gas atoms from Ref [Citation40]. The stronger bonds and the almost perfectly linear dependence observed in the case of the MgRg
ground state reflect the dominance of the charge–induced-dipole interaction (
). In the case of the a
state, contributions to the bond strength originating from the spin-orbit interaction and the Mg(3p) quadrupole are expected in addition to the dispersion interaction [Citation12]. In the case of MgNe, the long-range and spin-orbit interaction accidentally combine so that the binding energies of the X
and the a
states are almost identical. In all other cases, the bond in the a
state is almost four times stronger than in the X
ground state.
Figure 6. Comparison of experimental values of the dissociation energies of the X
, a
, and X
states of the series MgNe, MgAr, MgKr, and MgXe, as a function of the polarisabilities of the rare-gas atoms.
Acknowledgments
We thank Josef A. Agner and Hansjürg Schmutz for their technical assistance.
Disclosure statement
No potential conflict of interest was reported by the author(s).
Correction Statement
This article has been corrected with minor changes. These changes do not impact the academic content of the article.
Additional information
Funding
References
- I. Wallace and W.H. Breckenridge, J. Chem. Phys. 98 (4), 2768–2773 (1993). doi:10.1063/1.464158.
- D.J. Funk, W.H. Breckenridge, J. Simons and G. Chałasiński, J. Chem. Phys. 91 (2), 1114–1120 (1989). doi:10.1063/1.457630.
- C. Crépin-Gilbert and A. Tramer, Int. Rev. Phys. Chem. 18 (4), 485–556 (1999). doi:10.1080/014423599229901.
- J. Mitroy and J.Z. Zhang, J. Chem. Phys. 128 (13), 134305 (2008). doi:10.1063/1.2841470.
- S. Saidi, N. Alharzali and H. Berriche, Mol. Phys. 115 (8), 931–941 (2017). doi:10.1080/00268976.2017.1292368.
- A.W.K. Leung, R.R. Julian and W.H. Breckenridge, J. Chem. Phys. 110 (17), 8443 (1999). doi:10.1063/1.478805.
- A.M. Gardner, C.D. Withers, J.B. Graneek, T.G. Wright, L.A. Viehland and W.H. Breckenridge, J. Phys. Chem. A 114 (28), 7631–7641 (2010). doi:10.1021/jp103836t.
- S. Falcinelli, F. Fernández-Alonso, K.S. Kalogerakis and R.N. Zare, Mol. Phys. 88 (3), 663–672 (1996). doi:10.1080/00268979609482445.
- D. Mathur, Phys. Rep. 391 (1–2), 1–118 (2004). doi:10.1016/j.physrep.2003.10.016.
- S. Falcinelli and M. Rosi, Molecules 25 (18), 4157 (2020). doi:10.3390/molecules25184157.
- D. Wehrli, M. Génévriez and F. Merkt, Phys. Chem. Chem. Phys. 23 (18), 10978–10987 (2021). doi:10.1039/D1CP00730K.
- A.W.K. Leung, R.R. Julian and W.H. Breckenridge, Chem. Phys. Lett. 301 (3–4), 325–330 (1999). doi:10.1016/S0009-2614(99)00049-4.
- J.G. Kaup and W.H. Breckenridge, J. Chem. Phys. 107 (16), 6005–6013 (1997). doi:10.1063/1.474269.
- S. Massick and W.H. Breckenridge, J. Chem. Phys. 104 (19), 7784–7787 (1996). doi:10.1063/1.471657.
- J.G. McCaffrey, D.J. Funk and W.H. Breckenridge, J. Chem. Phys. 99 (12), 9472–9481 (1993). doi:10.1063/1.465482.
- R.A. Lasell, B.S. Bayram, M.D. Havey, D.V. Kupriyanov and S.V. Subbotin, Phys. Rev. A 56 (3), 2095–2108 (1997). doi:10.1103/PhysRevA.56.2095.
- T.P. Redko, I.M. Rusinov and A.B. Blagoev, J. Phys. B: At. Mol. Opt. Phys. 26 (1), 107–111 (1993). doi:10.1088/0953-4075/26/1/010.
- E. Czuchaj, H. Stoll and H. Preuss, J. Phys. B: At. Mol. Phys. 20 (7), 1487–1507 (1987). doi:10.1088/0022-3700/20/7/017.
- A.M. Sapse, J. Phys. Chem. A 106 (5), 483–784 (2002). doi:10.1021/jp0123482.
- J. Mitroy and J.Y. Zhang, Eur. Phys. J. D 46 (3), 415–424 (2008). doi:10.1140/epjd/e2007-00320-5.
- J.E. Reddic and M.A. Duncan, J. Chem. Phys. 110 (20), 9948 (1999). doi:10.1063/1.478867.
- K.L. Burns, D. Bellert, A.W.K. Leung and W.H. Breckenridge, J. Chem. Phys. 114 (18), 7877–7885 (2001). doi:10.1063/1.1361250.
- K.L. Burns, D. Bellert, A.W.K. Leung and W.H. Breckenridge, J. Chem. Phys. 114 (18), 2996 (2001). doi:10.1063/1.1328748.
- H. Partridge, C.W. Bauschlicher and S.R. Langhoff, J. Phys. Chem. 96 (13), 5350–5355 (1992). doi:10.1021/j100192a032.
- C. Kreis, M. Holdener, M. Génévriez and F. Merkt, Mol. Phys. 121 (17–18), e2152746 (2023). doi:10.1080/00268976.2022.2152746.
- R.N. Zare, Angular Momentum (John Wiley & Sons, New York, 1988).
- D. Wehrli, M. Génévriez, C. Kreis, J.A. Agner and F. Merkt, J. Phys. Chem. A 124 (2), 379–385 (2020). doi:10.1021/acs.jpca.9b10435.
- A.D. Buckingham, B.J. Orr and J.M. Sichel, Phil. Trans. R. Soc. London Ser. A 268 (1184), 147–157 (1970). doi:10.1098/rsta.1970.0068.
- F. Merkt and T.P. Softley, Int. Rev. Phys. Chem. 12 (2), 205–239 (1993). doi:10.1080/01442359309353282.
- G. Herzberg, Molecular Spectra and Molecular Structure, Volume I, Spectra of Diatomic Molecules, 2nd ed. (Van Nostrand Reinhold Company, New York, 1950).
- M. Génévriez, D. Wehrli, T. Berglitsch and F. Merkt, Phys. Rev. A 104 (4), 042811 (2021). doi:10.1103/PhysRevA.104.042811.
- J.M. Standard and P.R. Certain, J. Chem. Phys. 83 (6), 3002–3008 (1985). doi:10.1063/1.449203.
- T.N. Olney, N.M. Cann, G. Cooper and C.E. Brion, Chem. Phys. 223 (1), 59–98 (1997). doi:10.1016/S0301-0104(97)00145-6.
- C. Douketis, G. Scoles, S. Marchetti, M. Zen and A.J. Thakkar, J. Chem. Phys. 76 (6), 3057 (1982). doi:10.1063/1.443345.
- A. Kramida, Y. Ralchenko and J. Reader, NIST ASD Team, NIST Atomic Spectra Database (ver. 5.10) (2022).
- A. Wüest and F. Merkt, J. Chem. Phys. 118 (19), 8807–8812 (2003). doi:10.1063/1.1566944.
- R.R. Bennett, J.G. McCaffrey, I. Wallace, D.J. Funk, A. Kowalski and W.H. Breckenridge, J. Chem. Phys. 90 (4), 2139–2147 (1989). doi:10.1063/1.456008.
- M. Génévriez, D. Wehrli and F. Merkt, J. Chem. Phys. 153 (7), 074311 (2020). doi:10.1063/5.0015608.
- C. Kreis and F. Merkt, to be published.
- J.E. Rice, P.R. Taylor, T.J. Lee and J. Almlöf, J. Chem. Phys. 94 (7), 4972–4979 (1991). doi:10.1063/1.460533.