
 ?Mathematical formulae have been encoded as MathML and are displayed in this HTML version using MathJax in order to improve their display. Uncheck the box to turn MathJax off. This feature requires Javascript. Click on a formula to zoom.
Abstract
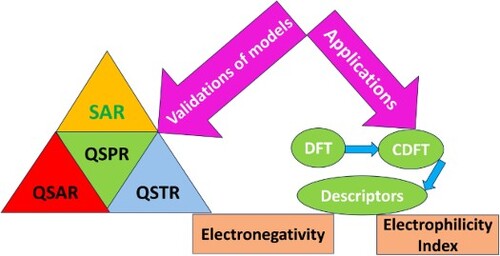
To predict the biological effects of chemical compounds based on mathematical and statistical relationships, quantitative structure–activity relationship (QSAR) approach is used. Based on the molecular characteristics of diverse substances, Quantitative Structure–Property Relationship (QSPR) techniques estimate the physiochemical attributes whereas Quantitative Structure Toxicity Relationship (QSTR) is used as a link between the molecular structure of species and its toxicity. These ligand-based computational screening methods offer a cost-effective replacement for laboratory-based screening procedures. Different QSTR models are established to understand the biological activities related to toxicity. Density Functional Theory (DFT) and ab-initio techniques are used to examine external acute toxicity using Quantum Chemical (QC) descriptors and the electron correlation contribution. Conceptual Density Functional Theory (CDFT) based global and local descriptors have wide applications in analysing various physical and chemical characteristics of chemical species. The descriptors like chemical hardness, electronegativity, electrophilicity index, HOMO–LUMO energy, and enthalpy are found reliable to predict the model in terms of available experimental data. Various mathematical models are established through Multi Linear Regression (MLR) analysis which links the calculated descriptors with their biological activities. In this review, the applications of CDFT-based descriptors, are described in detail for QSAR / QSPR/ QSTR studies.
GRAPHICAL ABSTRACT
1. Introduction
Molecular interaction with all kinds of life constituent parts including DNA, enzymes, cells, and membranes is a core area of research. Several researchers have been doing a study to reveal the relationship between the physical and chemical properties of any molecule with the topology and electronic structure of that particular system. Modern research in the domain of chemical sciences has made a significant progress in understanding the technique for associating the structure and properties of a compound. Even though an organic compound's structural formula contains all of its chemical, biological, and physical characteristics encoded in it, the investigation of the correlation between topology and property is still complex and challenging. The domain involved in exploring the association among the structure and property of chemical species is defined as the Quantitative structure–activity Relationship (QSAR) and Quantitative Structure–Property relationship (QSPR). The QSAR / QSPR correlates the structure, property, and activity of compounds [Citation1].
Quantitative techniques (QSAR, QSPR) reveal that chemical activity is associated with chemical structures. It is a significant activity-structural relationship and can be established as a function of expected physio-chemical characteristics [Citation2]. The use of such a system for activity estimation may be used to study various physicochemical properties of chemical species, for example, to check potential compounds or provide recommendations for new lead molecule synthesis. Once the relationship between structure and activity/property is established, any molecular systems including ones that are yet to be synthesised can be easily identified to choose configurations with the ideal features. The main concept of these techniques is that the topology of a chemical species governs its properties. The primary goal of QSAR is to find the new compounds with the necessary properties based on chemical insight and computational approaches. This concept is also known as the Structure–Activity Relationship (SAR). In drug development procedures, QSAR is a numerical tool for determining connections amongst chemical structure as well as pharmacological qualities, i.e. biological activity [Citation3]. QSAR/QSPR relationship has evolved over the past few decades into an important technique for linking the characteristics of complex molecular systems in various contexts [Citation4]. QSAR methods were established by eminent scientists Hansch and Fujita [Citation5]. The QSAR approach is efficaciously applied in various domains, especially in designing drug agrochemical compounds [Citation6]. There are several efforts based on the SAR approach to predict the toxicity and other physicochemical properties that are reported [Citation7–9]. It is really challenging to understand toxicity [Citation10]. The study suggests that the SAR approach is a vital and important tool for understanding physicochemical properties, especially in drug designing and therapeutic advancements [Citation9,Citation11]. Saliner et al. [Citation9,Citation12] reported the primary computational approaches. It is established that the SAR approach is spreading its applications in several domains of science and technology [Citation13–18]. Among the natural sciences, quantitative structure–property / activity relationship (QSPRs/QSARs) is a comparatively recent domain. The QSPR/QSAR techniques have a wide range of objectives, however, the following are perhaps the most important ones:
Forecasting the physicochemical activities of different elements and their subsequent effects on the environment [Citation19–26]
Predicting the biochemical actions of different materials in ecological and therapeutic traits [Citation5] and
Choosing substances that might be potential contenders for the role being defined [Citation27,Citation28].
The heat capacity, electrical, physicochemical, and biochemical circumstances, the porosity, the Zeta potential of nanomaterials, exposure length, irradiation, darkness, etc., all affected the outcomes of traditional studies. The ‘evidence surroundings’ (available datasets) ‘numerical positions’ (diversity of chemicals in datasets), and user inclination, are factors in computational studies connected to QSPR/QSAR [Citation28].
In the 1940s, Wiener conducted a ground-breaking research in the area of ‘molecular structure-macro-effect of a drug’ association [Citation29–31]. The history of QSPR/QSAR began with this. In other words, this is the beginning of the development of the QSPR/QSAR concept and application. During this time, the foremost goal of the QSPR/QSAR was to create a relationship between an endpoint and a descriptor for a group of chemicals. The overall combinations in the set, the correlation coefficient, the standard inaccuracy of assessment, and the Fischer F-ratio were the four measures for evaluating the superiority of such models [Citation32,Citation33]. The foundation of the QSPR/QSAR model and preparation during this time was the family of topological keys [Citation9–36], keys based on the mathematical system of information [Citation37–45], numerous 3D descriptors [Citation46–49], and descriptors of quantum mechanics [Citation50–52]. The descriptors were thoroughly proven to be beneficial in QSAR research, and they were employed as an extent of structural resemblance or variety. In machine learning, the computation time can be reduced and estimated performance may be improved [Citation53]. Selecting descriptors is important for various reasons in addition to (1) The resulting model becomes more interpretable and easier to understand, (2) It reduces overfitting resulting from noisy superfluous molecular descriptors, (3) It offers a faster and more well-organised model and (4) It rejects activity cliff [Citation54].
However, the QSPR/QSAR research had come under heavy fire because there were no rigorous statistical verifications of these models. This critique persisted up until this point [Citation55,Citation56]. At a symposium conducted in Setubal, Portugal in 2002, a set of guidelines for assessing the reliability of QSAR models were put forth. Additionally, the OECD principles (Organisation for Economic Co-operation and Development) http://www.oecd.org/chemicalsafety/risk-assessment/37849783.pdf renamed these principles. The second phase of QSPR/QSAR history is introduced by the OECD standards, which state that correlations should also be evaluated for their predictive power [Citation57]. QSAR is the result of computer progressions that started with a proper depiction of molecular configuration and accomplished with some inferences, hypotheses, and forecasts about the behaviour of molecules in the environmental, physicochemical, and biological structures under consideration [Citation58]. QSAR computations produce a set of mathematical balances that relate chemical structure to biological activities [Citation58–60].
1.1. Computational work over experimental work
Computational work is highly critical in scientific study, notably in chemistry, biology, and material science. There are some significant reasons which can justify the importance of computational work and provide the idea about how computational work compliments the experimental work:
Economical and time effective: It is much more cost-effective and time-efficient as compared to experimental work. Computational simulations can also produce data considerably faster than physical tests, allowing researchers to investigate a broader variety of possibilities in less time.
Prediction and hypothesis: A computational model or simulation allows us to predict and generate hypotheses before an experiment. To gain a deeper understanding of systems, researchers simulate molecular interactions, chemical reactions, or biological processes.
Reconnoiter inaccessible compounds: Computational approaches can be used to investigate systems that are difficult or impossible to access experimentally under severe conditions, such as high temperatures or pressure
Knowledge of mechanism: Computational models can aid in the understanding of complicated mechanisms that underpin biological, chemical, and physical phenomena.
Data analysis and interpretation: Interpreting and analysing experimental data requires the use of computational tools and algorithms that allow researchers to extract useful information, detect trends, and connect variables.
Computational approaches are commonly employed in drug discovery and development, including virtual screening [Citation12]. When compared to traditional experimental screening, virtual screening techniques may readily analyse the large chemical libraries to uncover new drug candidates, saving significant time and resources. So, it is crucial to understand that computational and experimental efforts are not mutually exclusive, but rather complementary to each other. The combination of the two methodologies enables researchers to get a more thorough understanding of the systems under study, accelerate the discovery processes, and optimise resource allocation.
This review provides an outline of the QSAR and QSPR approaches and their applicability in the real field. In addition, Conceptual Density Functional Theory (CDFT) and applications of CDFT-based descriptors in QSAR/QSPR are discussed briefly with a focus on their selection methodologies for the building of more consistent, foreseeable, and comprehensive QSAR models.
2. Quantitative structure–activity relationships (QSAR)
2.1. History of QSAR
QSAR-related studies started long ago, in the year 1863, Cros found an interesting relationship between noxiousness and water solubility in mammals. The author found that toxicity levels of alcohols in mammals is improved as the water solubility of the alcohols declined [Citation61]. In the year 1868, Brown et al. [Citation62] first time reported that the structure and constituents of any species govern its physical and chemical properties. Richet and Seancs [Citation63–65] reported a contrary correlation between cytotoxicity and water solubility. In the year 1962, great scientist Hansch et al. [Citation66] reported the QSAR model hypothesis. Eminent scientists Hansch and Fujita reported a relationship between topology and biological activity in connection with Hammet's equation and hydrophobic constant, which is known as linear Hansch equation [Citation67]. During that point of time, QSAR related studies got expanded significantly [Citation68]. In 1968 Hansch et al. [Citation69] found that lipophilic character is dependent on the parabolic activity of the drug. QSAR establishes the relation between the biological activity/property/toxicity with their molecular structure through the mathematical model which correlates the chemical structure and physicochemical properties of a molecule by the descriptors [Citation68,Citation70]. It is stated as biological activity = f (Physico-chemical property).
There are several reports in which the correlation between toxicity and descriptors like hydrophobic, electronic, and steric are well documented [Citation71–76]. In the last few decades, computational alternatives are being used for the search for new drugs. QSAR is mainly a ligand-based virtual screening method that allows the mathematical correlation of a molecular structure along with its biological activities [Citation77,Citation78]. QSAR modelling is used in several domains for instance, in drug modelling, biosciences, biophysics, chemical sciences, and material sciences [Citation79,Citation80].
2.2. Importance of QSAR
The QSAR describes the observed variance in the biological activity of a collection of congeners in terms of molecular changes produced by varying the types of substituents. The following are two prominent uses of QSAR studies:
1. The predictive aspect and 2. The diagnostic aspect
Extrapolation and interpolation correlation studies are dealt with in the predictive aspect. The diagnostic aspect, on the other hand, addresses the reaction's mechanical features. QSAR modelling is used to solve the several critical demands in chemistry and drug discovery. Some of the critical needs which can be fulfilled by QSAR, are mentioned below:
Prognostication of activity in the biological system: With the help of structural properties of compounds QSAR predicts the biological activity. These models can assist in the prioritisation and screening of vast compound libraries, minimising the need for costly and time-consuming experimental testing.
Classification of the compounds: These models prioritised the compounds for testing and can also discover the most promising compounds for further exploration by forecasting the activity or property of interest, saving time and money.
Analysis of chemical risk: These models anticipate the toxicity, environmental effect, and other features of chemical compounds and also assess the safety of chemicals used in numerous industries, comprising pharmaceuticals, grease paints, industrial chemicals, and insecticides.
Cognisance of SAR: Researchers can acquire a better grasp of the key structural elements that determine a compound's nature by these models.
Lessen experimental trial: By giving a prediction of unknown chemicals these models reduce the hypothetical testing. These models are useful when dealing with vast chemical libraries or when experimental testing is expensive and time-consuming. To summarise, QSAR is necessary to make the decisions, prioritise resources, and better understand the relationship between chemical structure and activity. Drug discovery, chemical risk assessment, and environmental chemistry can all be achieved with QSAR modelling.
In recent years, machine learning processes like liner discriminated analysis (LDA) [Citation81] ensured by support vector machine (SVM) [Citation82,Citation83] neural networks (NN) and random forest (RF) [Citation84] are used in the QSAR study. Although these modelling methods have attained a huge success, some defects have also been found. Complicated parameters that could not be adjusted and the problem of overfitting also persisted. The expansion of chemical libraries, the growth of computational methods, and the advantages of high throughput screening methods (HTS) attract the researchers to do new experiments on drug analysis [Citation85,Citation86]. The deep learning technique (DLT) is a major contributor to the creation of QSAR models. It directly collects data from the raw materials, high dimensions, and heterogeneous chemicals, and also follows traditional machine learning algorithms [Citation87–90]. Moreover, it also fulfils the model requirement by the accumulation of chemical data on a large scale [Citation89].
2.3. QSAR methodology
The different methods of the QSAR and how they progress are displayed in Figure .
Figure 1. Schematic portrayal of QSAR methodology.
There is a lot of discussion in the literature about the development and expansion of the QSAR model [Citation91–94]. The expansion of the QSAR helps to understand the decision support system, validation of the model, usefulness, and prediction of uncertainty [Citation95–100]. In the literature, QSAR analysis of the real model selection, validation, prediction, authenticity with instances of development errors [Citation101–104] are reported. Instead of these challenges, QSAR takes an important part in the research of chemical behaviour, especially during fine-tuning of chemical nature [Citation105,Citation106]. QSAR evolution has been divided into three forms i.e. data production, data analysis (molecular structural descriptors), and model validation. Different methods are used in the validation as 2D, 3D, and higher dimensional methods. For the development and validation, various scientists used the metrics methods [Citation100,Citation93,Citation107–112]. Many researchers have performed validation by using one consent model, but this model is not suitable for comparison purposes [Citation113–116]. Later on, Heberger and co-workers introduced the SRDs model for comparison [Citation117,Citation118]. Alexander et al. [Citation99] proposed two simple methods for model validation: correlation coefficient (great value of R2) and RMS error (small value of RMS). Moreover, quantum chemical (QC) and other descriptors are used for the precise descriptions of the structure and their properties [Citation119,Citation120] for instance polarizabilities, atomic charges, molecular orbital energies, frontier orbital energies, and dipole moment. Here we take some problems where QSAR has been applied and elucidate the outcomes:
There are many fields where QSAR can be applied at a very large scale as:
Recently, a lot of interest has been generated in using QSAR models based on DFT to forecast deterioration behaviour. Through mathematical fitting, QSAR models condense an alleged link amid the chemical/biological/ characteristics and the structure of a dataset of molecules. To evaluate the quality of unknown substances, the quantum chemical parameters can interpret the chemical and biological things from the perspective of molecular structures. Recently, some researchers have used QSAR models to investigate how antibiotics degrade. For instance, the QSAR models for sulfonamides were developed by Huang et al. [Citation121], who also found that the primary factors influencing the degradation of SAs are the atomic restricted charge on C atoms, HOMO energy, and the Fukui index about nucleophilic assaults. For the dissociation species of fluoroquinolones and sulfonamides, Luo et al. [Citation122] created an ideal QSAR model that included three fundamental descriptors: the quantity of CH2RX fragments, the atomic partial charge on C atoms, and the dipole moment. Few QSAR models have been used for the catalytic breakdown of antibiotics.
QSAR is useful to forecast biological actions including the toxicity of several elements [Citation123]. It is primarily based on molecular structure [Citation124], simplified molecular input line entry systems (SMILES) [Citation125], and international chemical identifiers (InChl) [Citation126]. Toropov et al. [Citation127] introduced QSAR-based quasi-SMILES (quasi-QSAR) to get over the drawbacks of traditional QSAR on nanomaterials. Data of descriptors were coded in quasi-QSAR models by allocating a number amid 0 and 9 in a single character. The min–max normalisation method was used for numerical descriptors such as physicochemical characteristics.
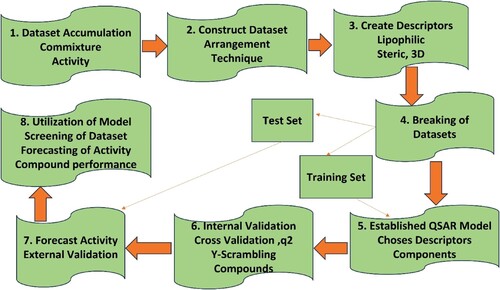
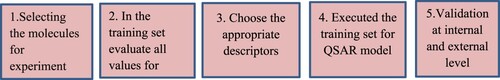
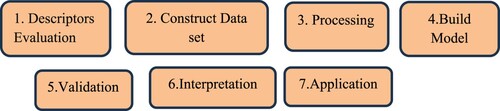
QSAR is also applicable to identify the catalysis process. Catalysis is one such central field of attention that can be considered as the reactivity descriptor. The importance of catalysis concerning the progress of an ecological atmosphere is essential in the growth of the many products that we use in our daily lives like food processing, manufacturing of medicine, plastics, cleansers, synthetic fibres, etc. Tandon et al. [Citation128] described the QSAR model for a varied set of 14 electron ruthenium alkylidyne complexes for olefin metathesis to elaborate the association amongst their structure, characteristics properties, and related catalytic actions. The development process of QSAR is presented in Figure . There are five steps in the QSAR development process.
Figure 2. QSAR development process.
2.4. Quantitative structure–property relationship (QSPR)
QSPR are mathematical models constructed by linking substances’ physicochemical properties/biological activity to their chemical assemblies. It varies from QSAR in that its dependent variable is a biological activity rather than a biophysiochemical property [Citation129]. It provides a way to predict attributes using only an understanding of the configuration of molecules. Such models were specifically listed as possible approaches to speed up and lower the cost of the registration, evaluation, and authorisation of chemicals in Europe in the REACH legislation (European Commission, 2006). The OECD proposed validation standards to help the regulatory applications of QSPR models (OECD, 2007). Their discussion emphasises translucency in the definition of algorithms, endpoints, and applications (including experimental protocols). Additionally, they encourage the adoption of accurate model performance estimations (including an external validation to estimate predictivity). Moreover, it is advised to interpret the model mechanically. A QSPR model can be used for screening purposes, even when chemicals are not yet synthesised or experiments are too expensive or risky, outside the regulatory context, to estimate properties in the initial stages of research and development for novel compounds and new manufacturing purposes. QSPR models have been effectively created for a variety of properties, including physical chemistry and toxicity [Citation130]. Katritzky et al. [Citation131] and Zhang et al. [Citation132] demonstrated the success of applying this strategy to problems with process safety and physical risks.
QSPR studies are considered significant for drug design rationale and formulation. In this method, the breaking of molecules occurred in a number series to narrate the chemical and physical properties [Citation133]. QSPR is used for modelling and providing insight into the chemical and physical properties of a molecule. Chemometrics is a method that supports statistical and mathematical techniques to extract information from chemical systems. Chemometrics has taken QSPR to a new height [Citation134,Citation135] and the main approach of this model is to search for a perfect quantitative correlation that can be developed to envisage the various characteristics of a compound, including those that have not been measured. It is crystal clear that the description of the QSPR model is influenced by some factors which explain the molecular structure. ‘Topological indices’ which are obtained from the connectivity and configuration of a compound plays a significant part in the study of the QSPR model [Citation136]. The QSPR approach is performed in following four steps:
Selection of data
Generate molecular indices
Multiple Linear Regression method
Validation of techniques
2.4.1. Applications of QSPR
Applications of QSPR are as follows:
Persistent Organic Pollutants (POPs) are one of the world's most serious environmental problems. Papa et al. [Citation137] investigated a QSPR study for a set of 250 mixed organic molecules. Several studies have been carried out in this field by using a mixture of five molecular indices- EHOMO, ELUMO, polarizability, dipole moment, and molecular weight to forecast several environmental parameters like dissociation constant (pka), volatilisation, retention, water dissolution (KOW) on soils and sediments, biodegradation, absorption by plants, etc.
Using molecular descriptors based on structural and constituent parameters (like nonplanarity, the number of rings, and O, double-bonded S, N, and Cl atoms, molar formation enthalpy, molecular weight, surface area, solvation-free energies, and partition coefficients), QSPR models are used to forecast holding time of POP remains (phenyl/sulphonyl/ urea's compounds) in wine [Citation138].
Kovalevska et al. [Citation139] reported the QSPR technique for sophisticated marketing analysis and the need for medicine with higher bioavailability development of the diagnosis of type 2 diabetes mellitus.
Vladimirova et al. [Citation140] examined the suitability of the QSPR technique for analysing the potentiometric understanding of plasticised using the chemical structure of the ionophore as a model input. The authors also reported the application of the QSPR technique in the prediction of potentiometric sensitivity for plasticised polymeric membrane sensors.
So, based on the knowledge of the molecular structure, QSPR determines the physiochemical characteristics of the species for instance melting point, boiling point, solubility, stability, dielectric constant, reactivity, diffusion coefficient, and thermodynamic properties.
2.5. Quantitative structure toxicity relationship (QSTR)
QSTR is used to forecast the toxicity of a molecule through quantitative modelling. The toxicity is determined by the molecular structure and controlled by their properties, so there is an interconnection between the structure/property/toxicity [Citation141]. QSTR has described the molecular properties (toxicities) in terms of descriptors through statistical techniques. The mathematical relation of QSTR is as follows: Toxicity = f (chemical structure/property)
QSTR follows the below-mentioned steps:
Conversion of structure into descriptors
Selection of descriptors
Extract the connection between molecular descriptors and toxicological data
Validation and Prediction of the model
Validation of models was established by Roy and co-workers [Citation142–144]. The OECD has specified guidelines for the authentication of QSTR models which are as under [Citation145]:
Clarity is to be given at the last point by the prediction of the model.
Model Algorithm which predicts the endpoint should be clear.
The applicable domain should be determined.
Justify the model by internal (good fitness and strength) and external validation.
Interspecies (I-QSTR) provides a tool for the determination of contaminants with a known level of unpredictability for various species. It can derive the final point toxicity of one molecule to the second one, even when the data for the second molecule is not available. The expansion of I-QSTR can be economical in terms of toxicity tests, improve the mechanism of toxic action for chemicals, and fill the gap for particular species. Chemometric tools like the multilinear regression method (MLR), partial least square (PLS), artificial neural network (ANN), and support vector machine (SVM) have developed several QSTR models [Citation146–158].
2.6. Classification of QSAR methodologies
QSAR can be categorically divided into two types:
The first category consists of descriptors that are 1D,2D,3D,4D,5D, and so on.
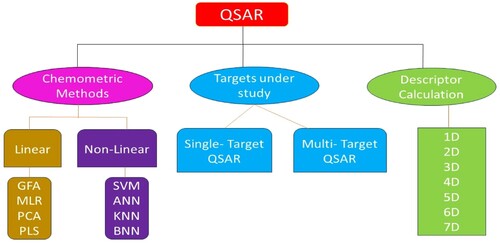
The second one is based on the biological action as a reliant variable like QSTR, QSMR (Quantitative structure-metabolism relationship), QSRR (Quantitative structure–reactivity relationship, or Quantitative structure-retention relationship) [Citation159], QSPR (Quantitative structure-permeability relationship or Quantitative structure-pharmacokinetics relationship) [Citation160]. QSBR (Quantitative structure-binding affinity relationship) [Citation161], and so on. The models of QSAR are also created based on the investigation of correlation -linear and non-linear [Citation162] or related to the binding nature of the molecule [Citation163]. Figure depicts the different classifications of the QSAR methodologies.
Figure 3. Different kinds of QSAR techniques.
2.7. Regression-based methods
Several regression approaches are designed to develop QSAR/QSPR/QSTR models. Regression-based methods are used for QSAR modelling to forecast the activity of a chemical compound based on its composition of a molecule. These models seek to establish a mathematical link among molecular structure-based descriptors and their related activities, and these models are then used to forecast the activity of previously unknown substances. There are various models in which the most extensively used traditional approaches like MLR, and PLS, and newly modified methods like Genetic function estimation and machine learning methods (K-nearest neighbour, SVR, and NN) are also used.
2.7.1. Multilinear regression (MLR)
MLR [Citation164] is the easiest method and it is widely used to fabricate these models (QSAR/QSPR). This method generally builds the linear interrelation between the dependent and independent variables. It is predicted by the link between a compound's molecular descriptor and its explicit activity (symbolised by a quantity y) [Citation165]. The below expression shows the MLR equation [Citation165]:
(1)
(1) In this equation, y is the dependent variable, X1 … . Xk represent molecular descriptors or independent variables, β0 is the regression model constant, and β1 to βk are coefficients for independent descriptors (X1 … . Xk). All estimated molecular descriptors are independent variables. The method has two advantages: first, it is a simpler method, and second, it is used to explain mathematical expressions. The coefficient value β1 to βk specifies that every chemical descriptor influences a certain action either favourably or unfavourably. It has been found that MLR works effectively when the association between structure and action is of direct type, the molecular descriptors are self-regulating, and the number of molecules is exceedingly at least 1–5 of the molecular descriptors [Citation166]. If collinear descriptors are used, then the value of coefficient β1 to βk is greater than real value and sometimes the sign gets the opposite [Citation167]. The objective of MLR-based QSAR is to develop a mathematical connection among a set of molecules’ structural features and their corresponding properties. Figure represents the development steps of implementation of the MLR method:
Figure 4. Steps in the development of the MLR model.
2.7.1.1. Applications of MLR in QSAR
Applications of MLR in QSAR are as:
Nowadays metal oxide nanoparticles are extensively used in medical services as well as development in health care. Roy et al. [Citation168] used MLR modelling with 16 MeOx NP datasets and PLS regression modelling with 15 MeOx NP datasets (117 data points with diverse physical characteristics and circumstances) to calculate the cytotoxicity of NPs towards HaCat cells.
Joo et al. [Citation169] predicted the physical behaviours of Polypropylene composites with the help of MLR, DNN, and random forest regression methods to validate industrial data and got R2 values of 0.8 or higher which satisfied the standard value. Among the three methods, MLR gives the highest performance.
Phosphorylation of Pl3K, a lipid kinase enzyme is important in controlling immune cells through the creation of intracellular signals. By using MLR and ANN in QSAR, the model's stability and robustness have been evaluated by external and internal validation methods reported by Sadeghi et al. [Citation170].
Quadri et al. [Citation171] used the QSAR-based MLR and ANN predictive models along with the chemical descriptors associated with FMOs for the effective design of pyridazine corrosion inhibitors.
Liman et al. [Citation172] determined the quantitative connection between anti-NS5A HCV biological action and the molecular assembly of a series of NS5A inhibitors with the help of the GA-MLR model and the obtained results were in agreement with OECD strategies. It is important to note that MLR is a linear system that presupposes a linear connection among descriptors and activity and if the relationship is non-linear, then other appropriate methods are applied for QSAR. In recent papers, several novel methodologies have emerged, building upon the foundation of MLR, to enhance and refine techniques like Best-MLR(BMLR), Heuristic method (HM), Factor Analysis MLR(FAMLR), Genetic Algorithm-MLR(GA-MLR), Stepwise MLR and so on [Citation173].
2.7.2. Partial least square (PLS)
In reference to QSAR studies, the PLS regression model was further developed and popularised by Svante Wold, one of the pioneers in chemometrics and statistical methods [Citation174,Citation175]. PLS regression models offer an alternative to traditional OLS regression or canonical correlation methods. They have found applications in diverse fields, including econometrics, where they have been utilised for growth modelling and economic analysis [Citation176]. PLS [Citation177] uses the latent variable Xnew, which requires less information about molecular descriptors than actual molecular descriptors, to construct the QSAR/QSPR model. In this method, x and y are disintegrated by the simulation process which explains the maximal orthogonality. It is quite dissimilar from principal component analysis (PCA) due to the generation of maximal x variables by the linear combination. The significance of PLS in QSAR model fabrication is to designate the maximal number of latent variables. PLS regression is very beneficial while dealing with datasets with several associated descriptors or when the descriptors are multicollinear. The model is trained on a set of known elements, each with its own set of activities or attributes, and it learns the link between the descriptors and the retort variable. Once trained, the model can be used to predict the properties of new compounds that were not in the training set. This model is broadly used in lead optimisation, virtual screening, and drug designing in the area of therapeutic chemistry. Some applications of PLS in the QSAR modelling are mentioned below:
De et al. [Citation178] studied the 19 PET imaging agents that target the presynaptic vesicular acetylcholine transport (VACht). VAChT aids in the transfer of Ach into presynaptic storage vesicles and has appeared as a key element for the identification of a variety of neurodegenerative disorders and finding out the critical structural properties of PET imaging agents that are mandatory to bind to VAChT. This was accomplished by employing a PLS-based 2D-QSAR model.
Bennani et al. [Citation179] communicated the use of PLS and PCA approaches to develop QSAR models to identify the set of complexes verified for their inhibitory action beside six dissimilar cancer cell lines. Moreover, the forecasting of the PIC50 value for synthesised 63 pyrazole derivatives was assessed with the QSAR model for each cancer line.
The QSAR research of protein P38 mitogen-activated protein (MAP) kinase species using the GA-PLS approach. Mirshafiei et al. [Citation180] discovered that the GA-PLS model had the maximum prediction influence for a set of statistical constraints.
Chronic toxicity is a major toxicological endpoint in terms of human health. Kumar et al. [Citation181] created a QSAR model based on the lowest observable adverse effect level (LOAEL), which was measured in rats by orally exposing them to 650 diverse and complex compounds. They statistically validated the proposed PLS model and stated that the model is reliable, robust, and predictive.
To construct QSAR without target structures, Huo et al. [Citation182] proposed a CNN-based method termed L3D-PLS.
PLS is a regression system that combines elements of PCA with MLR. It is especially beneficial when dealing with datasets in which the number of self-governing variables exceeds the number of samples, or when the descriptors are multicollinear. During the past few years, PLS has undergone significant advancements and as a result of its integration with other mathematical approaches, improved enactment in QSAR/QSPR studies such as Genetic-PLS (GPLS), Factor Analysis PLS(FA-PLS), Orthogonal Signal Correction-PLS (OSC-PLS) [Citation173] have been developed.
2.7.3. Random forest regression (RFR)
Leo Breiman, an American statistician and computer scientist, invented RFR and in 2001 introduced the Random Forest Algorithm (RFA), the expansion of RFR. It's widely used because of its stability and capacity to handle complex data relationships. RF is an ensemble learning method that combines the predictions of several decision trees [Citation183,Citation184]. It can successfully handle non-linear relationships and interactions between descriptors. It creates a link between descriptors and desired attributes of chemical compounds. The ultimate forecast is obtained by averaging all of the different tree predictions. It is simple to set up and it has a low computing overhead as stated by Montes et al. [Citation185]. Even if some data are outliers or misplaced, it can still do well in prediction. It can also switch a large number of high-dimensional structures without needing measurement drop. Oukawa et al. [Citation186] have found that RFA has three parameters ntree, mtry, and nodesize, which have a direct impact on the quality of prediction models. Schlender et al. [Citation187] stated that multi-task random forest models for aquatic toxicity modelling outperformed other ways and consistently delivered good results in low-resource environments. According to the statistical results, the random forest model is the best for predicting the pregnancy risk category of medications mentioned by Karaduman et al. [Citation188].
2.7.4. Regression models used in recent years
Over the last decade, a wide range of statistical indices have been developed to measure a model's external predictivity, particularly the extent to which it estimates the features of a distinct data set. Alexander et al. [Citation99] reported the model fit criteria for estimation of R2 in QSAR and QSPR studies and found that instead of duplicating the popular justifications for model with test outcomes, the goal is to direct use of R2 as a model fit parameter. Pourbasheer et al. [Citation189] investigated the solubility of fullerene derivatives. The authors used a multiple linear regression approach to model the association among a subset of molecular indices and dispersion values. Skretna and coauthors [Citation190] stated that the estimated value of the QSAR and QSAR models through the use of kernel-weighted local polynomial regression (KwLPR) approach is much greater as compared to the conventional linear and nonlinear regression models. Khan et al. [Citation191] reported that specialised techniques such as consensus modelling and double cross-validation may be more appropriate when working with smaller data sets since they eliminate the potential for bias in the choice of descriptors. Aranda et al. [Citation192] reported that the replacement approach variable sub-set selection procedure offered the most effective multivariable linear regression models for bioconcentration factor prediction. Shi et al. [Citation193] reported linear and nonlinear regression models to estimate the conductivity of ionic liquids. The result shows that ionic liquids may be considered as ‘ion pairs’ in the QSPR model, which then integrates with the BP-ANN to anticipate the conductivity of different ionic liquids under different temperatures.
2.8. Classification-based methods
Classification-based approaches are employed in QSAR modelling when the goal is to predict the category class or activity of chemical compounds based on their molecular structure. Based on structural descriptors, these methods try to develop a model that can categorise chemicals into preset categories. Figure explains some classification methods.
Figure 5. Schematic representations of classification-based models.
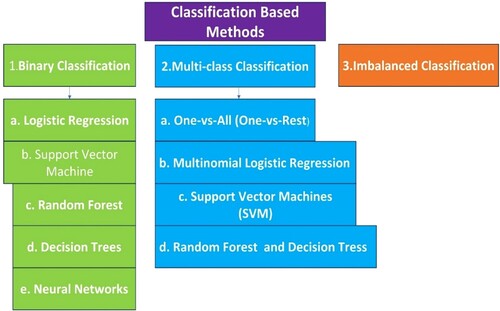
The performance of classification-based QSAR models must be carefully evaluated utilising measures like precision, accuracy, recall, F -1-score, and area under the Receiver Operating Characteristic (ROC) curve. Cross-validation and external validation are critical processes in determining the model's ability to generalise.
2.8.1. Cluster analysis
To optimise the similarity both inside group and between groups, similar data are clubbed using the clustering technique. The techniques are k-means clustering and hierarchical clustering. Other classification-based techniques include logistic regression and linear discriminant analysis [Citation194]. Cluster analysis seeks to identify patterns and similarities in data that can be used for a variety of purposes in QSAR modelling, including data exploration, identifying chemical classes with similar activities, and assisting in the selection of diverse compounds for experimental testing. There are some steps followed by the cluster analysis:
Construction of data
Calculation of Analogy or Distance
Applied algorithm of cluster
Validation of Clustering
Cluster analysis in QSAR can provide important insights into structure–activity connections, aid in the discovery of chemical classes with comparable features, and aid in the building of specialised compound libraries for further experimental testing. The use of cluster analysis in QSAR has proven beneficial in organising chemical compounds into meaningful subsets and aiding in the study of structure–activity connections.
2.8.2. Machine learning techniques
In QSAR, machine learning techniques are applied for the broader collection of statistical data to establish quantitative correlations between chemical structures and their associated biological activities.
2.8.2.1. Genetic function approximation (GFA)
GFA was developed by Cramer et al. in 1988 [Citation195]. GFA is a regression methodology that blends genetic algorithms (GAs) with function approximation to create models that relate descriptors to a chemical compound's desired attribute. It is conducted through mathematical expressions or a series of arithmetic operations. GFA is a process designed on the platform of the genetic algorithm [Citation196] and multivariate adaptive regression splines (MARS) [Citation197] to create different QSAR/QSPR models [Citation198]. It is based on Friedman's ‘lack of fit’ (LOF) measure, which is as under: [Citation198]:
(2)
(2) Here M is the total number of compounds, c represents the number of basic functions, d is a soothing factor, and p is the sum of all the descriptors in all base functions. GFA has various leads over customary regression methods, for instance, it is capable to choose descriptors and basic functions for models. Here are some examples where GFA has been applied: Histone deacetylase (HDAC) is a therapeutically important target for the treatment of cancer cells. Patel et al. [Citation199] used five different QSAR models to identify the Hypogen model (Hypo1) for HDAC inhibitors was developed and had a good result. Rullah et al. [Citation200] investigated the 5-Lipoxygenase activating protein (FLAP) inhibitors to acknowledge the structural parameters by using the QSAR GFA models and some other methods. The combination of MLR and GFA QSAR models was established by Akinola et al. [Citation201] for the prediction of 20 OH-PCB activities to constitutive androstane receptors. In QSAR investigations, GFA has been utilised to manage non-linear interactions between descriptors and target variables. It provides a flexible and powerful approach for creating QSAR models that can capture complicated structure–activity correlations by combining genetic algorithms with function approximation.
2.8.2.2. K-Nearest neighbour (KNN)
In QSAR modelling, the K-NN model is a popular machine-learning approach. It is a non-parametric method for predicting the activity or properties of chemical compounds based on similarities to other compounds in a training dataset. The training data set consists of known compounds with their corresponding activities. In K-NN classification QSAR, [Citation202,Citation203] compounds are classified based on their nearest neighbour's class memberships, with the similarities betwixt compounds and their nearest neighbour weighted. For new compounds, the k-NN method searches the training dataset for the K nearest neighbours, based on the similarity of the indices to the indices of new compounds. Compound similarity is often quantified using a distance metric, such as Euclidean distance or Manhattan distance. The Euclidean space among a specified compound (denoted by x) and its close neighbours in a training set (denoted by xi) [Citation204,Citation205] is measured by the straightforward instance-based method known as K-NN [Citation115]. The Euclidean space among vectors x and xi is calculated as [Citation115]:
(3)
(3) The average of the activity values of all k-training compounds that are closest to the examined molecule determines its activity. Here are the steps of how the model works and some examples:
Construction of Data
Calculation of Gap
Choose k
Forecasting
Assessment of model
Xu et al. [Citation206] used the five QSAR models including K-NN to identify the BCF for chemical pollutants in water and these improve the prediction accuracy of BCF. Hsieh et al. [Citation207] used the K-NN model and their findings show that this QSAR model based on MolconnZ descriptors may distinguish real AmpC beta-lactamase inhibitors from non-binding decoys. Shen et al. [Citation208] evolved a drug discovery approach by applying the K-NN QSAR models for undignified the validation of novel anticonvulsant compounds. The author stated that this approach can be used as a general rational drug discovery tool. For developing anticancer agents Xiao et al [Citation209] applied QSAR K-NN models for 157 epipodophyllotoxins derivatives and the obtained result showed that QSAR can be used in the future for the design of novel anticancer agents. So, it is a simple method that is easy to construct and interpret, it is a common choice for QSAR modelling, particularly for small to medium-sized datasets.
2.8.2.3. Feedforward back propagation neural network (FFBPNN)
It is a neural network-based approach and is divided into two stages: forward propagation of activation and backward propagation of error [Citation210]. It is formed by the internal layer having a hidden layer and an external layer in it. This model is a subset of the larger FNN architecture, in which the connections between neurons do not form cycles and information flows exclusively in one direction, from the input to output layers. There are neurons in the layer which denote the molecular descriptors that study the activity of a compound. Figure elaborates on the steps involved in the FFBPNN models.
Figure 6. Steps involved in the FFBPNN.
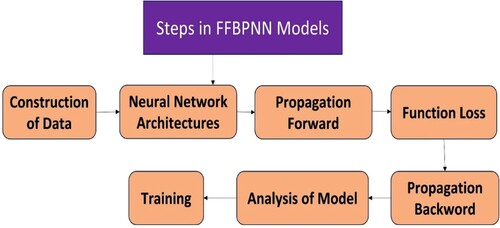
Here are some applications of FFBPNN: Zhang et al. [Citation211] used the FFBPNN model with GM to understand the residual settlement of Goaf's technique and found that this system gave high forecast accuracy, robust stability, and allowed the law of change of measured data and stated that obtained result helpful for future surface engineering. One case study of Jordan City regarding electricity load prediction has been done by employing the FFBPNN executed by Sleem et al. [Citation212]. The author communicated that their obtained result can be used for the preparation of preventive power stations and maintenance planning. The pollutant removal rate from the aqueous environment can also be increased with the help of adsorbent by applying the QSAR models. Sivamani et al [Citation213] used orange zest biochar to adsorb Cupric Chloride from its aqueous solution by increasing the adsorption adequacy utilising FFBPNN -BBD modelling. So, FFBPNNs can learn complicated patterns and relationships in data, they are effective tools for QSAR modelling.
2.8.2.4 General regression neural network (GRNN)
This neural network-based method was invented by Specht in 1990. The GRNN is a type of Bayesian network that performs regression using Kernel-based approximations [Citation214]. In GRNN, compound activity value is obtained by sampling the most likely values across all of the compound's activities in a training set, which is given as [Citation217]:
(4)
(4) The combined density calculated by Parzen's nonparametric estimator is denoted by f (x, y) [Citation215]. The Gaussian software uses this because it is easily estimated, good in the process, and follows Parzen's theory. This model is a radial basis function (RBF) network that can approximate smooth non-linear methods. Figure shows the steps which are followed in the working of GRNN.
Figure 7. Development process of GRNN model.
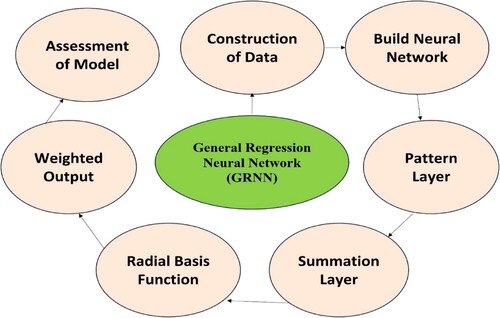
The GRNN model was applied by Qu et al. [Citation216] for the prediction of acute stroke patients, and they communicated that this model can be widely used for further research. Even though numerous factors influence the enthalpy of solvation (Hsolv), the GRNN algorithm, in conjunction with ten molecular descriptors obtained from the structures of solute and solvent molecules, was effectively used to create the QSPR model of a huge dataset of 6106 Hsolv investigated by Yu et al. [Citation217]. It offers an easy-to-use training method, and its capacity to handle a small quantity of training data makes it excellent for QSAR modelling, especially when data is scarce. Nevertheless, the smoothing parameter (sigma) of the Gaussian function, which influences the model's generalisation capacity, must be taken into account.
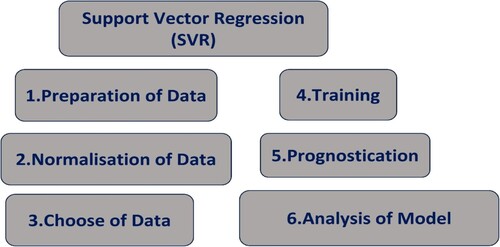
2.8.2.5. Support vector regression (SVR)
SVM, a novel sort of machine learning approach created by Vapnik [Citation218,Citation219]. It is gaining popularity due to its numerous appealing features and promising empirical performance. For both classification and regression tasks, SVM is frequently employed in QSAR modelling. SVM is very good at dealing with small to medium-sized datasets and can be used for a variety of QSAR applications, such as predicting biological activity, toxicity, or other attributes of chemical compounds based on their molecular structures. SVR is a kind of SVM, that is utilised for regression problems in QSAR based on the input chemical descriptors. SVR is aimed to predict continuous output values. SVR is a postponement of the support vector machine (SVM) that uses an intensive loss function to handle nonlinear regression issues [Citation220–222]. The calculated characterisation is determined by the ε-insensitive loss function . The training set is well explained in the high-dimensional feature space [Citation223] by using the Kernel function and its related parameters. Figure illustrates the sequential process integral to the operational framework of SVR.
Figure 8. Framework of SVR process.
Overfitted models appear to predict well for species in the training set however, they perform poorly for species, not in the training set. As a result, appropriate corroboration of QSAR/QSPR/QSTR is critical to ensure that the models are effective and have a reasonable number of parameters and excellent generalisation ability [Citation159,Citation224]. For the assessment of skin permeability, a novel machine learning-based HSVR model was used to establish a non-linear QSAR model that can foresee Kp values based on ex vivo human skin determined by Leong et al. [Citation225]. Hu et al. [Citation226] used the SVM model to determine the 3CL pro enzyme inhibitors for SARs-Cov., which has been a very effective tool for searching for new inhibitors against Covid 19. A collaborative QSAR model, comprised of two SVR models, is designed by Daghighi et al. [Citation227] to envisage the in vivo toxicity of nitroaromatic chemicals. The model was examined using a variety of methods and all numerical restrictions of this model suggest that it is vigorous and precise. Therefore, when the association between the descriptors and the output values is non-linear, SVR is useful in QSAR modelling. It is capable of capturing complicated structure–activity correlations and effectively handling small to medium-sized datasets.
In recent years, a lot of developments have been made in the domain of QSAR by using machine learning techniques. Moura et al. [Citation228] studied the potential of natural products (fermented papaya) as a treatment for neurodegenerative disorder Alzheimer's disease (AD) utilising machine learning techniques in QSAR models. Wu et al. [Citation229] applied various machine learning techniques to construct the QSAR model and stated that amalgamations of multiple algorithms from diverse categories could enhance predictive capabilities. The efficacy of machine learning technique-based QSAR models is much better in comparison with the best-performing individual algorithms. Ai et al. [Citation230] reported bioconcentration factors and median lethal concentrations (LC50s) of organic pollutants are crucial for evaluating their potential harm to aquatic ecosystems. The authors investigated these factors by using ensemble Recursive Feature Elimination (RFE) with the SVM algorithm and stated that the newly established models are stable and provide more accurate predictions than previous models. Machine learning techniques have been effectively applied in recent years to develop QSAR models, which reflects their effectiveness [Citation231–236]. Pal et al. [Citation237] established an ideal descriptor electrophilicity index to produce a relationship between the configuration of the benzene derivatives and their biological characteristics which is a bit higher than the electrophilicity index. In this work, authors have applied neural networks to determine whether the QSAR model generated through MLR is adaptive. Sarkar et al. [Citation238] reported the advanced dynamic study to comprehend how chemicals interact from a sensitivity aspect and enhance the related chemical interaction kinetics assessment. Recently, Prof. Chattaraj and his group have done a lot of work on DFT employing machine learning techniques and analysed the CDFT-based descriptors [Citation239–242].
2.9. Validation of models
After the model has been created, it must be authenticated. The model parameters or descriptors should be interpreted. Studying the role of indices in the expected action is aided by the mechanistic elucidation of the constructed QSAR model. We can determine whether the constructed QSAR model can be employed for any collection of substances by performing an analysis of a suitable area. The chemical space or applicability domain of a group of chemicals is only compatible with the complexes used for the training if the QSAR model forecasting for that group of substances is accurate. By validating the models, over-fitting of the data and random correlation of the many descriptors utilised in the model are avoided. It aids in evaluating the model's predictability and accuracy. The OECD has proposed the following five principles:
Defined endpoint
Clear algorithm, a defined applicability
A defined applicability
Suitable goodness-of-fit, powerful and precise prognostication
Mechanistic explanation [Citation243]
Techniques like internal validation, external validation, and cross-validation can be used to validate QSAR models [Citation244]. Internal validation analyses the preciseness of the prognostication related to the compounds utilised for model formation by predicting activity and estimating parameters. It is not comfortable with the use of new datasets. External validation easily works with new data sets so this data set is classified into test and training sets but this process is not so much worthy due to leaving a large portion for testing. De et al. [Citation245] have presented the schematic diagram of double cross-validation of the QSAR models as displayed in Figure .
Figure 9. Schematic diagram of Double cross-validation algorithm by De et al. [Citation245].
![Figure 9. Schematic diagram of Double cross-validation algorithm by De et al. [Citation245].](/cms/asset/5c14b13d-1b11-468b-bf24-569108724ffb/tmph_a_2331620_f0009_oc.jpg)
According to researchers, DCV is both reliable and useful, so it has been effectively applied to various applications, including QSPR models for organic chemical sweetness potency [Citation246], inhalation toxicology [Citation247] the enlargement of nano-QSAR models for TiO2-based photocatalysts [Citation248] diagnostic agent modelling [Citation249–252].
Strong cross-validated R2 values were suggested by Golbraikh et al. [Citation253] as one of the requirements for a QSAR model to have large prophetic power.
Depending on the type of QSAR model, authentication metrics are of two kinds:
Based on regression
Based on the classification
Both methods have specific metrics validation. Both methods based on classification and regression have specific metrics for validation. Regression-based model metrics are computed for internal and external approaches.
2.9.1. Authentication metrics for internal justification
There are some methods for this validation:
2.9.1.1. Least square fitting
It is analogous to the linear regression method and is often used for validation. In this the determination of the square correlation coefficient (R2) among the predicted and experimental values.
2.9.1.2. Chi-squared (χ2) and root-mean-squared error (RMSE)
The prediction effectiveness of a model is evaluated by the RMSE and (χ2) values. The RMSE number represents the discrepancy between the men of experimentally determined and anticipated activity values, while the (χ2) value illustrates the difference between empirically determined bioactivity values and also predicted by the models, and the value of (χ2) and RMSE should be lower than 0.5 and 0.3 [Citation244].
2.9.1.3. Cross-validation
For inner estimation of data, cross-validation offers some important measures which are Leave-One-Out (LOO) and Leave-Some-Out (LSO) cross-validation. One compound is omitted from the LOO cross-validation, and the QSAR model is built using the residual complexes. Repeating this procedure eliminates each compound in the dataset one at a time. The outcomes from this are used to estimate the 14 metrics of validation.
2.9.1.4. Leave-Some-Out (LSO) cross-validation
When using LSO (Leave-Some-Out) or LMO (Leave-Many-Out), a group of information is removed, and prototypes are then generated using the remaining compounds. This process is more reliable compared to LSO [Citation244].
2.9.1.5. True Q2 and  metrics
For small data sets trues Q2 is employed, and the metric is generated using scaled values for the observed and anticipated activity. The true
and Y-Randomization, a metric for unintended links, are two more metrics used for internal validation. [Citation243].
2.9.2. Justification metrics for external validation
The following are the justification metrics used for peripheral endorsement:
Prophetic R2, which can be alternatively expressed as Q2(F1), provides information about the relationship between experiential and foreseen information.
Q2(F2) and Q2(F3) are the means of the test facts set and training data set and the inception value of 0.5 is explicated for both metrics [Citation243].
Golbraikh et al. [Citation253] presented criteria for choosing training and test data sets.
Some of the other metrics are used as RMSEP (Root Mean Square Error of Prediction) to evaluate the prophecy inaccuracy. CCC (Concordance Correlation Coefficient), the most stringent and preventative degree, with a perfect value of 1 [Citation102], (rank) which varieties rank order estimates and
(test) to comprehend how observed values compare to projected values [Citation243].
2.9.3. Validation metrics for classification-based methods
Wilks lambda (λ) statistics are the validation matrix used in classification-based approaches. It is determined as the proportion of the within-category totality of squares to the entire diffusion and is used to investigate the impact of the discriminant model utility. A lower score indicates a stronger level of discrimination, and the value ranges from O to 1. Mahalaonobis distance is a measurement established using random data points, and the canonical index (Rc) is used to evaluate the sturdiness of relationships amid numerous dependent and independent variables. Chi-square (χ2) is also used to assess the eminence of the classification-based model [Citation243].
3. Quantum mechanics and descriptors
Quantum mechanics deals with the interaction at the atomic or subatomic level. Bader established the quantum theory of atoms in molecules (QTAIM) based on electron density or electron energy that explains the elementary facts of chemical bonding in molecules like the atoms in a molecule, the dispersion of electrons in a molecule, and the space of an atom in a molecule [Citation254–258]. Quantum chemical (QC) methods can calculate the value of atomic charges, molecular orbital energies, and many other potential values of electronic values of descriptors in the study of QSAR [Citation259]. QC descriptors are molecular descriptors, determined by the QC calculation methods, like ab-initio, semi-empirical (SE), and density functional theory (DFT) methods [Citation260]. Among these QC methods, DFT is more popular because:
The ab-initio method takes more computational time and also requires a high-end computation facility.
In semi-empirical methods, the calculation of exact values of the molecular electronic and geometric configuration of chemical species is complex. DFT is the most popular because DFT provides a correlation between electron density and electronic energy [Citation261].
Karelson et al. [Citation119,Citation262] acknowledged the significance of QC descriptors in the QSAR model and also explained the traditional descriptors along with atomic charges, frontier orbital electron densities or energies, polarizabilities in atoms or molecules, and dipole moments. Despite some inherent overlap, descriptors developed from quantum chemistry are essentially distinct from quantities obtained by direct measurement [Citation263]. Quantum-chemical computations have no statistical error, unlike experimental measurements. The assumptions necessary to make the calculations easier include some inherent mistakes, though. The computational error is assumed to be constant over the course of a sequence of related molecules when using descriptors based on QC [Citation264].
QC descriptors that are widely used as:
Atomic charges: The electrostatic force in a molecule is controlled by electrical charges, and it has been demonstrated that electrical charges and density are significant for identifying the chemical and physical properties of molecules. So, charge-based descriptors are used as chemical reactivity indices. Mulliken population analysis [Citation265] is used in the semi-empirical method to estimate the charge distribution in a molecule.
Molecular Orbital Energies: HOMO (highest occupied molecular orbital) and LUMO (lowest unoccupied molecular orbital) energies are desired as QC descriptors. These energy orbitals play a vital role in the chemical species to calculate the band gap in solids [Citation266,Citation267].
Frontier Orbital Densities: In frontier orbital densities, the donor and acceptor synergy [Citation114,Citation115] is explained by the atom densities in a chemical reaction. A frontier orbital electron is used to narrate the reactivity of unlike atoms in a molecule [Citation268,Citation269].
Atom-Atom Polarizability: Self-atom and atom-atom polarizability (πAA, πAB) have also been used as a descriptor for chemical reactivity [Citation263,Citation270]. It is modeled as a perturbation impact on a single atom's electronic charge at a single or distinct atom [Citation263].
Molecular Polarizability: The important characteristic of this parameter is the connection between the molecular mass [Citation271] and its value, which is related to hydrophobicity and other biological activities [Citation272–275].
Dipole Moment and Polarity Indices: The divergence of a molecular system is very essential for the physicochemical properties and is assessed by descriptor i.e. dipole moment [Citation261,Citation275–278].
Energy: It is an important descriptor for the SAR. The calculated value of total energy estimated by the semi-empirical method is used as descriptors in various cases [Citation279–281].
Hydration Energy: The quantitative measurement of solvation includes hydration energy as one of its components. It is an exceptional case of water. If the hydration energy is lower in magnitude, it has a greater capacity to dissolve in water and it behaves like a hydrophilic which forecasts the best properties of drugs [Citation282].
Surface Area: For the biological activities of a molecule, the charge surface area of a molecule is considered as an essential parameter in QSAR. The distribution of charges by electrostatic potential is directly proportional to the surface area. The molecule generally displays higher biological activity due to the greater positive surface area [Citation282].
Log P: The positive value of Log P shows hydrophobicity and the negative value of Log P shows hydrophilicity. It plays a significant role in the biochemical interactions in a living cell. The positive and negative values of Log P display the toxic nature of drugs. The lower value of Log P (negative) shows the lower toxicity of drugs [Citation282].
4. Density functional theory (DFT)
Density Functional Theory is an important and popular quantum chemical method DFT. It is used to determine the electronic structure of a molecule in physics and chemistry. It has been used since the 1970s in computational solid-state physics. After that, in the 1990s, modification was made to this method to make it perfect for quantum chemical applications and also widely used for experiments. The electronic wave function methods are the sin qua non for the DFT, like alloy cluster and Moller -Plesset perturbation theory [Citation283].
The development of various descriptors using the DFT method has been done successfully, and the result is very effective in terms of QSAR and QSPR models. The three different components of DFT are theoretical, conceptual, and computational. When evaluating the activity and toxicity of various compounds under the purview of QSAR and QSTR, the Conceptual Density Functional Theory (CDFT) becomes highly helpful. In comparison to other quantum-chemical approaches like ab initio methods, CDFT has been demonstrated to be computationally efficient and cost-effective. It has been demonstrated that CDFT can create robust and effective QSAR models.
4.1. Conceptual density functional theory (CDFT)
CDFT is an important branch of DFT study, that was introduced in 1998 by Parr et al. [Citation284].
With the help of molecular descriptors, CDFT is used to analyse the physical and chemical properties, biological activities as well and reactive sites of the molecules. These descriptors are used successfully in the development of the QSAR/QSPR/QSTR models with very high productivity [Citation285,Citation286]. The CDFT method is being applied to determine the activity and toxicity of a given molecule within the limitation of the QSAR/QSPR/QSTR model. It is an inexpensive and easy-to-use method that helps in the production of efficient and coherent QSAR/QSPR/QSTR models. Figure shows visually represents the functions carried out by descriptors.
Figure 10. Activities of descriptors.
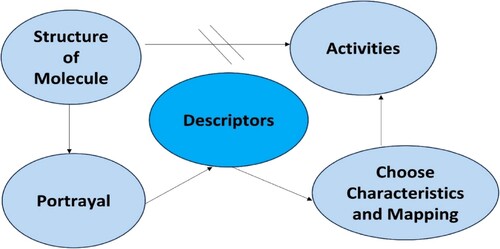
In a molecular descriptor, chemistry is encoded in symbolic representations, and this can be translated into useful numbers or results of standardised experiments. There are molecular attributes that determine a particular macroscopic property called a descriptor. The chemical reactivity concept reported by Parr and Yang [Citation287] in the form of CDFT, determined the chemical nature of the chemical species. The chemical reactivity theory is a prominent fact for the CDFT [Citation241] which determines the reactivity of a molecule where descriptors play an essential role in finding out the reactivity. CDFT descriptors are also useful in QSAR research. Conceptual DFT (CDFT) interprets electron density in terms of chemical concepts, enabling reaction prediction, identification of reactive sites, and material property explanation [Citation244,Citation261,Citation288,Citation289]. It offers exclusive perceptions of the fundamental principles driving molecule interactions and characteristics, making it an active tool in QSAR scrutiny.
There are some reasons why CDFT descriptors are crucial for determining the chemical behaviour and reactivity of molecules:
Chemical reactivity: CDFT features like electronegativity, chemical hardness, and chemical softness explicate the molecule's action and capacity to contribute to the electrons. These descriptions might aid in comprehending how a molecule might undergo chemical transformations or interact with biological targets.
Frontier orbitals energies: The HOMO–LUMO energies provide information about a molecule's electron donor and acceptor properties, which are important for understanding its chemical behaviour and reactivity.
Chemical potential: Ionisation potential and electron affinity are also important features that can be used to forecast the compound's redox potential and ability to undertake oxidation–reduction processes.
Forecasting the properties of molecules: CDFT has a quality to impacts the compound's behaviour in biological systems which is critical for QSAR modelling.
Mechanistic Insights: CDFT can offer mechanistic insights into chemical reactions and interactions with biomolecules This data can be used to guide the development of novel compounds with desirable activities and selectivity.
Complementary to Experimental data: CDFT descriptors are complementary to experimental data because they provide a theoretical foundation for interpreting and rationalising molecular characteristics and interactions. Combining theoretical and experimental methodologies in QSAR studies improves prediction accuracy and dependability.
Global CDFT-based descriptors viz. Hardness (ɳ) [Citation290,Citation291], electronegativity (χ) [Citation292,Citation293], and electrophilicity index (ω) [Citation294–297] and localised descriptors like Fukui functions f(r) [Citation298] and their related co-variants (fk) [Citation299], local softness (s(r)) [Citation300], local hardness (ɳ(r)) [Citation301] and local philicity [Citation302] can forecast the chemical nature of a molecule or a specific site. Mulliken [Citation286,Citation303,Citation304] reported that electronegativity (χ) is the average of ionisation potential (IP) and electron affinity (EA) and it can be expressed as follows [Citation263, Citation287]:
(5)
(5)
(6)
(6)
(7)
(7)
(8)
(8)
(9)
(9)
(10)
(10) An information-theoretic approach (ITA) basic density functionals are used in DFT to anticipate oxidation state value for components of species [Citation305–307]. The foremost recognised and extensively used concept in ITA is the Shannon entropy (SS) [Citation308]
(11)
(11) In this equation ρ(r) represents the total electron density and
is the Shannon entropy density.
Total number of electrons N, for the species are calculated as,
(12)
(12) The subsequent commonly developed quantity is the Fisher information, IF, which is as [Citation309]
(13)
(13) In Equation (13),
and
represent the gradient of the electron density and local density of Fisher information respectively.
The next parameter in ITA is Ghosh-Berkowitz-Parr (GBP) entropy [Citation310–312], which is defined as under:
(14)
(14) In Equation (14),
represents kinetic energy density.
Other parameters, presented as novel reactivity descriptors [Citation313] in ITA, comprise Renyl entropy (Rn) [Citation314], Tsallis entropy (Tn) [Citation315] and Onicescu information energy (En) [Citation316].
(15)
(15)
(16)
(16)
(17)
(17)
Integrating these descriptors into QSAR models helps to increase knowledge and prediction of chemical compounds’ biological activity, characteristics, and toxicity, assisting in drug discovery and other medicinal chemistry applications. In recent times, the field of CDFT has witnessed a surge in comprehensive reviews, as evidenced by several notable publications [Citation255,Citation288,Citation289,Citation317]. Additionally, a highly regarded multi-author reference volume on this topic has been recently published [Citation318]. These reviews and reference materials contribute significantly to our understanding of CDFT and its applications.
Ezzat et al. [Citation319] investigated polytetrafluoroethylene (PTFE)/ZnO/SiO2 nanocomposite by using DFT and QSAR techniques. Authors found that incorporation of ZnO and SiO2 in PTFE significantly enhances its electronic, thermal stability, and hydrophobicity properties. Hazhazi et al. [Citation320] investigated antitumour activity of novel 1,2,4,5-Tetrazine derivatives by using DFT method. They have calculated DFT-based descriptors – electronic potential, electrophilicity, and fukui functions and QSAR modelling (MLR and LOO) in gas and aqueous phases. Ramirez-Martinez et al. [Citation321] studied derivatives of benzoic acid by using DFT technique. They reported global and local quantum reactivity descriptors alongside CDFT descriptors to understand the structure-toxicity relationship (STR). Rajak et al. [Citation322] reported the toxicity of 45 nitrobenzene's (NBZs) by utilising DFT technique. Authors have calculated CDFT descriptors- electrophilicity index, LUMO, molecular compressibility (β), and hydrophobicity index (logP)). In this study, they applied MLR method to develop a QSAR model. In recent literature, DFT techniques are applied to calculate physicochemical properties of different molecules for biomedical, life sciences, photovoltaics and optoelectronic devices [Citation68,Citation323–331]. Recent work by Grillo et al. [Citation332,Citation333] has made the significant strides in obtaining accurate and efficient reactivity descriptors for large biological systems using semi-empirical Hamiltonians. Their research further pushed the boundaries by simulating reaction paths in three enzymatic systems and tracking changes in local hardness. Oller et al. [Citation334] introduced a Boltzmann-weighted atom condensed Fukui function, incorporating conformational fluctuations into their study of enzymatic CO2 fixation. Holguin et al. [Citation335–337] combined CDFT descriptors with cheminformatics tools to study the chemical and biological activity of peptides. They focused on marine cyclopeptides, analysing their potential therapeutic properties using various CDFT descriptors, including Fukui function and dual descriptor. This research introduces CDFT into ‘computational peptidology’.
4.1.1. Applications of CDFT descriptors in QSAR/QSPR/QSTR
QSAR, QSPR, and QSTR have been proven as highly effective methods in understanding various facets of the physio-chemical, and biological properties of drugs and pesticides [Citation338–345]. Any collection of chemical or biological systems can easily have a QSAR model derived using a well-designed and thoroughly tested algorithm. The method saves costs and expedites the creation of novel compounds for use in pharmaceuticals or other applications. There is a linear relationship between bioactivity and evaluated CDFT-based descriptors. The multi-linear regression analysis can be applied to propose effective QSAR/QSPR/QSTR models and a linear relationship among drug activities and CDFT descriptors for diverse sets of bio-active compounds.
CDFT-based descriptors namely global hardness (η), global softness (S), dipole moment, electronegativity (χ), and global electrophilicity index (ω) are highly helpful in assessing and linking the pharmacological actions of biomolecules. Many studies have successfully used the density functional and quantum mechanical descriptors in QSAR/QSPR analysis [Citation346–348]. Chattaraj et al. launched a fundamentally different research line. They made an assessment of biological activity or toxicity of a variety of organic compounds, such as various groups of polyaromatic hydrocarbons (PAH), with the use of CDFT descriptors [Citation349–351]. In a QSAR approach, electrophilicity is used as a key CDFT descriptor [Citation293,Citation294]. In this section, we have done a review of two important CDFT-based descriptors – electronegativity and electrophilicity index for their significant roles in QSAR/QSPR analysis.
4.1.1.1. Electronegativity
The idea of electronegativity (χ) is vital in describing electron distribution in heteroatomic compounds. Coulson [Citation352] reported that the concept of electronegativity successfully correlates with a wide range of chemical expertise and knowledge. According to Fukui [Citation353], the static and dynamic activity of molecules is stated by electronic effects in the electronic theory that is based entirely on the distribution of electrons in a molecule and the mode of charge distribution in a molecule can be depicted by using the electronegativity concept. The electronegativity concept is mainly used to realise changes in bond energy. This concept has extended its applicability beyond the realm of chemistry into the fields of physics, geology, materials science, electronics, and biology [Citation268,Citation292,Citation354–359]. The DFT appears to develop a fundamentally absolute notion of electronegativity and suggests an absolutely precise scale for measuring it. The articulation of qualitative concepts is frequently necessary for the rationalisation of a large body of dispersed knowledge. One such well-known electronic structure principle is Sanderson's electronegativity equalisation principle [Citation360–362]. According to the Electronegativity Equalisation Principle of Sanderson, chemical potentials must equalise when atoms with different chemical potentials combine to create a molecule with a unique chemical potential, as long as the atoms retain their identity [Citation363]. The density functional basis for the idea and definition of electronegativity provides support for the old Sanderson electronegativity equalisation theory. The geometric mean is typically used to calculate the electronegativity of the molecule from its constituent atoms [Citation364].
In recent years, a number of articles have been reported on electronegativity and its application in drug discovery and other domains [Citation365,Citation366]. The influence of electronegativity on the electro-sorption selectivity of anions following capacitive deionisation is investigated by Sun et al. [Citation367]. Rahm et al. [Citation368] stated a new electronegativity scale based on valence electron ground-state energies. Campero et al. [Citation369] proposed a new electronegativity scale based on statistical analysis. The authors found that electronegativity is modulated by physicochemical changes. Sproul [Citation370] also reported electronegativity scales and made a comparative analysis to assess different electronegativity scales. Tandon et al. [Citation371] established an electronegativity model based on polarizability within the framework of a Floating Spherical Gaussian Orbital. Saloni et al. [Citation372] proposed a new scale to obtain atomic electronegativity based on atomic and covalent potentials.
4.1.1.2. Electrophilicity index
The electrophilicity index is another extremely important global descriptor that has a correlation with the chemical reactivity. The electrophilicity index describes the capacity of a molecule for both donating and receiving electrons. If a molecule prefers to engage a nucleophilic or electrophilic substitution response at the responsive position, it will be determined by the global electrophilicity index along with the local parameters like the Fukui function and local electrophilicity index. The probable mechanism of the chemical response of a molecule can thus be predicted using quantum mechanical descriptors. The global electrophilicity index of a system can be used to predict how a drug will interact with a receptor. The interactions among the drug compounds have a good relationship with their global electrophilicity indices. The idea of the electrophilicity index was introduced by Parr and his coworkers in the year 1999 [Citation373]. There are several articles in which the electrophilicity index is well documented as well as Chattaraj at el. have done an extensive work on the electrophilicity index [Citation200–202,Citation207,Citation219,Citation221,Citation374–378]. Roy at el. [Citation379] studied the electrophilicity index to calculate the toxicity of Polyaromatic Hydrocarbons. Padmanabhan et al. [Citation380] examined the QSTR model for toxicity of aquatic (log (IGC50−1) set of nine chloroanilines beside T. pyriformis. Padmanabhan et al. [Citation381] investigated the electrophilicity index and established a QSAR model for the toxicity of chlorophenols by using a computational technique. An investigation was conducted into an in-silico QSAR model using electrophilicity as a potential descriptor against T. brucei by Pal et al. [Citation237].
The electrophilicity index is a crucial parameter to understanding configuration, reactivity, bonding, interactions, and dynamics in an extensive range of physicochemical frameworks. This index coupled with the local equivalent and the corresponding electronic structure principles might adequately describe molecular vibrations, internal alternations, and other chemical responses [Citation382]. Santschi et al. [Citation383] reported the electrophilicity index for the categorising of radicals by using experimental approaches, which is in line with the global electrophilicity index. Jupp et al. [Citation384] made a detailed study of the global electrophilicity index. In this work, Jupp et al. reported that the global electrophilicity index is a rapidly calculated metric that has a strong association with the fluoride ion affinity-measured Lewis acidity of numerous main group systems. Tandon et al. [Citation385] reported a new approach to compute atomic electrophilicity index invoking the force concept with the help of absolute atomic radii and effective nuclear charge. The physical and chemical properties of substances are often determined using the electrophilicity index, a key theoretical component of atoms and molecules. Therefore, it becomes important to identify an accurate and consistent expression for it. Tandon et al. [Citation386] reported the electrophilicity index of 74 elements (atomic number 1 to 57 and atomic number 72 to 88) by using ionisation energy and electron affinity and their outcomes are presented through a graph presented in Figure . It offers a more accurate way to assess any electronic changes that may be occurring in a species. The lowest electrophilicity principle, which states that the summation of the electrophilicity indices of the reaction yields will be lower than that of the reactants, is examined for its physical foundation, applicability, and limitations [Citation387]. Wei et al. [Citation388] reported that the electrophilicity index is a better indicator for photocatalytic degradation. Recently Pal et al [Citation389] predicted the aquatic toxicity of 169 aliphatic compounds against the protozoa Tetrahymena pyriformis and other ones and used the electrophilicity index to know the electronic behaviour of a molecule.
Figure 11. Computed electrophilicity index (in au) of 74 elements of the periodic table by Tandon et al. [Citation386].
![Figure 11. Computed electrophilicity index (in au) of 74 elements of the periodic table by Tandon et al. [Citation386].](/cms/asset/3ef7ac77-1d9a-4b66-8a0d-5afeb51aaa1a/tmph_a_2331620_f0011_oc.jpg)
Recently Saloni et al. [Citation390] have reported probable therapeutic for COVID-19 by using CDFT approach. CDFT based descriptors, IR spectra and thermal properties of these molecules are analysed. Ranjan et al. [Citation391] investigated repurpose drugs for COVID-19 by employing CDFT technique. CDFT based descriptors, optical and thermochemical properties of these repurpose drugs are analysed. An interesting relationship is observed among optimisation energy, zero-point energy correction, polarizability and thermal characteristics of these reused drugs. Ranjan et al. [Citation392] reported the possible inhibitors of COVID-19 by using DFT technique. Authors calculated CDFT based descriptors – HOMO–LUMO gap, hardness, softness, electronegativity, electrophilicity index, nucleophilicity index and dipole moment of these inhibitors. They found an interesting relationship between HOMO–LUMO gap and IR and Raman activity. Li et al. [Citation393] reported a new type of halogenated aromatic disinfection by-products with the help of molecular docking and QSAR modelling. QSAR data exhibits that the hydrophobicity, relation to CAT and hydrogen bonding acidity of these molecules are found to be key factors influencing their toxicology to zebrafish. Na et al. [Citation394] established a nano-mixed QSAR model by using molecular dynamics and mixture toxicity tests for aquatic environment and stated that this approach might be suitable in choosing a more secure MONPs combined arrangement.
5. Future perspective
Over the past few decades, the QSAR methodology has been subject to both acclaim and scrutiny regarding its reliability, limitations, achievements, and shortcomings. CDFT based descriptors’ future in QSAR investigations appear as very promising and significant. These descriptors have demonstrated a pivotal role in capturing the reactivity of compounds, making them useful tools for predicting biological activity and toxicity. Electron density based descriptors are able to predict biological activity with greater precision for a variety of substances, including complex chemicals and macromolecules. CDFT descriptors are capable of handling large and complicated systems as software and hardware evolve. Furthermore, molecular reactivity can be characterised by CDFT descriptors when solvents, temperatures, and pressures are considered. CDFT has the potential to expand beyond traditional QSAR studies as it incorporates more diverse molecular properties and interactions. Finally, CDFT descriptors are expected to become increasingly used in QSAR studies in the future and also utilised in advanced drug discovery, environmental risk assessment, and other molecular reactivity and interaction studies.
6. Conclusion
This review portrays the brief history of the concept of QSAR / QSPR /QSTR and vividly depicts the applications of some CDFT-based descriptors to predict QSAR/QSPR/QSTR models. CDFT provides a diverse range of tools to investigate numerous properties of atoms or molecules that become relevant upon their interaction with other systems. Quantum chemical descriptors are well known to predict robust QSAR models. DFT is an integral component of QC methods and it has evolved as one of the popular QC methods in recent times. CDFT has gained a significant attraction in modern-day research due to its easy applications in terms of global and local descriptors. This review has emphasised the applications of two popular global CDFT-based descriptors viz. electronegativity and electrophilicity index in QSAR / QSPR studies. The application portfolio of CDFT has witnessed a remarkable expansion over the past two decades, owing to advancements in methodologies, software, and hardware capatablecities. This progress has enabled researchers to include increasingly larger biosystems in their investigations. Looking forward, it is evident that further advancements are on the horizon, indicating that there is much more to come in the future. Success stories of CDFT-based descriptors to establish the accurate QSAR / QSPR models encourage further study in this domain.
Acknowledgements
Dr Tanmoy Chakraborty and Pooja Sharma would like to acknowledge Sharda University for providing computational facilities and research support. Dr Prabhat Ranjan would like to thank Manipal University Jaipur for providing computational facilities and research support.
Disclosure statement
No potential conflict of interest was reported by the author(s).
Data availability statement
The data generated during the study are available from the corresponding author upon reasonable request.
Additional information
Funding
References
- K. Roy, P. Ambure and S. Kar, ACS Omega. 9, 11392–11406 (2008). doi:10.1021/acsomega.8b01647
- U. Muhammad, A. Uzairu and D. Ebuka Arthur, J Anal Pharm Res. 7 (2), 240–242 (2018). doi:10.15406/japlr.2018.07.00232
- S. Norouzi, M. Farahani and S. Nejad Ebrahimi, Pharm Sci. 27, 94–108 (2021). doi:10.34172/PS.2020.98
- M. Karelson, Molecular Descriptors in QSAR/QSPR (Wiley Inter Science, Hoboken, New Jersey, U.S., 2000).
- C. Hansch and T. Fujita, J. Am. Chem. Soc. 86, 1616–1626 (1964). doi:10.1021/ja01062a035
- F.R. Burden, J. Chem. Inf. Comput. Sci. 41, 830–835 (2001). doi:10.1021/ci000459c
- A. Poater, A.G. Saliner, M. Sola, L. Cavallo and A.P. Worth, Expert Opin. Drug Deliv. 7, 295–305 (2010). doi:10.1517/17425240903508756
- J.D. McKinney, A. Richard, C. Waller, M.C. Newman and F. Gerberick, Toxicol. Sci. 56, 8–17 (2000). doi:10.1093/toxsci/56.1.8
- A.G. Saliner, A. Poater and A.P. Worth, IDrugs. 11, 728–732 (2008). PMID: 18828072
- A.G. Saliner, A. Poater, N. Jeliazkova, G. Patlewicz and A.P. Worth, Regul. Toxicol. Pharmacol. 52, 77–84 (2008). doi:10.1016/j.yrtph.2008.05.012
- A. Poater, A.G. Saliner, R. Carbo-Dorca, J. Poater, M. Sola, L. Cavallo and A.P. Worth, J. Comput. Chem. 30, 275–284 (2009). doi:10.1002/jcc.21041
- A.G. Saliner, E. Burello and A. Worth. Review of computational approaches for predicting the physicochemical and biological properties of nanoparticles. JRC report EUR EN., 2008.
- W. Durnie, W.D. Marco, A. Jefferson and B. Kinsella, J. Electrochem. Soc. 146, 1751 (1999). doi:10.1149/1.1391837
- P. Polishchuk, J. Chem. Inf. Model. 57, 2618 (2017). doi:10.1021/acs.jcim.7b00274
- K. Roy, Expert Opin. Drug Deliv. 2, 1567 (2007). doi:10.1517/17460441.2.12.1567
- M. Wawer, L. Peltason, N. Weskamp, A. Teckentrup and J. Bajorath, J. Med. Chem. 51, 6075 (2008). doi:10.1021/jm800867g
- R. Liu, H.Y. Zhang, Z.X. Ji, R. Rallo, T. Xia, C.H. Chang, A. Nel and Y. Cohen, Nanoscale. 5, 5644–5653 (2013). doi:10.1039/c3nr01533e
- S.-S. So and M. Karplus, J. Med. Chem. 39, 1521 (1996). doi:10.1021/jm9507035
- H. Wiener, J. Am. Chem. Soc. 69, 2636–2638 (1947). doi:10.1021/ja01203a022
- H. Wiener, J. Phys. Chem. 52, 1082–1089 (1948). doi:10.1021/j150462a018
- H. Wiener, J. Phys. Chem. 52, 425–430 (1948). doi:10.1021/j150458a014
- H. Hosoya, Bull. Chem. Soc. Jpn. 44, 2332–2339 (1971). doi:10.1246/bcsj.44.2332
- A.R. Katritzky and E.V. Gordeeva, J. Chem. Inf. Comput. Sci. 33, 835 (1993). doi:10.1021/ci00016a005
- T. Balaban, D. Mills, O. Ivanciuc and S.C. Basak, Croat. Chem. Act. 73, 923 (2000). https://hrcak.srce.hr/131968
- O. Ivanciuc, T. Ivanciuc, D.J. Klein, W.A. Seitz and A.T. Balaban, J. Chem. Inf. Comput. Sci. 41, 536–549 (2001). doi:10.1021/ci000086f
- F. Torrens, Molecules. 8, 169–185 (2003). doi:10.3390/80100169
- A. Balaban, SAR QSAR Environ. Res. 8, 1–21 (1998). doi:10.1080/10629369808033259
- E. Estrada, SAR QSAR Environ. Res. 11, 55–73 (2000). doi:10.1080/10629360008033229
- M. Randić, in Encyclopedia of Computational Chemistry, 1st ed. (John Wiley & Sons, Hoboken, NJ, 1998), pp. 3018–3032, 5, ISBN 978-0471965886.
- M. Randić, J. Math. Chem. 7, 155–168 (1991). doi:10.1007/BF01200821
- E. Estrada and E. Uriarte, Curr. Med. Chem. 8, 1699–1714 (2001). doi:10.2174/0929867013371923
- S.C. Basak, A.T. Balaban, G.D. Grunwald and B.D. Gute, J. Chem. Inf. Comput. Sci. 40, 891–898 (2000). doi:10.1021/ci990114y
- H. Patel and M.T.D. Cronin, J. Chem. Inf. Comput. Sci. 41, 1228–1236 (2001). doi:10.1021/ci0103673
- O. Ivanciuc, T. Ivanciuc, D. Cabrol Bass and A.T. Balaban, J. Chem. Inf. Comput. Sci. 40, 631–643 (2000). doi:10.1021/ci9900884
- M. Randić, J. Am. Chem. Soc. 69, 6609–6615 (1975). doi:10.1021/ja00856a001
- D. Plavšić, S. Nikolić, N. Trinajstić and Z. Mihalić, J. Math. Chem. 12, 235–250 (1993). doi:10.1007/BF01164638
- E. Estrada, J. Chem. Inf. Comp. Sci. 36, 846–849 (1996). doi:10.1021/ci950187r
- E. Estrada, J. Chem. Inf. Comp. Sci. 37, 320–328 (1997). doi:10.1021/ci960113v
- E. Estrada, J. Chem. Inf. Comp. Sci. 38, 123–127 (1998). doi:10.1021/ci970030u
- Z. Mihalic and N. Trinajstić, J. Chem. Educ. 69, 701–712 (1992). doi:10.1021/ed069p701
- M.V. Diudea, QSPR/QSAR Studies by Molecular Descriptors, edited by M.V. Diudea (Nova Science, Huntington, New York, NY, 2001), ISBN 1560728590.
- D.J.G. Marino, P.J. Peruzzo, E.A. Castro, and A.A. Toropov, Internet Electron. J. Mol. Des. 1, 115–133 (2002). http://www.biochempress.com
- O. Ivanciuc, J. Chem. Inf. Comput. Sci. 40, 1412–1422 (2000). doi:10.1021/ci000068y
- J.R. Broach and J. Thorner, Nature. 384, 14–16 (1996). doi:10.1038/384014a0
- A.V. Raichurkar, U.A. Shah and V.M. Kulkarni, Med. Chem. 7, 543–552 (2011). doi:10.2174/157340611797928352
- A. Gaurav, M.R. Yadav, R. Giridhar, V. Gautam and R. Singh, Med. Chem. Res. 20, 192–199 (2011). doi:10.1007/s00044-010-9306-5
- N. Sinha and S. Sen, Eur. J. Med. Chem. 46, 618–630 (2011). doi:10.1016/j.ejmech.2010.11.042
- H.P. Singh, A.P. Chaturvedi and C.S. Sharma, Int. J. Pharm. Tech. Res. 3, 231–236 (2011). PMID:8585963.
- B.W. Clare and C.T. Supuran, Eur. J. Med. Chem. 34, 463–474 (1999). doi:10.1016/S0223-5234(99)80096-8
- A.J. Hameed, M. Ibrahim and H. El Haes, J. Mol. Struct. Theochem. 809, 131–136 (2007). doi:10.1016/j.theochem.2007.01.021
- B. Tekiner-Gulbas, O. Temiz-Arpaci, E. Oksuzoglu, H. Eroglu, I. Yildiz, N. Diril, E. Aki-Sener and I. Yalcin, SAR QSAR Environ. Res. 18, 251–263 (2007). doi:10.1080/10629360701303966
- P. Panda, S. Samanta, S.M. Alam, S. Basu and T. Jha, Internet Elect. J. Mol. Des. 6, 280–301 (2007). https://hdl.handle.net/10356/104837
- A.U. Khan, Drug Discov. Today. 21, 291–1302 (2016). doi:10.1016/j.drudis.2016.06.013
- M. Goodarzi, B. Dejaegher and Y.V. Heyden, J. AOAC Int. 95, 636–651 (2012). doi:10.5740/jaoacint.SGE_Goodarzi
- E. Eroglu and H. Türkmen, J. Mol. Graph. Model. 26, 701–708 (2007). doi:10.1016/j.jmgm.2007.03.015
- F.A. Pasha, S.J. Cho, Y. Beg and Y.B. Tripathi, Med. Chem. Res. 16, 408–417 (2007). doi:10.1007/s00044-007-9060-5
- M. Rucki and M. Tichy, Interdiscip Toxicol. 2, 184–186 (2009). doi:10.2478/v10102-009-0014-2
- A. Golbraikh, M. Shen, Z. Xiao, Y.-D. Xiao, K.-H. Lee, and A. Tropsha, J. Comput. Aided. Mol. Des. 17, 241–253 (2003). doi:10.1023/A:1025386326946
- C. Hansch, J.F. Sinclair and P.R. Sinclair, QSAR. 9, 223–226 (1990). doi:10.1002/qsar.19900090306
- E.B. Wedebye, M. Dybdahl, N.G. Nikolov, S.Ó. Jónsdóttir, and J.R. Niemelä, Reprod. Toxicol. 55, 64–72 (2015). doi:10.1016/j.reprotox.2015.03.002
- H. Kubinyi, QSAR. 21 (4), 348–356 (2002). doi:10.1002/1521-3838(200210)21:4%3C348::AID-QSAR348%3E3.0.CO;2-D
- A.C. Brown and T.R. Fraser, J. Anat. Physiol. 2, 224–242 (1868). https://pubmed.ncbi.nlm.nih.gov/17230757
- C. Richet, Compt. Rend. Soc. Biol.(Paris) 45, 775–780 (1893).
- C. Richet, Soc. Biol. Sec. Fil. 9, 775–776 (1893). https://lccn.loc.gov/sn77011760
- R.H. Law, A. Mellors and F.R. Hallett, Environ. Res. 36, 193–205 (1985). doi:10.1016/0013-9351(85)90017-9
- C. Hansch, P.P. Maloney, T. Fujita and R.M. Muir, Nature. 194, 178–180 (1962). doi:10.1038/194178b0
- C. Hansch and T. Fujita, J. Am. Chem. Soc. 86, 1616–1626 (1964). doi:10.1021/ja01062a035
- G. Jana, R. Pal, S. Sural and P.K. Chattaraj, Int. J. Quantum Chem. 120, 26097 (2020). doi:10.1002/qua.26097
- C. Hansch, A.R. Steward, S.M. Anderson and D.M. Bentley, J. Med. Chem. 11, 1–11 (1968). doi:10.1021/jm00307a001
- A.F.A. Cros, Ph. D. thesis, Faculté de médecine de Strasbourg, 1863.
- S. Arulmozhiraja and M. Morita, Chem. Res. Toxicol. 17, 348–356 (2004). doi:10.1021/tx0300380
- H. Meyer, Exp. Pathol. Pharmakol. 42, 109–118 (1899). doi:10.1007/BF01834479
- L.P. Hammett, Chem. Rev. 17, 125–136 (1935). doi:10.1021/cr60056a010
- L.P. Hammett, J. Am. Chem. Soc. 59, 96–103 (1937). doi:10.1021/ja01280a022
- S.M. Free and J.W. Wilson, J. Med. Chem. 7, 395–399 (1964). doi:10.1021/jm00334a001
- M.H.S. Segler, ACS. Cent. Sci. 4, 120–131 (2018). doi:10.1021/acscentsci.7b00512
- C. Hansch, Acc. Chem. Res. 2, 232–239 (1969). doi:10.1021/ar50020a002
- A.R. Katritzky, V.S. Lobanov and M. Karelson, Chem. Soc. Rev. 24, 279–287 (1995). doi:10.1039/cs9952400279
- S. Gebreyohannes, Y. Dad-Mohammadi, B.J. Neely and A.M. Gasem, Ind. Eng. Chem. Res. 55, 1102–1116 (2016). doi:10.1021/acs.iecr.5b03858
- G.Y. Lee, J. Comput. Chem. 30, 2181–2186 (2009). doi:10.1002/jcc.21216
- R.M. Marrero, Y. Marrero-Ponce, S.J. Barigye, Y.E. Diaz, R. Acevedo-Barrios, G.M. Casanola-Martin, M.G. Bernal, F. Torrens and F. Perez-Gimenez, SAR QSAR Environ. Res. 26, 943–958 (2015). doi:10.1080/1062936X.2015.1104517
- D. Erhan, J. Chem. Inf. Model. 6, 626–635 (2006). doi:10.1021/ci050367t
- H. Si, T. Wang, K. Zhang, Y.-B. Duan, S. Yuan, S. Fu and Z. Hu, Anal. Chim. Acta. 591, 255–264 (2007). doi:10.1016/j.aca.2007.03.070
- V. Svetnik, A. Liaw, C. Tong, J.C. Culberson, R.P. Sheridan and B.P. Feuston, J. Chem.: Inf. Comput. Sci. 43, 1947–1958 (2003). doi:10.1021/ci034160g
- L. Zhang and H. Zhu, Drug. Disco. Today. 22, 1680–1685 (2017). doi:10.1016/j.drudis.2017.08.010
- Y. Jing, Y. Bian, Z. Hu, L. Wang and X.Q. Xie, AAPS J. 30, 58 (2018). doi:10.1208/s12248-018-0210-0
- T. He, H. Mao, J. Guo and Z. Yi, Image. Vis. Comput. 60, 142–153 (2017). doi:10.1016/j.imavis.2016.11.010
- S. Ren, K. He, R. Girshick and J. Sun, IEEE Trans. Patt. Anal. Mach. Intell. 39, 1137–1149 (2017). doi:10.1109/TPAMI.2016.2577031
- X.W. Chen and X. Lin, IEEE. Access. 2, 514–525 (2014). doi:10.1109/ACCESS.2014.2325029
- S.K. Chakravarti and S.R.M. Alla, Front. Artif. Intell. 2, 17 (2019). doi:10.3389/frai.2019.00017
- P. Gedeck, C. Kramer and P. Ertl, Prog. Med. Chem. 49, 113–160 (2010). doi:10.1016/S0079-6468(10)49004-9
- T. Scior, J.L. Medina-Franco, Q.T. Do, K. Martinez-Mayorga, J.A.Y. Rojas and P. Bernard, Curr. Med. Chem. 16, 4297–4313 (2009). doi:10.2174/092986709789578213
- A. Tropsha, Mol. Inform. 29, 476–488 (2010). doi:10.1002/minf.201000061
- T.M. Martin, P. Harten, D.M. Young, E.N. Muratov, A. Golbraikh, H. Zhu and A. Tropsha, J. Chem. Inf. Model. 52, 2570–2578 (2012). doi:10.1021/ci300338w
- L. Eriksson, J. Jaworska, A.P. Worth, M.T.D. Cronin, R.M. McDowell and P. Gramatica, Environ. Health. Perspect. 111, 1361–1375 (2003). doi:10.1289/ehp.5758
- A. Tropsha, P. Gramatica and V.K. Gombar, QSAR Comb. Sci. 22, 69–77 (2003). doi:10.1002/qsar.200390007
- P. Gramatica, QSAR Comb. Sci. 26, 694–701 (2007). doi:10.1002/qsar.200610151
- N. Chirico and P. Gramatica, J. Chem. Inf. Model. 51, 2320–2335 (2011). doi:10.1021/ci200211n
- D.L.J. Alexander, A. Tropsha and D.A. Winkler, J. Chem. Inf. Model. 55, 1316–1322 (2015). doi:10.1021/acs.jcim.5b00206
- A. Golbraikh and A. Tropsha, J. Mol. Graph. Model. 20, 269–276 (2002). doi:10.1016/S1093-3263(01)00123-1
- S.R. Johnson, J. Chem. Inf. Model. 48, 25–26 (2008). doi:10.1021/ci700332k
- J. Huang and X. Fan, Mol. Pharm. 8, 600–608 (2011). doi:10.1021/mp100423u
- R. Benigni and C. Bossa, J. Chem. Inf. Model. 48, 971–980 (2008). doi:10.1021/ci8000088
- J.C. Dearden, M.T.D. Cronin and K.L.E. Kaiser, SAR QSAR Environ. Res. 20, 241–266 (2009). doi:10.1080/10629360902949567
- A.M. Doweyk, J. Comput. Aided. Mol. Des. 22, 81–89 (2008). doi:10.1007/s10822-007-9162-7
- C. Hansch, P.G. Sammes and J.B. Taylor, in Comprehensive Medicinal Chemistry (Pergamon Press, New York, 1990). pp. 33–58, 4.
- M. Matveieva and P. Polishchuk, J. Cheminform. 13, 41 (2021). doi:10.1186/s13321-021-00519-x
- P. Gramatica and A. Sangion, J. Chem. Inf. Model. 56, 1127–1113 (2016). doi:10.1021/acs.jcim.6b00088
- S. Kausar and A.O. Falcao, Molecules. 24, 1698 (2019). doi:10.3390/molecules24091698
- K. Roy and I. Mitra, Comb. Chem. High Throughput. Screen. 14, 450–474 (2011). doi:10.2174/138620711795767893
- K. Roy, P. Chakraborty, I. Mitra, P.K. Ojha, S. Kar and R.N. Das, J. Comp. Chem. 34, 1071–1082 (2013). doi:10.1002/jcc.23231
- N. Chirico and P. Gramatica, J. Chem. Inf. Model. 51, 2320–2335 (2011). doi:10.1021/ci200211n
- E. Papa and P. Gramatica, Green Chem. 12, 836–843 (2010). doi:10.1039/b923843c
- H. Zhu, A. Tropsha, D. Fourches, A. Varnek, E. Papa, P. Gramatica, T. Oberg, P. Dao, A. Cherkasov and I.V. Tetko, J. Chem. Inf. Model. 48, 766–784 (2008). doi:10.1021/ci700443v
- E. Papa, L.V.D. Wal, J.A. Arnot and P. Gramatica, Sci. Total. Environ. 470-471, 1040–1046 (2014). doi:10.1016/j.scitotenv.2013.10.068
- H. Zhu, T.M. Martin, L. Ye, A. Sedykh, D.M. Young and A. Tropsha, Chem. Res. Toxicol. 22, 1913–1921 (2009). doi:10.1021/tx900189p
- K. Héberger, TrAC-Trends Anal. Chem. 29, 101–109 (2010). doi:10.1016/j.trac.2009.09.009
- K. Kollár-Hunek and K. Héberger, Chemom. Intell. Lab. Syst. 127, 139–146 (2013). doi:10.1016/j.chemolab.2013.06.007
- A. Golbraikh and A. Tropsha, J. Chem. Inf. Comput. Sci. 43, 144–154 (2003). doi:10.1021/ci025516b
- M. Karelson, V.S. Lobanov and A.R. Katritzky, Chem. Rev. 96, 1027–1044 (1996). doi:10.1021/cr950202r
- X. Huang, Y. Feng, C. Hu, X. Xiao, D. Yu and X. Zou, Chemosphere. 138, 183–189 (2015). doi:10.1016/j.chemosphere.2015.05.075
- X. Luo, X. Wei, J. Chen, Q. Xie, X. Yang and W.J. Peijnenburg, Water Res. 166, 115083 (2019). doi:10.1016/j.watres.2019.115083
- M. Randić, J. Math. Chem. 7 (1), 155–168 (1991). doi:10.1007/BF01200821
- A.D. McNaught, Compendium of Chemical Terminology (Blackwell Science, Oxford, 1997), 1669.
- D. Weininger, J. Chem. Inf. Comput. Sci. 28 (1), 31–36 (1988). doi:10.1021/ci00057a005
- R. Heller, L. Chikhi and H.R. Siegismund, PLoS One. 8 (5), 62992 (2013). doi:10.1371/journal.pone.0062992
- A.A. Toropov, A.P. Toropova, T. Puzyn, E. Benfenati, G. Gini, D. Leszczynska and J. Leszczynski, Chemosphere. 92, 31–37 (2013). doi:10.1016/j.chemosphere.2013.03.012
- H. Tandon, P. Yadav, T. Chakraborty and V. Suhag, J. Organomet. Chem. 960, 122229 (2022). doi:10.1016/j.jorganchem.2021.122229
- P. Wadhwa and A. Mittal, in Computer Aided Pharmaceutics and Drug Delivery: An Application Guide for Students and Researchers of Pharmaceutical Sciences (Springer Nature Singapore, Singapore, 2022). pp. 543–560.
- M.T. Cronin and A.P. Worth, QSAR Comb. Sci. 27, 91–100 (2008). doi:10.1002/qsar.200710118
- A.R. Katritzky, A.S. Girgis, S. Slavov, S.R. Tala and I. Stoyanova-Slavova, Eur. J. Med. Chem. 45, 5183–5199 (2010). doi:10.1016/j.ejmech.2010.08.033
- H. Zhang, Y. Yu, J. Jiao, E. Xing, L. El Ghaoui and M. Jordan, in International Conference on Machine Learning (Long Beach, California, USA, 2019), pp. 7472–7482.
- Y. Hou, C.J. Morrison and S.M. Cramer, Anal. Chem. 83, 3709–3716 (2011). doi:10.1021/ac103336h
- A.R. Katritzky, R. Petrukhin, D. Tatham, S. Basak, E. Benfenati, M. Karelson and U. Maran, J. Chem. Inf. Comput. Sci. 41, 679–685 (2001). doi:10.1021/ci000134w
- J. Huuskonen, Environ. Toxicol. Chem. 22, 816–820 (2003). doi:10.1002/etc.5620220420
- P.P. Roy, S. Paul, I. Mitra and K. Roy, Molecules. 14, 1660–1701 (2009). doi:10.3390/molecules14051660
- E. Papa and P. Gramatica, J. Mol. Graphs. Model. 27, 59–65 (2008). doi:10.1016/j.jmgm.2008.02.004
- F. Torrens and G. Castellano, J. Environ. Sci. Health B. 49, 400–407 (2014). doi:10.1080/03601234.2014.894773
- I. Kovalevska, O. Ruban, A. Volkova, A. Kotvitska and A. Cherkashyna, Pharmacia. 69 (2), 303–310 (2022). doi:10.3897/pharmacia.69.e79179
- N. Vladimirova, E. Puchkova, D. Dar’in, A. Turanov, V. Babain and D. Kirsanov, Membranes. 12, 953 (2022). doi:10.3390/membranes12100953
- O. Deeb and M. Goodarzi, Curr. Drug Saf. 7, 289–297 (2012). doi:10.2174/157488612804096533
- K. Roy, I. Mitra, S. Kar, P.K. Ojha, R.N. Das and H. Kabir, J. Chem. Inf. Model. 52, 396–408 (2012). doi:10.1021/ci200520g
- P.K. Ojha, I. Mitra, R.N. Das and K. Roy, Chemom. Intell. Lab. Syst. 107, 194–205 (2011). doi:10.1016/j.chemolab.2011.03.011
- I. Mitra, A. Saha and K. Roy, Mol. Simul. 36, 1067–1079 (2010). doi:10.1080/08927022.2010.503326
- N. Basant, S. Gupta and K.P. Singh, Chemosphere. 139, 246–255 (2015). doi:10.1016/j.chemosphere.2015.06.063
- M. Shahlaei, A. Fassihi and L. Saghaie, Eur. J. Med. Chem. 45, 1572–1582 (2010). doi:10.1016/j.ejmech.2009.12.066
- H. Perez-Sanchez, G. Cano and J. Garcia-Rodriguez, Appl. Soft Comput. 20, 119–126 (2014). doi:10.1016/j.asoc.2013.10.033
- S. Ajmani, K. Jadhav and S.A. Kulkarni, J. Chem. Inf. Model. 46, 24–31 (2006). doi:10.1021/ci0501286
- P. Itskowitz and A. Tropsha, J. Chem.: Inf. Model. 45, 777–785 (2005). doi:10.1021/ci049628+
- K. Roy and G. Ghosh, Chem. Biol. Drug Des. 72, 383–394 (2008). doi:10.1111/j.1747-0285.2008.00712.x
- F. Ghasemi, A. Mehridehnavi, A. Fassihi and H. Pérez-Sánchez, Appl. Soft. Comput. 62, 251–258 (2018). doi:10.1016/j.asoc.2017.09.040
- M. Shahlaei, A. Madadkar-Sobhani, A. Fassihi, L. Saghaie, D. Shamshirian and H. Sakhi, Med. Chem. Res. 21, 100–115 (2012). doi:10.1007/s00044-010-9501-4
- F. Nigsch, A. Bender, B.V. Buuren, J. Tissen, E. Nigsch and J.B.O. Mitchell, J. Chem. Inf. Model. 46, 2412–2422 (2006). doi:10.1021/ci060149f
- P.D. Mosier and P.C. Jurs, J. Chem. Inf. Comput. Sci. 42, 1460–1470 (2002). doi:10.1021/ci020039i
- M. Ahmadi and M. Shahlaei, Res. Pharm. Sci. 10, 307–325 (2015).
- M. Shahlaei and A. Fassihi, Med. Chem. Res. 22, 4384–4400 (2013). doi:10.1007/s00044-012-0430-2
- M. Shahlaei, R. Sabet, M.B. Ziari, B. Moeinifard, A. Fassihi and R. Karbakhsh, Eur. J. Med. Chem. 45, 4499–4508 (2010). doi:10.1016/j.ejmech.2010.07.010
- G. Cano, J. García-Rodríguez and H. Pérez-Sánchez, Lett. Drug Des. Discov. 11, 33–39 (2014). doi:10.2174/15701808113109990054
- K. Goryński, B. Bojko, A. Nowaczyk, A. Buciński, J. Pawliszyn and R. Kaliszan, Analytica Chimica Acta. 797, 13–19 (2013). doi:10.1016/j.aca.2013.08.025
- G.P. Moss, J.C. Dearden, H. Patel and M.T. Cronin, Toxicol. In vitro. 16, 299–317 (2002). doi:10.1016/S0887-2333(02)00003-6
- L. Zhang, H. Zhu, T.I. Oprea, A. Golbraikh and A. Tropsha, Pharm. Res. 25, 1902 (2008). doi:10.1007/s11095-008-9609-0
- K. Roy and A.S. Mandal, J. Enzyme Inhib. Med. Chem. 23, 980–995 (2008). doi:10.1080/14756360701811379
- T. Magdziarz, P. Mazur and J. Polanski, J. Mol. Model. 15, 41–51 (2009). doi:10.1007/s00894-008-0373-1
- C.W. Yap, H. Li, Z.L. Ji and Y.Z. Chen, Mini-Rev. Med. Chem. 7, 1097–1107 (2007). doi:10.2174/138955707782331696
- J.G. Topliss and R.P. Edwards, J. Med. Chem. 22, 1238–1244 (1979). doi:10.1021/jm00196a017
- L. Eriksson, J. Jaworska, A.P. Worth, M.T.D. Cronin, R.M. McDowell and P. Gramatica, Environ. Health Perspect. 111, 1361–1375 (2003). doi:10.1289/ehp.5758
- D.E. Goldberg, Genetic Algorithms in Search, Optimization, and Machine Learning (Addison-Wesley Longman Publishing Co., Inc., Boston, MA, USA, 1989).
- J. Roy and K. Roy, Environ. Sci.: Nano. 9, 3456–3470 (2022). doi:10.1039/D2EN00303A
- C. Joo, H. Park, H. Kwon, J. Lim, E. Shin, H. Cho and J. Kim, Polym. 14 (17), 3500 (2022). doi:10.3390/polym14173500
- F. Sadeghi, A. Afkhami, T. Madrakian and R. Ghavami, Sci. Rep. 12 (1), 6090 (2022). doi:10.1038/s41598-022-09843-0
- T.W. Quadri, L.O. Olasunkanmi, E.D. Akpan, O.E. Fayemi, H.S. Lee, H. Lgaz, C. Verma, L. Guo, S. Kaya and E.E. Ebenso, Mater. Today Commun. 30, 103163 (2022). doi:10.1016/j.mtcomm.2022.103163
- W. Liman, M. Oubahmane, I. Hdoufane, I. Bjij, D. Villemin, R. Daoud, D. Cherqaoui and A. El Allali, Molecules. 27 (9), 2729 (2022). doi:10.3390/molecules27092729
- P. Liu and W. Long, Int. J. Mol. Sci. 10 (5), 1978–1998 (2009). doi:10.3390/ijms10051978
- R.S. Witte and J.S. Witte, Statistics (John Wiley & Sons, Hoboken, New Jersey, 2017).
- K.G. Jöreskog and H.O. Wold, Systems under indirect observation: Causality, structure prediction. (No Title) 1982.
- O.B. Korkmazoglu and G. Kemalbay, Procedia Soc. Behav. Sci. 62, 906–910 (2012). doi:10.1016/j.sbspro.2012.09.153
- H. Abdi, in Encyclopedia of Measurement and Statistics, edited by N.J. Saikind (Sage, Thousand Oaks, CA, 2007).
- P. De and K. Roy, In Silico Pharmacol. 11, 9 (2023). doi:10.1007/s40203-023-00146-4
- F.E. Bennani, L. Doudach, K. Karrouchi, C.E. Rudd and M.E.A. Faouzi, Comput.Toxicol. 26, 100265 (2023). doi:10.1016/j.comtox.2023.100265
- M. Mirshafiei, A. Niazi and A. Yazdanipour, Period. Polytech. Chem. Eng. 67, 141–160 (2023). doi:10.3311/PPch.20852
- A. Kumar, P.K. Ojha and K. Roy, Comput. Toxicol. 26, 100270 (2023). doi:10.1016/j.comtox.2023.100270
- X. Huo, J. Xu, M. Xu and H. Chen, Artif. Intell. Life Sci. 3, 100065 (2023). doi:10.1016/j.ailsci.2023.100065
- L. Bierman, Mach. Learn. 45, 5–32 (2001). doi:10.1023/A:1010933404324
- K. Fawagreh, M.M. Gaber and E. Elyan, Syst. Sci. Control Eng. Open Access J. 2, 602–609 (2014). doi:10.1080/21642583.2014.956265
- C. Montes and Z. Kapelan, Water Res. 189, 116639 (2021). doi:10.1016/j.watres.2020.116639
- G.Y. Oukawa, P. Krecl and A.C. Targino, Sci. Total Environ. 815, 152836 (2022). doi:10.1016/j.scitotenv.2021.152836
- T. Schlender, M. Viljanen, J.N. van Rijn, F. Mohr, W.J. Peijnenburg, H.H. Hoos, E. Rorije and A. Wong, Environ. Sci. Technol. (46), 17818–17830 (2023).
- G. Karaduman and F. Kelleci Celik, J. Appl.Toxicol. (2023). doi:10.1002/jat.4475
- E. Pourbasheer, R. Aalizadeh, J.S. Ardabili and M.R. Ganjali, J. Mol. Lid. 204, 162–169 (2015). doi:10.1016/j.molliq.2015.01.028
- A. Gajewicz-Skretna, S. Kar, M. Piotrowska and J. Leszczynski, J. Cheminform. 13, 1–20 (2021). doi:10.1186/s13321-021-00484-5
- P.M. Khan and K. Roy, Expert Opin. Drug Discov. 13, 1075–1089 (2018). doi:10.1080/17460441.2018.1542428
- J.F. Aranda, D.E. Bacelo, M.S.L. Aparicio, M.A. Ocsachoque, E.A. Castro and P.R. Duchowicz, SAR QSAR., Environ. Res. 28, 749–763 (2017). doi:10.1080/1062936X.2017.1377765
- Z. Shi, F. Song, C. Ji, Y. Xiao, C. Peng and H. Liu, Ind. Eng. Chem. Res. (2024). doi:10.1080/17460441.2018.1542428
- K. Roy, S. Kar and R.N. Das. Understanding the Basics of QSAR for Applications in Pharmaceutical Sciences and Risk Assessment (Academic Press, Amsterdam, 2015).
- R.D. Cramer, D.E. Patterson and J.D. Bunce, J. Am. Chem. Soc. 110 (18), 5959–5967 (1998). doi:10.1021/ja00226a005
- S.P. Niculescu, J. Mol. Struct. 622, 71–83 (1988). doi:10.1016/S0166-1280(02)00619-X
- J.H. Friedman and C.B. Roosen, Stat. Methods Med. Res. 4, 197–217 (1995). doi:10.1177/096228029500400303
- D. Rogers and A.J. Hopfinger, J. Chem. Inf. Comput. Sci. 34, 854–866 (1994). doi:10.1021/ci00020a020
- P. Patel, N. Navneesh, B. Kurmi, N.K. Rangra, G.D. Gupta, R. Rawat, M.A. Pagano, A.M. Brunati and H. Rajak. 1, 3, 5-Triazine Based Hydroxamic Acid Analogues as HDAC Inhibitors: Integrated Modelling by 3D QSAR, Hypogen Pharmacophore Based Virtual Screening and Molecular Dynamic Simulation Studies (2023).
- K. Rullah, M. Roney, Z. Ibrahim, N.F. Shamsudin, D. Islami, Q.U. Ahmed, K.W. Lam and M.F.F. Mohd Aluwi, J. Comput. Biophys.Chem. 22, 77–97 (2023). doi:10.1142/S2737416523500059
- L.K. Akinola, A. Uzairu, G.A. Shallangwa and S.E. Abechi, Struct. Chem. 34, 477–490 (2023). doi:10.1007/s11224-022-01992-2
- W. Zheng and A. Tropsha, J. Chem. Inf. Comput. Sci. 40, 185–194 (2000). doi:10.1021/ci980033m
- A. Tropsha, in Burger’s Medicinal Chemistry and Drug Discovery, edited by D. Abraham (Wiley, New York, 2003). pp. 49–77.
- E. Fix and J.L. Hodges, Jr, Int. Stat. Rev. 57, 238–247 (1989). doi:10.2307/1403797
- R.A. Johnson and D.W. Wichern, Applied Multivariate Statistical Analysis (Prentice Hall, Englewood Cliffs, NJ, 1982).
- J.Y. Xu, K. Wang, S.H. Men, Y. Yang, Q. Zhou and Z.G. Yan, Environ. Int. 177, 108003 (2023). doi:10.1016/j.envint.2023.108003
- J.H. Hsieh, X.S. Wang, D. Teotico, A. Golbraikh and A. Tropsha, J. Comput. Aided Mol. Des. 22, 593–609 (2008). doi:10.1007/s10822-008-9199-2
- M. Shen, C. Béguin, A. Golbraikh, J.P. Stables, H. Kohn and A. Tropsha, J. Med. Chem. 47 (9), 2356–2364 (2004). doi:10.1021/jm030584q
- Z. Xiao, Y.D. Xiao, J. Feng, A. Golbraikh, A. Tropsha and K.H. Lee, J. Med. Chem. 45 (11), 2294–2309 (2002). doi:10.1021/jm0105427
- B.J. Wythoff, Chemom. Intell. Lab. Syst. 18, 115–155 (1993). doi:10.1016/0169-7439(93)80052-J
- X. Zhang, W. Li, X. Zhang, G. Cai, K. Meng and Z. Shen, PLoS One. 18, 0281471 (2023). doi:10.1371/journal.pone.0281471
- A.A. Sleem, A.R. Mohammed, S. Al Shkoor and H. Saleh, in 2022 3rd International Conference on Intelligent Engineering and Management (ICIEM) (United Kingdom and Ireland, Curran Associates, Inc., 2022). pp. 226–231.
- S. Sivamani, B.N. Prasad, K. Nithya, N. Sivarajasekar and A. Hosseini-Bandegharaei, Int. J. Environ. Sci. Tech. 19, 4321–4336 (2022). doi:10.1007/s13762-021-03411-1
- D.F. Specht, IEEE Trans. Neural Netw. 2, 568–576 (1991). doi:10.1109/72.97934
- E. Parzen, Ann. Math. Statist. 33, 1065–1076 (1962). doi:10.1214/aoms/1177704472
- S. Qu, M. Zhou, S. Jiao, Z. Zhang, K. Xue, J. Long, F. Zha, Y. Chen, J. Li, Q. Yang and Y. Wang, PLoS One. 17 (5), e0267747 (2022). doi:10.1371/journal.pone.0267747
- X. Yu and W.E. Acree, Jr, J. Mol. Liq. 376, 121455 (2023). doi:10.1016/j.molliq.2023.121455
- C. Cortes and V. Vapnik, Mach. Learn. 20, 273–297 (1995). doi:10.1007/BF00994018
- V. Vapnik. The Support Vector method of function estimation. US Patent 5, 1999, 950, 146.
- A.J. Smola and B. Scholkopf, Stat. Comput. 14, 199–222 (2004). doi:10.1023/B:STCO.0000035301.49549.88
- Z. Yuan and B. Huang, Proteins. 57, 558–564 (2004). doi:10.1002/prot.20234
- V.N. Vapnik, in Statistics for Engineering and Information Science, 2nd ed. (Springer, New York, NY, 2000.
- X.J. Yao, A. Panaye, J.P. Doucet, R.S. Zhang, H.F. Chen, M.C. Liu, Z.D. Hu and B.T. Fan, J. Chem. Inf. Comput. Sci. 44, 1257–1266 (2004). doi:10.1021/ci049965i
- Y. Shi, Sci. Rep. 11, 8806 (2021). doi:10.1038/s41598-021-88341-1
- M.K. Leong and G.H. Ta, Med. Sci. Forum. 14, 132 (2022). doi:10.3390/ECMC2022-13166
- L. Hu, X. Huang, Q. Zeng, Y. Wang and S. Li, Rev. Roum. Chim. 67, 321–328 (2022). doi:10.33224/rrch.2022.67.4-5.11
- A. Daghighi, G.M. Casanola-Martin, T. Timmerman, D. Milenković, B. Lučić and B. Rasulev, Toxics. 10, 746 (2022). doi:10.3390/toxics10120746
- ÉP de Moura, N.D. Fernandes, A.F. Monteiro, H.I.R. de Medeiros, M.T. Scotti and L. Scotti, Curr. Med. Chem. 28, 7808–7829 (2021). doi:10.2174/0929867328666210603104749
- Z. Wu, M. Zhu, Y. Kang, E.L.H. Leung, T. Lei, C. Shen, D. Jiang, Z. Wang, D. Cao and T. Hou, Brief. Bioinform. 22, 321 (2021). doi:10.1093/bib/bbaa321
- Ai, H.; Wu, X.; Zhang, L.; Qi, M.; Zao, Y.; Zhao, Q.; Zhao, J.; Liu, H.. Ecotoxicol. Environ. Saf. 2019, 179, 71-78. doi:10.1016/j.ecoenv.2019.04.035
- I. Olier, N. Sadawi, G.R. Bickerton, J. Vanschoren, C. Grosan, L. Soldatova and R.D. King, Mach. Learn. 107, 285–311 (2018). doi:10.1007/s10994-017-5685-x
- K. Mansouri, N.F. Cariello, A. Korotcov, V. Tkachenko, C.M. Grulke, C.S. Sprankle, D. Allen, W.M. Casey, N.C. Kleinstreuer and A.J. Williams, J. Cheminform. 11, 1–20 (2019). doi:10.1186/s13321-019-0384-1
- M.R. Keyvanpour and M.B. Shirzad, Curr. Drug Discov. Technol. 18, 17–30 (2021). doi:10.2174/1570163817666200316104404
- Z. Du, D. Wang and Y. Li, ACS Omega. 7, 25760–25771 (2022). doi:10.1021/acsomega.2c03062
- T.A. Soares, A. Nunes-Alves, A. Mazzolari, F. Ruggiu, G.W. Wei and K. Merz, J. Chem. Inf. Model. 62, 5317–5320 (2022). doi:10.1021/acs.jcim.2c01422
- Y. Liu, Y. Guo, W. Wu, Y. Xiong, C. Sun, L. Yuan and M. Li, Interdiscip. Sci. Comput. Life Sci. 11, 738–747 (2019). doi:10.1007/s12539-019-00346-7
- R. Pal, G. Pal, G. Jana and P.K. Chattaraj, Int. J. Chemoinform. Chem. Eng. (IJCCE). 8, 57–68 (2019). doi:10.4018/IJCCE.20190701.oa1
- U. Sarkar and P.K. Chattaraj, J. Phys. Chem. A. 125, 2051–2060 (2021). doi:10.1021/acs.jpca.0c10788
- R. Pal, A. Poddar and P.K. Chattaraj, J. Phys. Chem. A. 126, 6801–6813 (2022). doi:10.1021/acs.jpca.2c04106
- M. Ghara, H. Mondal, R. Pal and P.K. Chattaraj, J. Phys. Chem. A., 4561–4582 (2023). doi:10.1021/acs.jpca.3c0214121
- D. Chakraborty and P.K. Chattaraj, Chem. Sci. 12, 6264–6279 (2021). doi:10.1039/D0SC07017C
- R. Pal, P. Das and P.K. Chattaraj, J. Phys. Chem. Letters. 14, 3468–3482 (2023). doi:10.1021/acs.jpclett.3c00246
- K. Roy, S. Kar, R.N. Das, K. Roy, S. Kar and R.N. Das, in A Primer on QSAR/QSPR Modeling: Fundamental Concepts (Springer, Berlin, Heidelberg, Dordrecht, and New York City, 2015). pp. 37–59.
- R. Veerasamy, H. Rajak, A. Jain, S. Sivadasan, C.P. Varghese and R.K. Agrawal, Int. J. Drug Des. Discov. 3, 511–519 (2011).
- P. De, S. Kar, P. Ambure and K. Roy, Arch. Toxicol. 96 (5), 1279–1295 (2022). doi:10.1007/s00204-022-03252-y
- P.K. Ojha and K. Roy, Food Chem. Toxicol. 112, 551–562 (2018). doi:10.1016/j.fct.2017.03.043
- A. Mikolajczyk, A. Gajewicz, E. Mulkiewicz, B. Rasulev, M. Marchelek, M. Diak, S. Hirano and A. Zaleska-Medynska, Environ. Sci. Nano. 5 (5), 1150–1160 (2018). doi:10.1039/C8EN00085A
- A. Nath, P. De and K. Roy, Chemosphere. 287, 131954 (2022). doi:10.1016/j.chemosphere.2021.131954
- P. De, D. Bhattacharyya and K. Roy, Struct. Chem. 31 (3), 1043–1055 (2020). doi:10.1007/s11224-019-01481-z
- P. De, S. Bhayye, V. Kumar and K. Roy, J. Biomol. Struct. 40 (3), 1010–1036 (2022). doi:10.1080/07391102.2020.1821779
- P. De and K. Roy, Struct. Hem. 32 (2), 631–642 (2021). doi:10.1007/s11224-021-01734-w
- P. De and K. Roy, Theor. Chem. Acc. 139, 176 (2020). doi:10.1007/s00214-020-02687-9
- A. Golbraikh and A. Tropsha, J. Mol. Graph. Model. 20, 269–276 (2002). doi:10.1016/S1093-3263(01)00123-1
- V.P. Gupta, Principles and Applications of Quantum Chemistry (Elsevier, Amsterdam, 2016).
- H.J. Bohórquez, R.J. Boyd and C.F. Matta, J. Phys. Chem. A. 115, 12991–12997 (2011). doi:10.1021/jp204100z
- R.F.W. Bader, Atoms in Molecules: A Quantum Theory (Clarendon Press, Oxford, 1990).
- R.F.W. Bader, Acc. Chem. Res. 18, 9–15 (1985). doi:10.1021/ar00109a003
- R.F.W. Bader, Chem. Rev. 91, 893–928 (1991). doi:10.1021/cr00005a013
- P.S. Magee, ACS Symp. Ser. Am. Chem. Soc. 37–56 (1989). Chapter 3. doi:10.1021/bk-1989-0413.ch003
- A.S. Christensen, T. Kubar, Q. Cui and M. Elstner, Chem. Rev. 116, 5301–5337 (2016). doi:10.1021/acs.chemrev.5b00584
- P. Geerlings, F. De Proft and W. Langenaeker, Chem. Rev. 103, 1793–1873 (2003). doi:10.1021/cr990029p
- M. Karelson, S. Sild and U. Maran, Mol. Simul. 24, 229–242 (2000). doi:10.1080/08927020008022373
- R.G. Parr and W. Yang, Annu. Rev. Phys. Chem. 46, 701–728 (1995). doi:10.1146/annurev.pc.46.100195.003413
- A. Cartier and J.-L. Rivail, Chemom. Intell. Lab. Syst. 1, 335–347 (1987). doi:10.1016/0169-7439(87)80039-4
- J.N. Murrell, S.F.A. Kettle and J.M. Tedder, The Chemical Bond, 2nd ed. (John Wiley & Sons, Chichester, 1985).
- R. Franke, Theoretical Drug Design Methods (Elsevier, New York, 1984), 115–123.
- K. Osmialowski, J. Halkiewicz, A. Radecki and R. Kaliszan, J. Chromatogr. A. 346, 53–60 (1985). doi:10.1016/S0021-9673(00)90493-X
- K. Fukui, Theory of Orientation and Stereos Election (Springer- Verlag, Berlin, 1975).
- R.E. Brown and A.M. Simas, Theoret. Chim. Acta. 62, 1–16 (1982). doi:10.1007/BF00551049
- D.F.V. Lewis, J. Comput. Chem. 8, 1084–1089 (1987). doi:10.1002/jcc.540080803
- D.F.V. Lewis, C. Ioannides and D.V. Parke, Xenobiotica. 24, 401–408 (1994). doi:10.3109/00498259409043243
- A. Cammarata, J. Med. Chem. 12, 314–317 (1969). doi:10.1021/jm00302a027
- A. Leo, C. Hansch and C. Church, J. Med. Chem. 12, 766–771 (1969). doi:10.1021/jm00305a010
- C. Hansch and E. Coats, J. Pharm. Sci. 59, 731–743 (1970). doi:10.1002/jps.2600590602
- N. Bodor, Z. Gabanyi and C.K. Wong, J. Am. Chem. Soc. 111, 3783–3786 (1989). doi:10.1021/ja00193a003
- L. Buydens, D.L. Massart and P. Geerlings, Anal. Chim. Acta. 174, 237–244 (1985). doi:10.1016/S0003-2670(00)84382-2
- O. Kikuchi, Mol. Inform. 6, 179–184 (1987).
- H. Sklenar and J. Jager, Int. J. Quantum Chem. 16, 467–484 (1979). doi:10.1002/qua.560160306
- C. Gruber and V. BuB, Chemosphere. 19, 1595–1609 (1989). doi:10.1016/0045-6535(89)90503-1
- E. Eroglu, S. Palaz, O. Oltulu, H. Turkmen and C. Ozaydin, Int. J. Mol. Sci. 8, 1265–1283 (2007). doi:10.3390/ijms8121265
- F. Saura-Calixto, A. Garcia-Raso and M.A. Raso, J. Chromatogr. Sci. 22, 22–26 (1984). doi:10.1093/chromsci/22.1.22
- C.F. Matta, J. Comput. Chem. 35, 1165–1198 (2014). doi:10.1002/jcc.23608
- W. Kohn, Rev. Mod. Phys. 71, 1253–1266 (1999). doi:10.1103/RevModPhys.71.1253
- R.G. Parr, R.A. Donnelly, M. Levy and W.E. Palke, J. Chem. Phys. 68, 3801–3807 (1978). doi:10.1063/1.436185
- R.P. Iczkowski and J.L. Margrave, J. Am. Chem. Soc. 83, 3547–3551 (1961). doi:10.1021/ja01478a001
- R.S. Mulliken, J. Chem. Phys. 2, 782–793 (1934). doi:10.1063/1.1749394
- R.G. Parr and W. Yang, Density Functional Theory of Atoms and Molecules (Oxford University Press, New York, 1989).
- P. Geerlings, E. Chamorro, P.K. Chattaraj, F. De Proft, J.L. Gázquez, S. Liu and P. Ayers, Theoret. Chem. Acc. 139, 36 (2020). doi:10.1007/s00214-020-2546-7
- S. Liu, Conceptual Density Functional Theory: Towards a New Chemical Reactivity Theory (John Wiley & Sons, Hoboken, New Jersey, 2022).
- R.G. Parr and R.G. Pearson, J. Am. Chem. Soc. 105, 7512–7516 (1983). doi:10.1021/ja00364a005
- R.G. Pearson, Chemical Hardness: Applications from Molecules to Solids (Wiley- VCH, Weinheim, 1999).
- R.F. Nalewajski, J. Phys. Chem. 89, 2831–2837 (1985). doi:10.1021/j100259a025
- R.G. Parr, R.A. Donnelly, M. Levy and W.E. Palke, J. Chem. Phy. 68, 3801–3807 (1978). doi:10.1063/1.436185
- R.G. Parr, L.V. Szentpaly and S. Liu, J. Am. Chem. Soc. 121, 1922–1924 (1999). doi:10.1021/ja983494x
- P.K. Chattaraj, U. Sarkar and D.R. Roy, Chem. Rev. 106, 2065–2091 (2006). doi:10.1021/cr040109f
- P.K. Chattaraj and D.R. Roy, Chem, Rev. 107, PR46–PR74 (2007). doi:10.1021/cr078014b
- P.K. Chattaraj, S. Giri and S. Duley, Chem. Rev. 111, PR43–PR75 (2011). doi:10.1021/cr100149p
- R.G. Parr and W. Yang, J. Am. Chem. Soc. 106, 4049–4050 (1984). doi:10.1021/ja00326a036
- W. Yang and W.J. Mortier, J. Am. Chem. Soc. 108, 5708–5711 (1986). doi:10.1021/ja00279a008
- M. Berkowitz and R.G. Parr, J. Chem. Phys. 88, 2554–2557 (1988). doi:10.1063/1.454034
- S.K. Ghosh and M. Berkowitz, J. Chem. Phys. 83, 2976–2983 (1985). doi:10.1063/1.449846
- D.R. Roy, R. Parthasarathi, J. Padmanabhan, U. Sarkar, V. Subramanian and P.K. Chattaraj, J. Phys. Chem. A. 110, 1084–1093 (2006). doi:10.1021/jp053641v
- R.S. Mulliken, Phys. Rev. 74, 736–738 (1948). doi:10.1103/PhysRev.74.736
- R.S. Mulliken, J. Chem. Phys. 3, 573–585 (1935). doi:10.1063/1.1749731
- C. Rong, T. Lu, P.W. Ayers, P.K. Chattaraj and S. Liu, Phys. Chem. Chem. Phys. 17, 4977–4988 (2015). doi:10.1039/C4CP05609D
- C. Rong, B. Wang, D. Zhao and S. Liu, Wiley Interdiscip. Rev. Comput. Mol. Sci. 10, 1461 (2020). doi:10.1002/wcms.1461
- J. Wu, D. Yu, S. Liu, C. Rong, A. Zhong, P.K. Chattaraj and S. Liu, J. Phys. Chem. A. 123, 6751–6760 (2019). doi:10.1021/acs.jpca.9b05054
- C.E. Shannon, Bell Syst. Tech. J. 27, 379–423 (1948). doi:10.1002/j.1538-7305.1948.tb01338.x
- R.A. Fisher, in Mathematical Proceedings of the Cambridge Philosophical Society, 22 (Cambridge University Press, Mexico, 1925). pp. 700–725.
- S.K. Ghosh, M. Berkowitz and R.G. Parr, Proc. Natl. Acad. Sci. 81, 8028–8031 (1984). doi:10.1073/pnas.81.24.8028
- X.Y. Zhou, C. Rong, T. Lu, P. Zhou and S. Liu, J. Phys. Chem. A. 120, 3634–3642 (2016). doi:10.1021/acs.jpca.6b01197
- C. Rong, T. Lu, P.K. Chattaraj and S. Liu. On the relationship among Ghosh-Berkowitz-Parr entropy, Shannon entropy, and Fisher information (2014).
- S.B. Liu, C.Y. Rong, Z.M. Wu and T. Lu, Acta Phys.-Chim. Sin. 31, 2057–2063 (2015). doi:10.3866/PKU.WHXB201509183
- A. Renyi, Probability Theory (North-Holland Publ. Co., Amsterdam, 1970).
- C. Tsallis, J. Stat. Phys. 52, 479–487 (1988). doi:10.1007/BF01016429
- O. Onicescu, C. R. Acad. Sci. Paris A. 263841–263842 (1966). https://cir.nii.ac.jp/crid/1570572700385906048
- J. Merlin, P.W. Ayers and J.V. Ortiz, J. Chem. Sci. 117, 387–400 (2005). doi:10.1007/BF02708342
- S. Liu and R.G. Parr, J. Chem. Phys. 106, 5578–5586 (1997). doi:10.1063/1.473580
- H.A. Ezzat, M.A. Hegazy, R. Ghoneim, H.Y. Zahran, I.S. Yahia, H. Elhaes, A. Refaat and M.A. Ibrahim, Sci. Rep. 13, 1 (2023). doi:10.1038/s41598-022-26890-9
- H. Hazhazi, N. Melkemi, T. Salah and M. Bouachrine, Heliyon. 5, 2405–8440 (2019). doi:10.1016/j.heliyon.2019.e02451
- C. Ramírez-Martínez, L.A. Zárate-Hernández, R.L. Camacho-Mendoza, S. González-Montiel, A. Meneses-Viveros and J. Cruz-Borbolla, Comput. Theor. Chem. 1226, 114211 (2023). doi:10.1016/j.comptc.2023.114211.
- S.K. Rajak, Indian J. Chem. Technol. 28, 467–472 (2022). http://op.niscpr.res.in/index.php/IJCT/article/view/45332
- A. Poddar, R. Pal, C. Rong and P.K. Chattaraj, J. Math. Chem. 61, 1143–1164 (2023). doi:10.1007/s10910-023-01457-9
- U.J. Rangel-Peña, L.A. Zárate-Hernández, R.L. Camacho-Mendoza, C.Z. Gómez-Castro, S. González-Montiel, M. Pescador-Rojas, A. Meneses-Viveros and J. Cruz-Borbolla, J. Mol. Model. 29, 217 (2023). doi:10.1007/s00894-023-05630-4
- R. Bhattacharjee, K. Verma, M. Zhang and T. Li, Theor. Chem. Acc. 138, 1–14 (2019). doi:10.1007/s00214-019-2508-0
- N. Flores-Holguín, J. Frau and D. Glossman-Mitnik, Molecules. 24, 2707 (2019). doi:10.3390/molecules24152707
- D. Zhao, X. He, M. Li, B. Wang, C. Guo, C. Rong, P.K. Chattaraj and S. Liu, Phys. Chem. Chem. Phys. 23, 24118–24124 (2021). doi:10.1039/D1CP02516C
- R. Jha, S.G. Patra, H. Mondal and P.K. Chattaraj, J. Math. Chem. 61, 825–1841 (2023). doi:10.1007/s10910-023-01492-6
- N. Flores-Holguin, J. Frau and D. Glossman-Mitnik, in Challenges and Advances in Chemical Science, 2 (Sarang, District-Dhenkanal, Odisha, India., 2021), pp. 30–44.
- N. Flores-Holguín, J. Frau and D. Glossman-Mitnik, ACS Omega. 4, 12555–12560 (2019). doi:10.1021/acsomega.9b01463
- R. Pal, G. Jana, S. Sural and P.K. Chattaraj, Chem. Biol. Drug Des. 93, 1083–1095 (2019). doi:10.1111/cbdd.13428
- I.B. Grillo, G.A. Urquiza-Carvalho, E.J.F. Chaves and G.B. Rocah, J. Comput. Chem. 41, 862–873 (2020). doi:10.1002/jcc.26148
- I.B. Grillo, G.A. Urquiza-Carvalho, J.F.R. Bachega and G.B. Rocha, J. Chem. Inform. Model. 60, 578–591 (2020). doi:10.1021/acs.jcim.9b00860
- J. Oller, D.A. Saez and E. Vohringer-Martinez, J. Phys. Chem. A. 124, 849–857 (2020). doi:10.1021/acs.jpca.9b07012
- N. Flores-Holguín, J. Frau and D. Glossman-Mitnik, ChemistryOpen. 10, 1142–1149 (2021). doi:10.1002/open.202100178
- N. Flores-Holguín, J. Ortega-Castro and J. Frau, Mar. Drugs. 20, 97 (2022). doi:10.3390/md20020097
- N. Flores-Holguín, J. Frau and D. Glossman-Mitnik, Pharmaceuticals. 15, 509 (2022). doi:10.3390/ph15050509
- T. Ziegler, Chem. Rev. 91, 651–667 (1991). doi:10.1021/cr00005a001
- E.B.A. Filho, J.W.C. Silva and S.C.H. Cavalcanti, Med. Chem. Res. 25, 2171–2178 (2016). doi:10.1007/s00044-016-1650-7
- S. Slavov and R.D. Beger, Curr. Opin. Toxicol. 23-24, 46–49 (2020). doi:10.1016/j.cotox.2020.04.002
- X. Yu, Aqua. Toxicol. 224, 105496 (2020). doi:10.1016/j.aquatox.2020.105496
- S.A.K. Kirmani, P. Ali and F. Azam, Int. J. Quantum Chem. 121, e26594 (2021). doi:10.1002/qua.26594
- V.V. Kleandrova, L. Scotti, F.J.B. Mendonca, Jr., E. Muratov, M.T. Scotti and A. Speck-Planche, Front. Chem. 9, 634663 (2021). doi:10.3389/fchem.2021.634663
- J. Padmanabhan, R. Parthasarathi, V. Subramanian and P.K. Chattaraj, Bioorg. Med. Chem. 14 (4), 1021–1028 (2006). doi:10.1016/j.bmc.2005.09.017
- R. Parthasarathi, V. Subramanian, D.R. Roy and P.K. Chattaraj, Bioorg. Med. Chem. 12, 5533–5543 (2004). doi:10.1016/j.bmc.2004.08.013
- P. Thanikaivelan, V. Subramanian, J.R. Rao and B.U. Nair, Chem. Phys. Lett. 323, 59–70 (2000). doi:10.1016/S0009-2614(00)00488-7
- D.R. Roy, R. Parthasarathi, B. Maiti, V. Subramanian and P.K. Chattaraj, Bioorg. Med. Chem. 13, 3405–3412 (2005). doi:10.1016/j.bmc.2005.03.011
- P.P. Singh, H.K. Srivastava and F.A. Pasha, Bioorg. Med. Chem. 12, 171–177 (2004). doi:10.1016/j.bmc.2003.11.002
- U. Sarkar, D.R. Roy, P.K. Chattaraj, R. Parthasarathi, J. Padmanabhan and V. Subramanian, J. Chem. Sci. 117, 599–612 (2005). doi:10.1007/BF02708367
- D.R. Roy, U. Sarkar and P.K. Chattaraj, Mol. Divers. 10, 119–131 (2006). doi:10.1007/s11030-005-9009-x
- A. Chakraborty, S. Pan and P.K. Chattaraj, in Applications of Density Functional Theory in Biological and Bio-inorganic Chemistry, edited by M.V. Putz, M.P. Mingos (Springer, Berlin/Heidelberg, 2013), p. 150.
- C.A. Coulson, Roy. Soc. London Proc. 207, 63–73 (1951). doi:10.1098/rspa.1951.0099
- K. Fukui, Science. 218, 747–754 (1982). doi:10.1126/science.218.4574.747
- L.C. Allen and E.T. Knight, J. Mol. Struct. Theochem. 261, 313–330 (1992). doi:10.1016/0166-1280(92)87083-C
- L.R. Murphy, T.L. Meek, A.L. Allred and L.C. Allen, J. Phys. Chem. A. 104, 5867–5871 (2000). doi:10.1021/jp000288e
- R.T. Sanderson, J. Chem. Educ. 65, 227–231 (1988). doi:10.1021/ed065p227
- R.P. Iczkowski and J.L. Margrave, J. Am. Chem. Soc. 83, 3547–3355 (1961). doi:10.1021/ja01478a001
- L.C. Allen, J. Am. Chem. Soc. 114, 1510–1511 (1992). doi:10.1021/ja00030a073
- R.G. Pearson, J. Org. Chem. 56, 1423–1430 (1989). doi:10.1021/jo00267a034
- R.T. Sanderson, J. Chem. Edu. 36, 507 (1959). doi:10.1021/ed036p507
- R.T. Sanderson, J. Chem. Edu. 31, 2–17 (1954). doi:10.1021/ed031p2
- R.T. Sanderson, Science. 121, 207–208 (1955). doi:10.1126/science.121.3137.207
- R.T. Sanderson, J. Chem. Educ. 65, 112–118 (1988). doi:10.1021/ed065p112
- R.G. Parr and L.J. Bartolotti, J. Am. Chem. Soc. 104, 3801–3803 (1982). doi:10.1021/ja00378a004
- L.V. Szentpaly, J. Comp. Chem. 39, 1949–1969 (2018). doi:10.1002/jcc.25356
- V. Kumari, T. Singh, S. Devi, H. Tandon, M. Labarca and T. Chakraborty, J. Math. Chem. 60, 360–372 (2022). doi:10.1007/s10910-021-01306-7
- Z. Sun, L. Chai, M. Liu, Y. Shu, Q. Li, Y. Wang and D. Qiu, Chemosphere. 195, 282–290 (2018). doi:10.1016/j.chemosphere.2017.12.031
- M. Rahm, T. Zeng and R. Hoffmann, J. Am. Chem. Soc. 141, 342–351 (2019). doi:10.1021/jacs.8b10246
- A. Campero and J.A.D. Ponce, ACS Omega. 5, 25520–25542 (2020). doi:10.1021/acsomega.0c00256
- G.D. Sproul, ACS Omega. 5, 11585–11594 (2020). doi:10.1021/acsomega.0c00831
- H. Tandon, M. Labarca and T. Chakraborty, Chemistry Select. 6, 5622–5627 (2021). doi:10.1002/slct.202101142
- D.K. Saloni, H. Tandon, M. Labarca, and T. Chakraborty, J. Math. Chem. 60, 1505–1520 (2022). doi:10.1007/s10910-022-01376-1
- R.G. Parr, L.V. Szentpály and S. Liu, J. Am. Chem. Soc. 121, 1922–1924 (1999). doi:10.1021/ja983494x
- R. Parthasarathi, J. Padmanabhan, M. Elango, V. Subramanian and P.K. Chattaraj, Chem. Phys. Lett. 394, 225–230 (2004). doi:10.1016/j.cplett.2004.07.002
- M.V. Putz and P.K. Chattaraj, Int. J. Quantum Chem. 113, 2163–2171 (2013). doi:10.1002/qua.24473
- P.K. Chattaraj, A. Chakraborty and S. Giri, J. Phys. Chem. A. 113, 10068–10074 (2009). doi:10.1021/jp904674x
- D.R. Roy, S. Giri and P.K. Chattaraj, Mol. Divers. 13, 551–556 (2009). doi:10.1007/s11030-009-9133-0
- P.K. Chattaraj, D.R. Roy, S. Giri, S. Mukherjee, V. Subramanian, R. Parthasarathi, P. Bultinck and S.V. Damme, J. Chem. Sci. 119, 475–488 (2007). doi:10.1007/s12039-007-0061-1
- D.R. Roy, U. Sarkar, P.K. Chattaraj, A. Mitra, J. Padmanabhan, R. Parthasarathi, V. Subramanian, S.V. Damme and P. Bultinck, Mol. Divers. 10, 119–131 (2006). doi:10.1007/s11030-005-9009-x
- J. Padmanabhan, R. Parthasarathi, V. Subramanian and P.K. Chattaraj, J. Phys. Chem. A. 110, 9900–9907 (2006). doi:10.1021/jp061436p
- J. Padmanabhan, R. Parthasarathi, V. Subramanian and P.K. Chattaraj, Chem. Res. Toxicol. 19, 356–364 (2006). doi:10.1021/tx050322m
- R. Pal and P.K. Chattaraj, J. Comput. Chem. 44, 278–297 (2023). doi:10.1002/jcc.26886
- N. Santschi and T. Nauser, Chem.Phys. Chem. 18, 2973–2976 (2017). doi:10.1002/cphc.201700766
- A.R. Jupp, T.C. Johnstone and D.W. Stephan, Dalton. Trans. 47, 7029–7035 (2018). doi:10.1039/C8DT01699B
- H. Tandon, T. Chakraborty and V. Suhag, J. Struct. Chem. 60, 1725–1734 (2019). doi:10.1134/S0022476619110040
- H. Tandon, T. Chakraborty and V. Suhag, J. Math. Chem. 58, 2188–2196 (2020). doi:10.1007/s10910-020-01176-5
- L.V. Szentpaly, S. Kaya and N. Karakus, J. Phys. Chem. A. 124, 10897–10908 (2020). doi:10.1021/acs.jpca.0c08196
- Z. Wei, W. Li, D. Zhao, Y. Seo, R. Spinney, D.D. Dionysiou, Y. Wang, W. Zeng and R. Xiao, Water Res. 160, 10–17 (2019). doi:10.1016/j.watres.2019.05.057
- R. Pal and P.K. Chattaraj, in Big Data Analytics in Chemoinformatics and Bioinformatics (Elsevier, Amsterdam, 2023). pp. 219–229.
- D.K. Saloni, H. Tandon, M. Labarca, and T. Chakraborty, Struct. Chem. 33, 2195–2204 (2022). doi:10.1007/s11224-022-02048-1
- P. Ranjan and T. Chakraborty, Theor. Chem. Acc. 143, 7 (2024). doi:10.1007/s00214-023-03082-w
- P. Ranjan, K. Gaurav and T. Chakraborty, Quant. Biol. 10, 341–350 (2022). doi:10.15302/J-QB-022-0287
- J.J. Li, Y.X. Yue, S.J. Shi and J.Z. Xue, Chemosphere. 341, 139916 (2023). doi:10.1016/j.chemosphere.2023.139916
- M. Na, S.H. Nam, K. Moon and J. Kim, Environ. Sci.: Nano. 10, 325–337 (2023). doi:10.1039/D2EN00672C