
 ?Mathematical formulae have been encoded as MathML and are displayed in this HTML version using MathJax in order to improve their display. Uncheck the box to turn MathJax off. This feature requires Javascript. Click on a formula to zoom.
Abstract
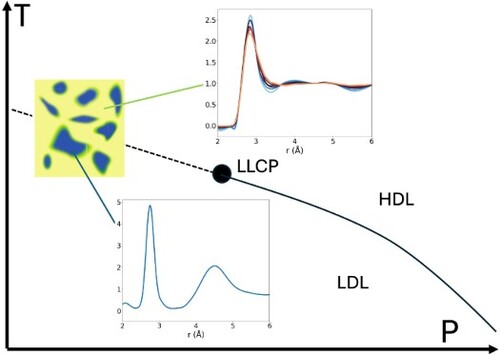
An increasing number of studies support the existence of a liquid–liquid critical point (LLCP) in water, implying that under ambient conditions, water is a supercritical mixture of low-density (LDL) and high-density liquid (HDL) structures. Here, we analyse X-ray scattering data in terms of this model. Small-angle X-ray scattering data shows that anomalies are seen at temperatures as high as 360 K. By assuming the local structure in LDL-domains resembles that of the corresponding amorphous solid, we estimate the population of LDL-domains at different temperatures from pair-correlation functions (PCFs). By subtracting the LDL contribution, we isolate the PCF of the HDL component. The temperature-dependent HDL-PCFs show a feature around 4 Å in the supercooled regime, interpreted as interstitials resulting from collapse of the second coordination shell. We define the first coordination shell as neighbours up to 3.3 Å, based on an isosbestic point in the running coordination number. Our analysis shows that the HDL-domains have on average two strongly and two weakly H-bonded neighbours. The LDL population in TIP4P/2005-water is less temperature dependent than in real water, and the HDL component contains more structures with three strongly H-bonded neighbours, leading to a slight overestimation of the first peak of the PCF.
GRAPHICAL ABSTRACT
Introduction
Water is one of the most anomalous liquids at conditions where essential physical, chemical, biological and geological processes occur in nature [Citation1]. It is a key component of life and major efforts have been made to understand its peculiar properties [Citation1–8]. In particular, water exhibits unique anomalous behaviour in terms of the compressibility (ĸT) [Citation5], specific heat capacity (Cp) [Citation9], thermal expansion coefficient (αP) and correlation length (ξ) [Citation10] upon cooling water from 320 K at 1 bar to colder temperatures. These properties (often referred to as the thermodynamic response functions) appear already at ambient temperatures but become enhanced in the supercooled regime. They appear to diverge toward a singular temperature (Ts) estimated by power-law fits of about 228 K at 1 bar [Citation5,Citation11]. This has led to several hypotheses about the origin of water anomalous properties [Citation12–14]. The source of these anomalies lies in the intermolecular structure and dynamics of water, the nature of the H-bonding network and its collective fluctuations [Citation15–19].
Recent simulations and experiments have given support for the liquid–liquid critical point (LLCP) hypothesis [Citation20–29]. The LLCP model states that water, at supercooled temperatures and elevated pressures, can exist as two phases: a high-density liquid (HDL) and a low-density liquid (LDL) [Citation16]. In the Temperature–Pressure phase diagram of supercooled water, these two phases are metastable with respect to crystalline ice at high pressure and separated by a phase coexistence line. Recently, the phase transition between these two phases was experimentally demonstrated [Citation25]. The phase transition line is expected to terminate in the LLCP at some positive pressure.
At higher temperatures and lower pressures, water exists as a supercritical mixture of the different local structures, transiently interconverting without energetic barriers. The extension of the phase coexistence line beyond the LLCP towards lower pressures is denoted the Widom line [Citation30] where the thermodynamic response functions increase sharply and reach a maximum. Recently, maxima in the temperature-dependent ĸT, Cp, ξ and the temperature derivative of the first peak position of the structure factor have been found, consistent with the Widom line concept and the existence of a LLCP [Citation24,Citation26]. The fluctuations in water between various local structures mimicking the two water liquid phases are strongest at the Widom line and diminish at higher temperatures. As indicated by the temperature dependence of the anomalous contribution to ĸT (vide infra), these fluctuations extend all the way to 360 K at 1 bar [Citation31]. The minimum in the temperature dependence of ĸT at 319 K is due to the cancellation of the contributions from the decreasing normal thermal fluctuations and the increasing anomalous structural fluctuations upon cooling. In this work, we aim to describe the temperature-dependent local structure and population of the fluctuating components giving rise to the anomalous contributions to the thermodynamic response functions based on experimental data.
We can assume that the respective HDL and LDL phases are liquid analogues to the high-density amorphous (HDA) and low-density amorphous (LDA) glass states, which have certain characteristics in the O–O pair-correlation functions (PCF) as determined from x-ray scattering experiments [Citation32]. The first shell appears between 2.75 and 2.80 Å for both glasses. However, the main difference is in the second shell that has a well-defined correlation at 4.5 Å for LDA that diminishes and shifts to 4.2 Å simultaneous with the appearance of an interstitial shell at 3.6 Å in HDA [Citation32]. LDA corresponds to a tetrahedral structure, similar to what is seen locally in hexagonal ice. There is continuous change in the second shell of the high-density glass with increasing pressure towards an endpoint where crystallisation occurs to 3.4 Å [Citation33] with complete extinction of the 4.5 Å correlation [Citation32,Citation33]. Efforts have been made to derive O–O PCFs of the corresponding HDL and LDL structures by fitting pressure-dependent trends in neutron scattering experiments at 368 K in terms of linear combination of local structures [Citation34]. The PCF of the LDL phase is similar to LDA whereas the HDL shows more resemblance to VHDA with a correlation at 3.4 Å and none at 4.5 Å. The shift to 3.4 Å and almost complete extinction of the 4.5 Å correlation is also seen in the O–O PCFs obtained from x-ray scattering experiments at 293 K for pressures above 5 kbar [Citation35]. Most likely, the derived pure HDL from neutron scattering experiments represents the liquid at very high pressures where there is continuous change in structure with density. This one-phase behaviour is analogous with what is seen in amorphous ice phases with a continuous shift in the structure from VHDA to HDA [Citation33]. Therefore, the HDL phase close to the LLT coexistence line should more resemble HDA than the HDL structure derived from trends in neutron scattering experiments. Indeed, in the rapid isochoric heating of HDA to HDL, the position of the first peak of the structure factor stays constant. Since the first peak is strongly correlated with the distance of the second shell [Citation23], the PCFs of HDL close to the binodal should be more related to HDA than to the neutron scattering derived HDL with correlations at 3.6 and 4.2 Å. This leads to the important question: What is the dominating structure of water at 1 bar, often denoted as HDL, existing far from a liquid–liquid coexistence line?
The local structure of LDL should closely resemble LDA with the 4.5 Å correlation of the second shell, given tetrahedral symmetry. However, the long-range structure could be quite different. Local structures related to LDL in the fluctuating liquid at 1 bar show correlations of the fifth shell [Citation36,Citation37] at 11 Å in comparison to hexagonal ice with its shell at 12 Å [Citation37]. The difference has been attributed to clathrate structures consisting of five-member rings in the LDL local structure whereas crystalline hexagonal ice consists of six-member rings [Citation37]. The fifth shell in LDA, on the other hand, shows a broad correlation encompassing both 11 and 12 Å pointing to the existence of both five- and six-member rings [Citation32,Citation37].
The local coordination of all the glassy states (LDA, HDA and VHDA) around the first shell (below 3 Å) is fourfold based on x-ray scattering data [Citation32] and is thereby independent of the second shell. In liquid water at 1 bar, the number of molecules within a radius of 3.3 Å has shown to be independent of temperatures and is close to fourfold [Citation37,Citation38]. If the LDL related local structure is fourfold, then this constant coordination would imply that the HDL is distorted already around the first shell and does not only differ from LDL in the second shell.
In the following, we will address the local structure of the LDL and HDL fluctuating components in terms of the first two coordination shells by analysing existing Small-Angle X-ray Scattering (SAXS) and Wide-Angle X-ray Scattering (WAXS) for water at 1 bar over large range of temperatures. In particular, we will describe how we connect the derived and dissected PCFs with the appearance of the anomalies allowing us to test various hypothesis and build a consistent picture with several experimental observations.
SAXS and anomalies
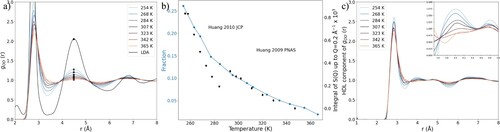
To derive the contribution of LDL in the fluctuating network of supercritical water, we first test the hypothesis that these form local collective structures mostly governed by cooperativity effects of similarly H-bonded molecules. If there is a density inhomogeneity in the liquid on a length scale beyond the nearest neighbour distance, there should be an enhancement at low momentum transfer (q) as observed in SAXS of water [Citation10,Citation24,Citation39,Citation40]. However, a normal, completely homogeneous liquid, such as ethanol, shows a different SAXS temperature dependence. For ethanol, the SAXS intensity is flat in the low q region and as the temperatures lower there is only a relative shift with a constant curve shape [Citation41]. The structure factor at q = 0 is related to κT via the relationship S(0) = kBTnκT, where kB is the Boltzmann constant, T is the absolute temperature and n is the molecular number density [Citation42]. Since ethanol is a normal liquid in which that κT decreases with decreasing temperature, the SAXS intensity decreases when the temperature is lowered. Water behaves as a normal liquid at hot temperatures, and we can use the SAXS curve at 347 K as an appropriate model for the expected normal behaviour at lower temperatures. Figure (a) shows the SAXS curves between 227 and 347 K with a relative shift to coincide with the 347 K curve at q-values well above the minimum at 0.7 Å−1. We observe that all the curves above at 0.7 Å−1 fall onto a single curve. However, below at 0.7 Å−1 there is a clear enhancement growing towards lower q indicating an anomalous behaviour related to inhomogeneities in the liquid. Figure (b) shows when the 347 K curve has been subtracted from all the other SAXS curves directly demonstrating the increasing structural fluctuations on longer length scales. Figure (c) shows the integrated SAXS enhancement as a function of temperatures from three different independent measurements [Citation10,Citation24,Citation39] (with some small discrepancies between the measurements) and the dots are taken from Angell’s original estimation [Citation31] of the anomalous contribution of κT and we demonstrate a nice correlation. The insert shows that the SAXS enhancement already starts at the rather high temperature of around 360 K well above the minimum in κT. We thereby establish that the anomalous behaviour in water is correlated with the SAXS enhancement.
Figure 1. (a) SAXS curves from Refs [Citation10,Citation24] and [Citation39] vertically shifted to match at high q-values, (b) SAXS curves with the highest temperature curve (347 K) subtracted, (c) SAXS enhancement obtained by integrating the SAXS intensity (black symbols, from [Citation10,Citation24] and [Citation39] respectively) and anomalous contribution to compressibility as estimated by Angell et al. (red circles, [Citation31]).
![Figure 1. (a) SAXS curves from Refs [Citation10,Citation24] and [Citation39] vertically shifted to match at high q-values, (b) SAXS curves with the highest temperature curve (347 K) subtracted, (c) SAXS enhancement obtained by integrating the SAXS intensity (black symbols, from [Citation10,Citation24] and [Citation39] respectively) and anomalous contribution to compressibility as estimated by Angell et al. (red circles, [Citation31]).](/cms/asset/eea54b15-a913-4230-8c4a-ec165604fdbd/tmph_a_2380352_f0001_oc.jpg)
The SAXS enhancement is small in comparison to what is expected for critical phenomena as the scattering experiments were conducted at 1 bar, further indicating that the LLCP is located at pressures well above ambient conditions. Clark et al. have criticised the interpretation of local structures from the small SAXS enhancement [Citation43] but their measurement showed an inconsistency with the temperature-dependent slope in the small-q region. The strength of the interpretation presented here is that the SAXS enhancement is directly coupled to the anomalous contribution to the temperature-dependent rise of the isothermal compressibility as shown in Figure (c).
The density fluctuations in water causing the anomalous temperature dependence of κT can be understood as transient formation of LDL patches with tetrahedral ordering of varying volume. Below, we estimate the size of these patches.
From SAXS data, we can calculate the correlation length , which gives information about the instantaneous size of such fluctuating domains [Citation10,Citation39]. The correlation length increases rapidly as the temperature decreases and reaches a maximum of around 4 Å at 229 K [Citation24,Citation44]. The correlation length is a parameter in the decaying correlation function and is not characteristic of the size of LDL patches in the liquid. However, to gain a physical intuition of the size of transient patches in the liquid, a radius of gyration (
) can be estimated with Guinier analysis (originally developed for static macroparticle scattering), with
[Citation39,Citation45]. The radius of gyration can then be related, assuming a spherical patch, to an average diameter
[Citation39]. This analysis indicates that average LDL patches grow from approximately ∼9 Å in diameter at room temperature to ∼18 Å at 229 K [Citation44]. The patches are of a size large enough to allow for a separation in the PCF of local LDL structural environment.
Temperature-dependent LDL population derived from PCFs
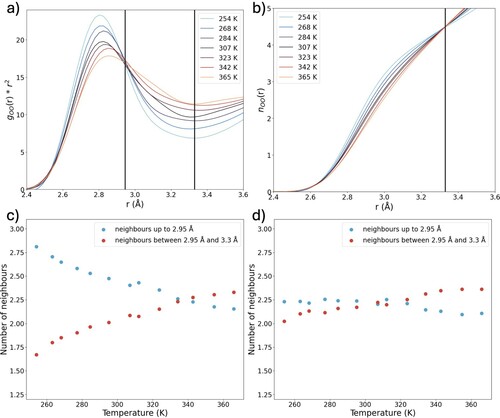
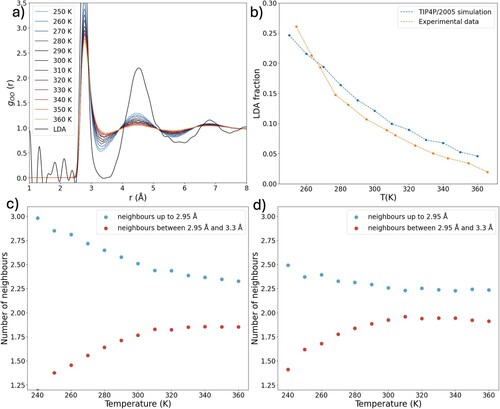
We focus on the data published by Skinner et al. [Citation38], as this dataset spans the largest temperature range out of those published and is capturing a long Q range [Citation37,Citation38,Citation46]. The same analysis has been conducted with other datasets and is shown in the supporting information [Citation37,Citation46]. In the LDA form of water at 80 K, the PCF shows a strong correlation at 4.5 Å, corresponding to the distance to the next nearest neighbour in a tetrahedral configuration of water molecules, shown in Figure (a). Computational analysis based on the local structure index [Citation40,Citation47], Soper’s characterisation of HDL [Citation34] and comparison with HDA [Citation32] all indicate that this correlation is not present in HDL. The absence of a correlation at 4.5 Å could in fact be taken as one of the clear defining features of HDL domains. We note that our description of the LDL and HDL-like domains resembles the respective states introduced in the model formulated by Tanaka et al. [Citation17,Citation48] which describes the liquid in terms of locally favoured structures and normal structures.
Figure 2. (a) PCFs of water at different temperatures. (b) Estimated fraction of LDL as a function of temperature (blue circles). Black symbols show the integrated SAXS intensity (as shown in Figure c) for comparison. (c) PCF of water after the LDL component is subtracted. The inset highlights the changes between 3.5 and 5 Å.
With increasing temperature, the peak in the PCF gradually decreases as the fraction and size of tetrahedral (LDL) domains decrease. Building on the observation that the peak at 4.5 Å is only present in the LDL form, the fraction of LDL as a function of temperature can be estimated by interpolation as shown in Figure (b). We note that this treatment ignores interference effects, caused by correlations across LDL and non-LDL regions. However, here we discuss only correlations up to ∼4.5 Å. This is below the estimated radius of LDL domains at these temperatures. Although we expect interference effects to be non-negligible, our analysis can be expected to mainly reflect HDL local structures [Citation39]. We directly compare the LDL fraction with the SAXS enhancement as a function of temperature and these follow each other nicely (see Figure b). The correlation shows consistency with the LDL population, SAXS intensity increase and the anomalous contribution to the compressibility as estimated by Angell [Citation31].
Temperature dependence of the HDL structure – second coordination shell
Figure (c) shows the PCF of water after the LDL component is subtracted. At high temperatures, there is no strong correlation beyond the distance to the nearest neighbour at 2.95 Å, after which the PCF approaches 1. This is expected, as at these temperatures, thermal excitations lead to population of a large variety of structures, randomising the distribution. This relates well concept of normal liquid structures as discussed by Tanaka et al. [Citation17,Citation48]. As the temperature decreases, a peak at 4 Å becomes apparent. This feature can be explained in two ways: as a compression of LDL domains as temperature increases or as a temperature-dependent feature of the HDL domains. A compression of the LDL structure with increasing temperature is difficult to rationalise physically. Increasing temperature would rather lead to increased thermal excitation of intermolecular modes and therefore an increase in average molecular distances. Furthermore, the expected decrease in the size of LDL domains would lead to a reduction in cooperativity effects, weakening the hydrogen bonds. We therefore conclude that the 4 Å is a feature of the HDL structures. The dip between 5–6 Å, which has the same temperature dependence as the feature at 4 Å, is also present in the PCF of HDA [Citation32]. This further indicates that the PCFs in Figure (c) represent HDL-related structures.
The PCF of HDA at 80 K shows a peak at 3.6 Å [Citation32]. This has been attributed to interstitial oxygen atoms arising from the second coordination shell being pushed towards the first shell. It is plausible that the feature at 4 Å in the HDL structure at higher temperatures arises from similar, more ordered interstitials, with the average distance being increased due to the lower pressure at 1 bar. In topological interpretations of the water structure (based on mainly computational results), interstitials in HDL arise as the result of highly entangled ring structures [Citation49,Citation50]. The feature at 4 Å arising at ambient pressure could be interpreted as the result of the relaxation of such structures. Further studies are necessary to fully characterise this feature. In any case, the results illustrate the temperature dependence of the HDL structure around the second shell (as approximated by subtracting LDL features).
Temperature dependence of HDL – first coordination shell
To gain further insights about the HDL structure, we investigate changes in the first coordination shell. What constitutes the first coordination shell cannot easily be identified from the PCF. More insights about the number of neighbouring atoms can be obtained by multiplying the PCF with the square of the distance.
(1)
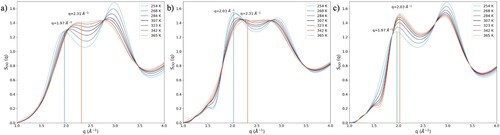
(1) This yields the radial distribution function (RDF), shown in Figure (a). Integrating over this function and multiplying by the density, the running coordination number is obtained (
, see Figure b).
(2)
(2)
This function shows the average number of oxygen atoms that can be found within a sphere with a radius r originating from a central atom. As can be seen in Figure (b), there is an isosbestic point in the running coordination number at 3.3 Å, where the average number of neighbours is 4.5. This implies that within a radius of 3.3 Å, there are on average slightly above 4 neighbouring oxygen atoms, independent of temperature. Changes in the RDF below 3.3 Å therefore show a reordering of molecules within that distance. We therefore define the first coordination shell as a sphere with radius 3.3 Å from the central atom.
Figure 3. (a) RDF (gOO(r)*r2) of water as a function of temperature. (b) Running coordination number (nOO (r)) of water as a function of temperature. (c) Average number of oxygen neighbours up to 2.95 Å and between 2.95 and 3.3 Å from a central oxygen atom. (d) Average number of neighbours up to 2.95 Å and between 2.95 and 3.3 Å for HDL structures after subtraction of the LDL component.
Although the radius of the first coordination shell appears to be constant, the distribution of neighbours within this shell seems to change as a function of temperature. There is an isosbestic point in the RDF at approximately 2.95 Å. This indicates that there are two types of neighbours within the first coordination shell: strongly hydrogen-bonded neighbours up to roughly 2.95 Å, and more weakly bonded neighbours between 2.95 and 3.3 Å. Figure (c) shows the number of neighbours up to 2.95 Å and between 3 and 3.3 Å from a central atom as a function of temperature. As the temperature increases, neighbours seem to gradually shift from strongly bonded positions to weakly bonded ones, reflecting the change seen in the RDFs in Figure (a).
Figure (d) shows the average number of neighbours up to 2.95 Å and between 2.95 and 3.3 Å in only the HDL domains (obtained from subtracting the LDL component). Each molecule has on average slightly more than two neighbours up to 2.95 Å, and the number increases only slightly with decreasing temperature. Conversely, each molecule has on average around two neighbours between 2.95 and 3.3 Å, with the number very slightly increasing with temperature. This implies that the distribution of neighbours in HDL’s first coordination shell in this temperature range is constant, with an average of two strongly (and consequently two weakly) H-bonded neighbours. One of the defining features of the LDL structure is that it has four closely bonded neighbours. The change in the number of strongly and weakly bonded neighbours with temperature therefore reflects the varying populations of LDL and HDL motifs. At room temperature for the HDL domains, there appear to be approximately two strongly and two weakly hydrogen-bonded neighbours. Interestingly, this seems to be somewhat consistent with early interpretations of the X-ray absorption spectrum of water at ambient conditions [Citation51,Citation52]. The main difference is that the present analysis indicates less O–O distance distortion for the weak hydrogen bonds, placing them in the interval 2.95–3.3 Å, rather than >3.3 Å as previously estimated.
The HDL structure could for example (speculatively) be thought of as long chains [Citation53] (or large rings as hypothesised by Wernet et al. [Citation51]) of hydrogen-bonded molecules, with each member of the chain being linked to two additional hydrogen-bonded molecules on the side. The hydrogen bonds along the chains would be stabilised due to cooperativity effects [Citation54,Citation55]. At low temperatures, we assume that all four hydrogen bonds are at the equilibrium distance. As the temperature increases, the average distances to the two ‘side-bonded’ molecules lengthen, due to thermal excitations (in a similar fashion as the interstitial molecules, discussed above). One potential hypothesis is that the highly entangled rings seen in simulations of HDL under pressure [Citation49,Citation50] relax in ambient pressure HDL motifs into disentangled rings or chains of two strong hydrogen-bonded structures with weak hydrogen bonds between them.
As mentioned above, in the LLCP model, water at ambient pressure exists as a supercritical fluctuating mixture of LDL and HDL local structures. This model implies that at atmospheric pressure, there are no free energy barriers to transformation between LDL and HDL. At pressures above and temperatures below the critical point, there should be two free energy basins corresponding to the local environments of HDL and LDL. At the phase transition line, a liquid containing a mixture of these environments should separate into these two phases.
At pressures below the critical point, however, any potential energy barrier is smaller than the thermal energy. This implies that many local structures leading to intermediate densities are also populated. A supercritical mixture in this model will contain domains resembling HDL at high pressure, LDL domains and any structure in between. It should therefore be challenging to assign a single indicative local structure to HDL domains at high temperature. The change in Figure (a) therefore reflects not only the temperature-dependent contribution of a single HDL structure but also the increasing contribution from transient ‘intermediate-density’ structures. A wide variety of local structures will be represented, which average out to having two closely and two more loosely hydrogen-bonded neighbours at room temperature. This can be seen beyond the first coordination shell. In HDA and macroscopic HDL, high-density structures can be characterised by the second coordination shell being at interstitial distances, shorter distance than tetrahedral correlations (found at 4.5 Å). For ambient water, a broad range of second shell distances is observed, resulting in a PCF which is almost flat, with a value of 1, between 3.3 and 4.5 Å (see Figure c).
The interpretation of HDL at ambient pressure as highly flexible has been inferred from other observations. It is for example consistent with the gradual shifts with temperature of X-ray emission and absorption features [Citation39], and the observation of multiple components in optical Raman spectroscopy [Citation56,Citation57]. This is very different from HDL at pressures above and temperatures below the critical point, where the local structure is more well defined. As the pressure decreases potential energy penalty for conversion to LDL decreases, and more local structures become accessible.
X-ray scattering can only give an average of these ensembles. With methods considered here, it is impossible to quantify the temperature dependence of structures that resemble HDL at high pressure (with a clear second shell interstitial distance) and the contribution of more ‘intermediate-density’ local structures. The temperature dependence of the former could only be measured at pressures above the liquid–liquid critical point, where there is a stable, more well-defined local structure associated with HDL. It would be interesting to probe different local structures individually, to see if there are underlying structural features that are more represented than others. This may be possible with X-ray spectroscopy techniques [Citation52].
The continuous structural changes with temperature, in the first coordination shell and beyond, are crucial to describing the X-ray scattering pattern. Figure shows how S(q) varies with temperature the first peak shifts from 1.97 to 2.31 Å−1 as the temperature is increased from 254 to 365 K. By taking the Fourier transform of the PCFs from which the LDL contributions have been subtracted (Figure c), the structure factor of the HDL domains can be estimated. In these, the first peak shifts from 2.03 Å−1 to 2.31 Å−1 as the temperature is raised. A linear combination of the S(q) weighed LDL fraction in Figure (b) only shows a shift from 1.97 Å−1 to 2.03 Å−1.
Figure 4. (a) S(q) of water as a function of temperature. (b) Temperature dependence of the HDL component of the structure factor. (c) Linear combination of S(q) of LDL and water at 254 K weighed by the LDL fraction in Figure (a).
This shows that the change in relative fraction of LDL and HDL domains only causes part of the shift in the first peak of S(q). The remaining shift is caused by temperature-induced structural changes in the HDL domains. As temperature increases, the S(q) of these domains gradually shifts to larger q. This reflects the gradual loss of correlations beyond the nearest neighbours. As the temperature increases, the structure of water becomes more and more random. We note that the analysis shown in Figure still ignores interference effects, the consequences of which will be explore in future work.
Comparison with TIP4P/2005
The TIP4P/2005 model is regarded as one of the most realistic water models [Citation58]. It accurately describes multiple of waters’ properties [Citation58,Citation59] and it has been shown that TIP4P/2005 water is well described by the LLCP model [Citation20]. It is known that the O–O PCF of TIP4P/2005 overstructures the first shell peak for all temperatures at 1 bar [Citation60]. We therefore seek to compare our experimental analysis with TIP4P/2005 water to gain further structural insights in the differences.
Figure (a) shows the PCFs obtained from TIP4P/2005 simulations at temperatures ranging from 240 to 360 K (calculated with the Gromacs 2021 package) [Citation61]. The peaks in the PCF appear are sharper compared to experimental data. Figure (b) shows the LDL population in TIP4P/2005 water compared to that of real water by subtracting the experimental LDA PCF in similar manner as for Figure (b). The TIP4P/2005 model seems to slightly underestimate the temperature dependence of the LDL population. Furthermore, the LDL fraction is overestimated at hot to slightly supercooled temperatures, whereas at low supercooled temperature it is underestimated when compared to experiment.
Figure 5. (a) PCFs of TIP4P/2005 water as a function of temperature at constant pressure (1 bar). (b) Estimated fraction of LDL structures in TIP4P/2005 water compared to experiment. (c) Average number of oxygen neighbours up to 2.95 Å and between 2.95 and 3.3 Å from a central oxygen atom in TIP4P/2005 water. (d) Average number of neighbours up to 2.95 Å and between 2.95 and 3.3 Å for HDL structures after subtraction of LDL component in TIP4P/2005 water.
It has been suggested that the second critical point (in TIP4P/2005 located at 172 K and 1861 bar) [Citation20] is located at higher pressure in the water model than in real water [Citation27,Citation62]. The temperature dependence of the population of LDL-like structures is thus underestimated. Furthermore, this would imply that the size of LDL-like domains is also underestimated in ambient pressure simulations of the TIP4P/2005 water model.
Figures (c and d) show the number of strongly and weakly hydrogen-bonded neighbours (defined as neighbours below 2.95 Å and between 2.95 and 3.3 Å as previously). Of particular interest is the small deviation in the balance between weak and strong bonds for the HDL component of the TIP4P/2005 model with respect to experiment. The model shows a somewhat higher contribution of strong bonds in the whole temperature interval, indicating more configurations that slightly tend more towards three strong hydrogen bonds rather than two as interpreted from the experimental data. We can understand the overshooting in the first peak of the TIP4P/2005 model as partially caused by overestimation of the population of the LDL local structures and partially caused by the HDL component having somewhat more strong hydrogen bonds.
Conclusion
In summary, we have analysed the structure of water from high to supercooled temperatures based on previously published SAXS and WAXS data. With this approach, we relate the anomalies in the thermodynamic response functions of water to transient formation of patches with LDL-like local structures. From the temperature dependence of the SAXS intensity, which is intricately related to the compressibility ĸT, we see that these fluctuations play a role already at temperatures as high as 360 K.
We have estimated the fraction of LDL from the feature at 4.5 Å in the PCF. By assuming the local structure of LDL is LDA-like and subtracting its contribution from the PCF, we isolate the temperature-dependent HDL structure. Beyond the first coordination shell, we observe a feature at 4 Å growing with decreasing temperature. We propose that these correspond to interstitial molecules resulting from the collapse of the second coordination shell, which in HDA are observed at 3.6 Å [Citation32].
From the running coordination number, we conclude that, independent of temperature, the first coordination shell of water extends to 3.3 Å. We further observe an isosbestic point in the RDF at 2.95 Å. We conclude that in contrast to LDL, which has four strongly H-bonded neighbours, the HDL-like local structures have on average two strongly (<2.95 Å) and two weekly (2.95–3.3 Å) H-bonded water molecules.
TIP4P/2005 water slightly underestimates the temperature dependence of the LDL population. We argue that this is because the water model has a second critical point higher in pressure and lower in temperature than real water. Consequently, it is likely that the size of LDL domains in ambient pressure TIP4P/2005 simulations is also smaller than those in real water. Furthermore, we find that TIP4P/2005 slightly overestimates the amount of strong hydrogen bonds in the HDL structures, tending more towards 3 rather than 2 as indicated by experiment. The analysis presented here demonstrates the wealth of structural information that can be obtained from X-ray scattering data.
Supplemental Material
Download MS Word (534.8 KB)Acknowledgements
We thank Harshad Pathak and Fivos Perakis for valuable input and discussions.
Disclosure statement
No potential conflict of interest was reported by the author(s).
Data availability statement
The analysis discussed are based on previously published data by Skinner et al. [Citation38] The analysis has been repeated in the supporting information for the publicly available datasets from references [Citation37] and [Citation46].
Additional information
Funding
References
- P. Gallo, K. Amann-Winkel, C.A. Angell, M.A. Anisimov, F. Caupin, C. Chakravarty, E. Lascaris, T. Loerting, A.Z. Panagiotopoulos, J. Russo, J.A. Sellberg, H.E. Stanley, H. Tanaka, C. Vega, L. Xu and L.G.M. Pettersson, Chem. Rev. 116, 7463 (2016). doi:10.1021/acs.chemrev.5b00750
- O. Mishima and H.E. Stanley, Nature. 396, 329 (1998). doi:10.1038/24540
- H.E. Stanley, S.V. Buldyrev, O. Mishima, M.R. Sadr-Lahijany, A. Scala and F.W. Starr, J. Phys.: Condens. Matter. 12, A403 (2000). doi:10.1088/0953-8984/12/8A/355
- H.E. Stanley, S.V. Buldyrev, M. Canpolat, O. Mishima, M.R. Sadr-Lahijany, A. Scala and F.W. Starr, Phys. Chem. Chem. Phys. 2, 1551 (2000). doi:10.1039/b000058m
- R.J. Speedy and C.A. Angell, J. Chem. Phys. 65, 851 (1976). doi:10.1063/1.433153
- C.A. Angell, Annu. Rev. Phys. Chem. 34, 593 (1983). doi:10.1146/annurev.pc.34.100183.003113
- P.G. Debenedetti, J. Phys.: Condens. Matter. 15, R1669 (2003). doi:10.1088/0953-8984/15/45/R01
- A. Nilsson and L.G. Pettersson, Chem. Phys. 389, 1 (2011). doi:10.1016/j.chemphys.2011.07.021
- C.A. Angell, W.J. Sichina and M. Oguni, J. Phys. Chem. 86, 998 (1982). doi:10.1021/j100395a032
- C. Huang, T.M. Weiss, D. Nordlund, K.T. Wikfeldt, L.G. Pettersson and A. Nilsson, J. Chem. Phys. 133, 134504 (2010). doi:10.1063/1.3495974
- M. Oguni and C.A. Angell, J. Chem. Phys. 73, 1948 (1980). doi:10.1063/1.440303
- R.J. Speedy, J. Phys. Chem. 86, 982 (1982). doi:10.1021/j100395a030
- S. Sastry, P.G. Debenedetti, F. Sciortino and H.E. Stanley, Phys. Rev. E. 53, 6144 (1996). doi:10.1103/PhysRevE.53.6144
- P.H. Poole, F. Sciortino, U. Essmann and H.E. Stanley, Nature. 360, 324 (1992). doi:10.1038/360324a0
- L.G. Pettersson and A. Nilsson, J. Non-Cryst. Solids. 407, 399 (2015). doi:10.1016/j.jnoncrysol.2014.08.026
- A. Nilsson and L.G. Pettersson, Nat. Commun. 6, 1 (2015). doi:10.1038/ncomms9998
- J. Russo and H. Tanaka, Nat. Commun. 5, 1 (2014). doi:10.1038/ncomms4556
- P.G. Debenedetti, Metastable liquids: Concepts and Principles (Princeton University Press, Princeton, 1997).
- P. Ball, Chem. Rev. 108, 74 (2008). doi:10.1021/cr068037a
- P.G. Debenedetti, F. Sciortino and G.H. Zerze, Science. 369, 289 (2020). doi:10.1126/science.abb9796
- J. Weis, F. Sciortino, A.Z. Panagiotopoulos and P.G. Debenedetti, J. Chem. Phys. 157, 024502 (2022). doi:10.1063/5.0099520
- T.E. Gartner III, P.M. Piaggi, R. Car, A.Z. Panagiotopoulos and P.G. Debenedetti, Phys. Rev. Lett. 129, 255702 (2022). doi:10.1103/PhysRevLett.129.255702
- J.A. Sellberg, C. Huang, T.A. McQueen, N.D. Loh, H. Laksmono, D. Schlesinger, R.G. Sierra, D. Nordlund, C.Y. Hampton, D. Starodub, D.P. DePonte, M. Beye, C. Chen, A.V. Martin, A. Barty, K.T. Wikfeldt, T.M. Weiss, C. Caronna, J. Feldkamp, L.B. Skinner, M.M. Seibert, M. Messerschmidt, G.J. Williams, S. Boutet, L.G.M. Pettersson, M.J. Bogan and A. Nilsson, Nature. 510, 381 (2014). doi:10.1038/nature13266
- K.H. Kim, A. Späh, H. Pathak, F. Perakis, D. Mariedahl, K. Amann-Winkel, J.A. Sellberg, J.H. Lee, S. Kim, J. Park, K.H. Nam, T. Katayama and A. Nilsson, Science. 358, 1589 (2017). doi:10.1126/science.aap8269
- K.H. Kim, K. Amann-Winkel, N. Giovambattista, A. Späh, F. Perakis, H. Pathak, M.L. Parada, C. Yang, D. Mariedahl and T. Eklund, Science. 370, 978 (2020). doi:10.1126/science.abb9385
- H. Pathak, A. Späh, N. Esmaeildoost, J.A. Sellberg, K.H. Kim, F. Perakis, K. Amann-Winkel, M. Ladd-Parada, J. Koliyadu, T.J. Lane, C. Yang, H.T. Lemke, A.R. Oggenfuss, P.J.M. Johnson, Y. Deng, S. Zerdane, R. Mankowsky, P. Beaud and A. Nilsson, Proc. Natl. Acad. Sci. USA. 118, e2018379118 (2021). doi:10.1073/pnas.2018379118
- A. Nilsson, J. Non-Cryst. Solids: X. 14, 100095 (2022). doi:10.1016/j.nocx.2022.100095
- L. Kringle, W.A. Thornley, B.D. Kay and G.A. Kimmel, Science. 369, 1490 (2020). doi:10.1126/science.abb7542
- F. Caupin and M.A. Anisimov, J. Chem. Phys. 151, 034503 (2019). doi:10.1063/1.5100228
- L. Xu, P. Kumar, S.V. Buldyrev, S.-H. Chen, P.H. Poole, F. Sciortino and H.E. Stanley, Proc. Natl. Acad. Sci. USA. 102, 16558 (2005). doi:10.1073/pnas.0507870102
- H. Kanno and C.A. Angell, J. Chem. Phys. 70, 4008 (1979). doi:10.1063/1.438021
- D. Mariedahl, F. Perakis, A. Späh, H. Pathak, K.H. Kim, G. Camisasca, D. Schlesinger, C. Benmore, L.G.M. Pettersson and A. Nilsson, J. Phys. Chem. B. 122, 7616 (2018). doi:10.1021/acs.jpcb.8b04823
- D. Mariedahl, F. Perakis, A. Späh, H. Pathak, K.H. Kim, C. Benmore, A. Nilsson and K. Amann-Winkel, Phil. Trans. R. Soc. A. 377, 20180164 (2019). doi:10.1098/rsta.2018.0164
- A.K. Soper and M.A. Ricci, Phys. Rev. Lett. 84, 2881 (2000). doi:10.1103/PhysRevLett.84.2881
- A.V. Okhulkov, Y.N. Demianets and Y.E. Gorbaty, J. Chem. Phys. 100, 1578 (1994). doi:10.1063/1.466584
- D. Schlesinger, K.T. Wikfeldt, L.B. Skinner, C.J. Benmore, A. Nilsson and L.G. Pettersson, J. Chem. Phys. 145, 084503 (2016). doi:10.1063/1.4961404
- H. Pathak, A. Späh, K.H. Kim, I. Tsironi, D. Mariedahl, M. Blanco, S. Huotari, V. Honkimäki and A. Nilsson, J. Chem. Phys. 150, 224506 (2019). doi:10.1063/1.5100811
- L.B. Skinner, C.J. Benmore, J.C. Neuefeind and J.B. Parise, J. Chem. Phys. 141, 214507 (2014). doi:10.1063/1.4902412
- C. Huang, K.T. Wikfeldt, T. Tokushima, D. Nordlund, Y. Harada, U. Bergmann, M. Niebuhr, T.M. Weiss, Y. Horikawa and M. Leetmaa, Proc. Natl. Acad. Sci. USA. 106, 15214 (2009). doi:10.1073/pnas.0904743106
- C. Huang, K.T. Wikfeldt, D. Nordlund, U. Bergmann, T. McQueen, J. Sellberg, L.G. Pettersson and A. Nilsson, Phys. Chem. Chem. Phys. 13, 19997 (2011). doi:10.1039/c1cp22804h
- A. Nilsson, C. Huang and L.G.M. Pettersson, J. Mol. Liq. 176, 2 (2012). doi:10.1016/j.molliq.2012.06.021
- R.W. Hendricks, P.G. Mardon and L.B. Shaffer, J. Chem. Phys. 61, 319 (1974). doi:10.1063/1.1681639
- G.N.I. Clark, G.L. Hura, J. Teixeira, A.K. Soper and T. Head-Gordon, Proc. Natl. Acad. Sci. U.S.A. 107, 14003 (2010). doi:10.1073/pnas.1006599107
- K.H. Kim, A. Späh, H. Pathak, F. Perakis, D. Mariedahl, K. Amann-Winkel, J.A. Sellberg, J.H. Lee, S. Kim and J. Park, Science. 360, eaat1729 (2018). doi:10.1126/science.aat1729
- A. Guinier, G. Fournet and K.L. Yudowitch, (1955).
- C. Benmore, L.C. Gallington and E. Soignard, Mol. Phys. 117, 2470 (2019). doi:10.1080/00268976.2019.1567853
- E. Shiratani and M. Sasai, J. Chem. Phys. 104, 7671 (1996). doi:10.1063/1.471475
- H. Tanaka, J. Chem. Phys. 153, 130901 (2020). doi:10.1063/5.0021045
- R. Foffi, J. Russo and F. Sciortino, J. Chem. Phys. 154, 184506 (2021). doi:10.1063/5.0049299
- A. Neophytou, D. Chakrabarti and F. Sciortino, Nat. Phys. 18, 1248 (2022). doi:10.1038/s41567-022-01698-6
- P. Wernet, D. Nordlund, U. Bergmann, M. Cavalleri, M. Odelius, H. Ogasawara, L.A. Naslund, T.K. Hirsch, L. Ojamae and P. Glatzel, Science. 304, 995 (2004). doi:10.1126/science.1096205
- T. Fransson, Y. Harada, N. Kosugi, N.A. Besley, B. Winter, J.J. Rehr, L.G. Pettersson and A. Nilsson, Chem. Rev. 116, 7551 (2016). doi:10.1021/acs.chemrev.5b00672
- G. Camisasca, D. Schlesinger, I. Zhovtobriukh, G. Pitsevich and L.G. Pettersson, J. Chem. Phys. 151, 034508 (2019). doi:10.1063/1.5100875
- L. Ojamaee and K. Hermansson, J. Phys. Chem. 98, 4271 (1994). doi:10.1021/j100067a011
- F. Weinhold, J. Chem. Phys. 109, 373 (1998). doi:10.1063/1.476574
- Q. Sun, Vib. Spectrosc. 62, 110 (2012). doi:10.1016/j.vibspec.2012.05.007
- Q. Sun, Chem. Phys. Lett. 568, 90 (2013). doi:10.1016/j.cplett.2013.03.065
- J.L. Abascal and C. Vega, J. Chem. Phys. 123, 234505 (2005). doi:10.1063/1.2121687
- H.L. Pi, J.L. Aragones, C. Vega, E.G. Noya, J.L.F. Abascal, M.A. Gonzalez and C. McBride, Mol. Phys. 107, 365 (2009). doi:10.1080/00268970902784926
- G. Camisasca, H. Pathak, K.T. Wikfeldt and L.G.M. Pettersson, J. Chem. Phys. 151, 044502 (2019). doi:10.1063/1.5100871
- D. Van Der Spoel, E. Lindahl, B. Hess, G. Groenhof, A.E. Mark and H.J. Berendsen, J. Comput. Chem. 26, 1701 (2005). doi:10.1002/jcc.20291
- H. Pathak, A. Späh, K. Amann-Winkel, F. Perakis, K.K.H. Kim and A. Nilsson, Mol. Phys. 117, 3232 (2019). doi:10.1080/00268976.2019.1649486