
ABSTRACT
The discussion following Bem’s (Citation2011) psi research highlights that applications of the Bayes factor in psychological research are not without problems. The first problem is the omission to translate subjective prior knowledge into subjective prior distributions. In the words of Savage (Citation1961): “they make the Bayesian omelet without breaking the Bayesian egg.” The second problem occurs if the Bayesian egg is not broken: the omission to choose default prior distributions such that the ensuing inferences are well calibrated. The third problem is the adherence to inadequate rules for the interpretation of the size of the Bayes factor. The current paper will elaborate these problems and show how to avoid them using the basic hypotheses and statistical model used in the first experiment described in Bem (Citation2011). It will be argued that a thorough investigation of these problems in the context of more encompassing hypotheses and statistical models is called for if Bayesian psychologists want to add a well-founded Bayes factor to the tool kit of psychological researchers.
Introduction
In the behavioral and social sciences often a null-hypothesis is compared to an alternative hypothesis to test a theory or expectation. An example that will be used throughout the current paper is based on a continuous response yi that is recorded for i = 1, …, N persons and which is assumed to be normally distributed with mean μ and variance σ2. The corresponding null and alternative hypotheses are H0: μ = 0 and H1: μ ≠ 0. There are two main approaches for the comparison of null and alternative hypotheses. The first approach originates from the frequentist tradition with respect to statistical inference in which null-hypotheses are evaluated using a well-chosen test-statistic and the corresponding probability of exceedance also known as the p value. Usually the evaluation of H0: μ = 0 and H1: μ ≠ 0 is based on the one-sample t test, which leads to a rejection of H0 if the corresponding p value is smaller than a prespecified alpha level (the error of the first kind) of .05.
In the last decade this approach has increasingly been criticized and a second approach originating from the Bayesian tradition with respect to statistical inference has been studied (see for example, Trafimow, Citation2003, and Wagenmakers, Citation2007). In the Bayesian approach, the evaluation of H0 and H1 is based on the Bayes factor BF01 where the subscripts indicate that H0 is compared to H1 (see Kass and Raftery, Citation1995, for a comprehensive introduction). The Bayes factor quantifies the evidence in the data for the hypotheses under investigation (note that there is no relation with the factors from factor analysis). If BF01 = 1, the data equally support H0 and H1. If BF01 = 10, the support in the data is 10 times larger for H0 than for H1. According to guidelines presented by Kass and Raftery (Citation1995) based on Jeffreys (Citation1961) a Bayes factor in the range 1–3 constitutes anecdotal evidence in favor of H0, 3–20 constitutes positive evidence and 20–150 strong evidence. Similar rules hold for evidence in favor of H1: ranges of 1/3–1, 1/20–1/3, and 1/150–1/20 constitute anecdotal, positive, and strong evidence, respectively.
Rouder, Speckman, Sun, Morey, and Iverson (Citation2009) present an easy-to-compute Bayes factor that is a Bayesian alternative for the one-sample t test. Two ingredients are needed for the computation of the Bayes factor: the density of the data and prior distributions for the parameters. The density of the data is also used in the frequentist approach to statistical inference. However, the prior distribution is unique to the Bayesian approach. The density of the data is
(1)
in which the parameters are the effect size δ = μ/σ and the residual variance σ2. In H0, δ = 0 and σ2 is unknown, therefore only the prior distribution of σ2 has to be specified. In line with recommendations from Jeffreys (Citation1961); Rouder et al. (Citation2009) use h(σ2) = 1/σ2. In H1 both δ and σ2 are unknown, again in line with recommendations from Jeffreys (Citation1961), Rouder et al. (Citation2009) use the prior distribution hC(δ, σ2) = Cauchy(0, τ)1/σ2 leading to the Jeffreys, Zellner and Siow (JZS) Bayes factor or leading to the scaled-information Bayes factor. Note that τ denotes the scale or standard deviation of the prior distribution. There are no arguments in favor of or against either Bayes factor, any preference is subjective. This is not a major issue because the size of both Bayes factors is usually comparable.
In the current paper the scaled-information Bayes factor
(2) will be used because it is easily computed using the t value resulting from the one-sample t test t, the sample size N, and the prior scale τ. According to, for example, Kass and Raftery (Citation1995), the prior distribution for parameters like σ2 that are unrestricted in both hypotheses hardly influences the resulting Bayes factor. As can be seen, h(σ2) is not involved in the computation of Equation (Equation2
(2) ). However, the prior distribution of parameters like δ that are restricted in one of the hypotheses does have an influence on the resulting Bayes factor. As can be seen in Equation (Equation2
(2) ) the scaled-information Bayes factor does indeed depend on the prior scale τ. The implications of this dependence will be illustrated below and elaborated and discussed in the next section. However, in order to be able to do so, first of all the first experiment from Bem (Citation2011) will be introduced.
Use of the Bayes factor for the evaluation of H0 and H1 is not undisputed. Trafimow (Citation2003) appreciates the Bayesian way of quantifying evidence for the hypotheses of interest, but doubts that it is practically useful because it is unclear how τ should be chosen (note that Trafimow, Citation2003, has more elaborate considerations; here only the one relevant for the content of the current paper is highlighted). This issue reappears when Bayesian psychologists discuss the psi experiments presented in Bem (Citation2011). One aspect of psi is precognitive detection, that is, according to Bem (Citation2011), the prediction of a future event that cannot be anticipated through any known inferential process. The first experiment used by Bem (Citation2011) to investigate psi is based on the notion that it would be evolutionarily advantageous for organisms to be able to preemptively detect erotic stimuli. In a 20-minute computer session participants in the experiment were shown images of two curtains, with only one of them having a picture behind it. The participants were then asked to click on the curtain which they thought concealed the picture. The pictures behind the curtains consisted of 12 (for 40 participants) or 18 (for 60 participants) erotic pictures that were randomly mixed with 24 or 18 other pictures, rendering a total of 36 pictures for each participant. The percentage of correctly identified erotic pictures was defined as the erotic hit rate. To keep the original notation of the formulas appearing in the current paper, for each person we subtract .50 from the erotic hit rate to obtain the scores yi. Note that this implies that yi = 0 corresponds to an erotic hit rate of .50.
According to Bem, “The main hypothesis was that participants would be able to identify the position of the hidden erotic picture significantly more often than chance.” Although this is a directional hypothesis Bem (Citation2011) used H0: μ = 0 and H1: μ ≠ 0. Later in the current paper it will be shown how Bayes factors can be used to evaluate subjective prior distributions that account for the one-sided nature of Bem’s main hypothesis. The first experiment described in Bem (Citation2011) with N = 100 rendered an erotic hit rate of .531, that is, , with a variance of .015 rendering
, a corresponding p value of .01, and an observed effect size
.
Wagenmakers, Wetzels, Borsboom, and van der Maas (Citation2011) provide a thorough evaluation of the methodology used by Bem (Citation2011). One of their points is an argument in favor of the Bayes factor over the use of p values to evaluate the hypotheses of interest. Following Wagenmakers et al. (Citation2011) using Equation (Equation2(2) ) with τ = 1 rendered BF10 = 2.10, which is smaller than 3 and therefore, according to the rules presented by Kass and Raftery (Citation1995), constitutes only anecdotal evidence in favor of H1 (note the reversal in the indices of the Bayes factor). Bem, Utts, and Wesley (Citation2011) criticized the prior distribution that was used by Wagenmakers et al. (Citation2011) and computed the Bayes factor with τ = .5 obtaining BF10 = 3.79, which is positive evidence in favor of H1. As was already foreseen by Trafimow (Citation2003), it is not at all clear how to specify τ. This is important because “The scale of τ = 1 [or τ = .5] is arbitrary while it clearly has an impact on posterior results” (Robert, Chopin, & Rousseau, Citation2009).
Using the first experiment from Bem (Citation2011) as an example, the current paper will provide a commentary and evaluation of the manner in which the Bayes factor is currently used in psychological research as exemplified in Wagenmakers et al. (Citation2011) and Bem et al. (Citation2011). Three problems with the application of the Bayes factor in psychological research will be highlighted. As will be argued in the current paper, Bayesian psychologists will have to provide solutions to these problems if they want to add a well-founded Bayes factor to the tool kit of psychological researchers.
First of all, Bayesian psychologists want to “make the Bayesian omelet without breaking the Bayesian egg” (Savage, Citation1961), that is, Bayesian psychologists want to evaluate subjective opinions with respect to psi (compute Bayes factors for the hypotheses of interest), but do not specify subjective prior distributions. A subjective prior distribution is obtained if a researcher specifies for each value of δ how likely it is expected to be and summarizes the result in a distribution. This is not often done because it is rather difficult. It is easier to assume that the prior distribution is normal (thereby sacrificing a part of the subjectivity) and to specify only the mean and the variance of this distribution. However, this is not what Wagenmakers et al. (Citation2011) and Bem et al. (Citation2011) do. They fix the mean of the prior distribution at zero, independent of the application at hand. This means that their prior distribution is default, that is, a choice that is expected to work in a wide variety of applications and circumstances. It will be shown later in the current paper how subjective prior distributions could be specified and evaluated for the hypotheses entertained by Bem (Citation2011).
Secondly, when pursuing a default (the mean of the prior distribution for δ is fixed at zero) instead of subjective mode of Bayesian inference Bayesian psychologists choose the variance of the prior distribution such that one of the hypotheses under consideration is favored. This lack of calibration originates in the work of Jeffreys (Citation1961) and continues in Liang, Paulo, Molina, Clyde, and Berger (Citation2008). Both publications inspired the work of Rouder, Speckman, Sun, Morey, and Iverson (Citation2009) who introduced the Bayes factor used by Wagenmakers et al. (Citation2011) and Bem et al. (Citation2011) to psychological researchers. Later in the current paper it will be elaborated what is meant by well calibrated and how well-calibrated prior distributions can be obtained for the hypotheses entertained by Bem (Citation2011).
Thirdly, there are no generally accepted and well-founded rules for the interpretation of the size of the Bayes factor. Bayesian psychologists tend to adhere to rules for the interpretation of the size of the Bayes factor proposed by Jeffreys (Citation1961) or Kass and Raftery (Citation1995). As will be shown in the current paper, the least that can be said is that these rules do not apply to the hypotheses evaluated by Wagenmakers et al. (Citation2011) and Bem et al. (Citation2011). It is therefore very likely that these rules are also inadequate for other hypotheses that are evaluated by means of the Bayes factor. In the current paper it will be elaborated how frequency calculations can be used to provide an interpretation of the size of the Bayes factor.
Given the increasing amount of attention for the Bayes factor as a tool for the evaluation of hypotheses in psychological research in the last 3 years, it is very important to stress that high-quality inferences are only obtained if these three problems are addressed. If this is not acknowledged, Bayesian approaches will be introduced into the literature; that may very well not be an improvement over the currently heavily criticized p value based approaches (see, for example, Wagenmakers, Citation2007). Using the first experiment described in Bem (Citation2011), the options that can be used to improve upon the current state of affairs will be illustrated. Exploration, implementation, and evaluation of these options delimits a new research terrain that Bayesian psychologists have to explore if they want to add well-founded methods to the tool kit of psychological researchers.
The current paper is structured as follows. In the next section it will be shown how well-calibrated prior distributions can be chosen for the formulation of the hypotheses used by Bem et al. (Citation2011) and Wagenmakers et al. (Citation2011). Subsequently it will be shown how well-founded rules for the interpretation of the size of the Bayes factor can be derived. Thereafter it will be shown that the calibration issue can be avoided if subjective prior distributions are chosen for the hypotheses of interest. The paper concludes with an elaboration of the title “Why Bayesians psychologists should change the way they use the Bayes factor.”
Calibrated prior knowledge
In this section it will be elaborated how τ can be chosen such that the prior distribution is well calibrated, that is, results in a well calibrated Bayes factor, that is, a Bayes factor which is unbiased with respect to the hypotheses under investigation. Wagenmakers et al. (Citation2011) use hC(δ) with τ = 1. This choice is suggested by Jeffreys (Citation1961) and according to Rouder et al.’ is (Citation2009) usually a reasonable choice. Two arguments are provided for this choice. First of all, this prior favors smaller effect sizes, which, as Rouder et al. (Citation2009) argue, is in agreement with the effect sizes usually observed in psychological research. Secondly, the amount of information in the prior corresponds to the amount of information rendered by one observation. The latter was the motivation for the name unit information prior (see also Liang et al., Citation2008) if hN(δ) is specified using τ = 1. Where the first argument is reasonable if a subjective prior is specified, it loses its appeal if a default prior with a fixed mean of zero is used. Furthermore, neither is it explained why it is desirable to use a prior with an information content equivalent to the amount of information in one person nor is it explained which situations are covered by “usually.” Bem et al. (Citation2011) present a variation on the first argument of Rouder et al. (Citation2009). They claim that effect sizes in psychology usually fall in the range .2 < δ < .3 and that this is adequately represented by hC(δ) with τ = .5. However, why this representation is adequate is not elaborated and rules for the translation of other ranges into a value of τ are not given. It would, for example, have been interesting to see which range of effect sizes corresponds to the choice τ = 1.
As will be elaborated in this section, ad hoc choices of τ are not a good idea because they may very well result in an ill-calibrated Bayes facor. It has to be noted that Rouder et al. (Citation2009) and Wagenmakers et al. (Citation2011) either in the publications referred to in the current paper or in other publications, also note that the choice τ = 1 is to some degree arbitrary and that other values could/should be considered. However, concrete criteria and hand holds for the choice of τ are lacking. As will now be elaborated, this can be remedied using calibrated prior distributions.
An important property of default Bayes factors based on default priors should be that they are well calibrated. Different definitions of well calibrated are possible. In the current paper we will use two definitions:
Definition 1:
The Bayes factor for the comparison of H0 and H1 is well-calibrated if τ is chosen such that P(BF01 > 1∣H0: δ = 0) = P(BF01 < 1∣H1: δ = ES), where ES denotes an effect size that is strictly unequal to zero.
In words Definition 1 states that the Bayes factor is well calibrated if the probability that H0 is supported (BF01 > 1) if H0 is true is equal to the probability that H1 is supported (BF01 < 1) if H1 is true. Note that in Definition 1 equality of both probabilities is required for a specific value of the effect size ES. How to deal with the fact that ES is unknown will be elaborated below. Note also that equality of both probabilities implies that the Bayes factor is unbiased with respect to H0 and H1. Note furthermore that 1 − P(BF01 > 1∣H0: δ = 0) and P(BF01 < 1∣H1: δ = ES) are unconditional error probabilities that correspond to the error of the first kind and the power, respectively. Note finally that values of BF01 in the range [0,1] favor H0 and in the range [1,∞] favor H1. Definition 1 could also have been formulated in terms of the log BF01, which is symmetric around 0: BF01 is well calibrated if τ is chosen such that P(log BF01 > 0∣H0: δ = 0) = P(log BF01 < 0∣H1: δ = ES). However, because Bayes factors are usually not presented on the log scale, we will adhere to Definition 1.
Inspired by null-hypothesis significance testing one could also use Definition 2.
Definition 2:
The Bayes factor for the comparison of H0 and H1 is well calibrated if τ is chosen such that 1 − P(BF01 > 1∣H0: δ = 0) = .05, that is, if P(BF01 > 1∣H0: δ = 0) = .95.
Still other definitions are conceivable. However, in the current paper it suffices to work with Definitions 1 and 2 to show that the choice of τ is crucially important to obtain well-calibrated default Bayes factors.
presents the information that will be used to support our argument in favor of calibrated prior distributions and against choices like τ = .5 and τ = 1.0. However, first of all we will elaborate how the 1 minus the Type I error rates P(BF01 > 1∣H0: δ = 0) and power curves P(BF01 < 1∣H1: δ = ES) that are displayed in are computed. The following procedure was used:
Step 1. A sample of 100,000 data matrices with N = 100 was obtained from a population in which H0 is true. This corresponds to 100,000 t values sampled from a t distribution with 99 degrees of freedom and non-centrality parameter 0. Note that N = 100 corresponds to the sample size used by Bem (Citation2011) and that a t distribution with 99 degrees of freedom is almost a standard normal distribution.
Figure 1. Probability of correctly preferring H0 and H1 as a function of τ for N = 100 based on the scaled information Bayes factor. Note that the optimal τ value according to Definition 1 can be found at the crossing of the line labeled P(BF01 > 1|δ = 0) with the power curves P(BF01 < 1|δ = ES) for ES ∈ {.20, .25, .30, .35, .40}. Vertical lines have been inserted in the figure at τ = .125, τ = .225, and τ = .90, to highlight crossings for effect sizes of .20, .25, and .40, respectively. The vertical line at the right also marks the optimal τ value according to Definition 2. 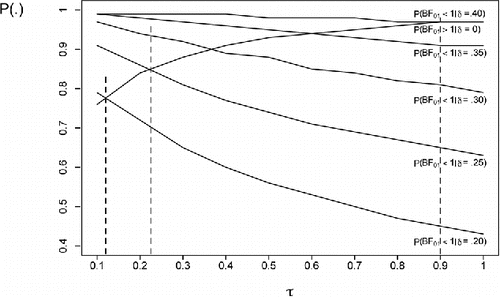
Step 2. The scaled information Bayes factor Equation (Equation2
(2) ) (Rouder et al. Citation2009) is a function of the t value, the sample size N, and τ. For each sampled t value and τ values .05, .10, …, 1.0, the Bayes factor was computed.
Step 3. For each τ value 1 minus the Type I error rate P(BF01 > 1∣δ = 0) was estimated using the proportion of t values for which BF01 > 1 and displayed in . A similar approach was used to compute power curves P(BF01 < 1∣δ = ES), for ES ∈ {.20, .25, .30, .35, .40}. The difference was that 100,000 t values were sampled from a t distributions with 99 degrees of freedom and non-centrality parameter
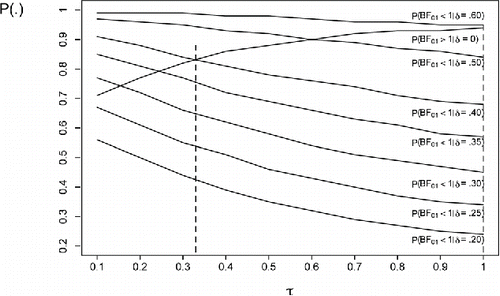
As can be seen in , the requirement formulated in Definition 1 is for each effect size achieved at a different value of τ. For example, for δ = .20 the optimum is τ = .125 and for δ = .40 the optimum is τ = .90. The requirement formulated in Definition 2 is achieved for τ = .90. presents the same information as for N = 36. Definition 1 requires a τ value smaller than .10 for δ = .20 and τ = .33 for δ = .40. The requirement formulated in Definition 2 is achieved for τ = 1. As can be seen comparing Figures and , the optimal value of τ depends on the sample size. Because the sample size is known after the data are collected, figures that are tailored to the data set at hand can always be created. From hereon we will limit ourselves to , which is tailored to the N = 100 in the first experiment of Bem (Citation2011).
Choosing τ according to Definition 2 is straightforward because only the Type I error rates have to be considered. Choosing τ according to Definition 1 involves both 1 minus the Type I error rate and the power curves and is complicated because the effect size is unknown. Wagenmakers et al. (Citation2011) use the default value τ = 1.0. As can be seen in this choice favors H0, which is almost never incorrectly rejected and leads (especially for smaller effect sizes) to many incorrect rejections of H1. Especially in the context of the experiments of Bem (Citation2011) where, if any, small effects are expected, τ = 1.0 is a choice that leads to an ill-calibrated Bayes factor. Bem et al. (Citation2011) use the default value τ = .5. This choice is optimal if δ = .325. However, Bem et al. (Citation2011) state that in most psychological research δ ranges from .2 to .3. That (prior) knowledge should have translated into the use of τ = .225, which according to Definition 1 is the optimal choice for δ = .25.
For the hypotheses at hand H0: δ = 0 and H1: δ ≠ 0 there are basically three options to use to choose a value of τ in accordance with Definition 1:
The subjective option
Use prior knowledge to create a range of relevant effect sizes for the application at hand (like Bem et al., Citation2011, did) and choose τ accordingly. Note that use of this option implies that the Bayes factor is no longer default. Researchers have to provide subjective input. Note also that in the previous paragraph we used a very simple approach to choose the optimal value of τ for a range of effect sizes: choose the optimal value of τ for the midpoint of the range. Better founded options based on integration over a prior distribution for the effect sizes are conceivable. However, these are beyond the scope of the current paper. We want to provide a research agenda for Bayesian psychologists who want to improve the use of the Bayes factor, not execute this agenda. Furthermore, if researchers are able to specify a prior distribution for the effect sizes, a default Bayes factor is no longer needed. As will be illustrated later in the current paper, researchers can then evaluate the hypotheses of interest using a non-default, that is, a subjective Bayes factor.
The rational option
Looking at it can be seen that for effect sizes larger than .30 the choice of τ is relatively unimportant because the probabilities of a correct decision are (with the exception of very small τ values) larger than .80 both under H0 and H1. However, for effect sizes smaller than .30 the choice of τ is important because for increasing values of τ the probability of a correct decision if H1 is true decreases rapidly. This implies that τ should be chosen such that the Bayes factor is well-calibrated for smaller effect sizes, say, effect sizes in the range .20 to .30. This can be achieved, for example, by using τ = .225, which according to Definition 1 is the optimum for an effect size of .25. What is given in this paragraph is only a sketch of the rational option based on reasonable but also partly ad hoc choices like “probabilities of a correct decision larger than .80 are sufficient” and “smaller effect sizes range from .20 to .30.” Providing less ad hoc choices is an issue that should be added to the research agenda of Bayesian psychologists.
Using the data
Data based approaches to determine τ have been developed (see, Mulder, Hoijtink, and de Leeuw, Citation2012, and the references therein for an overview). The main idea underlying these approaches is to use a small amount of the data to determine τ and the remaining data to compute BF01. Whether these approaches can be implemented such that the resulting Bayes factors are calibrated according to Definition 1 is a topic that should be added to the research agenda of Bayesian psychologists.
Using τ = 1.0 Wagenmakers et al. (Citation2011) obtained BF10 = 2.10 (note that due to a reversal in the indices of the Bayes factor this denotes support in favor of H1). Using τ = .50 Bem et al. (Citation2011) obtained BF10 = 3.79. Using Definition 1, according to the subjective and the rational approach the optimal value for τ = .225 which renders BF10 = 5.27. Using Definition 2 and thus τ = .90 renders BF10 = 2.33.
As can be seen, both the definition of well-calibrated and the choice of τ make a difference in the amount of support for H1 and is therefore important. According to the rules of Kass and Raftery (Citation1995) (but see the next section in which these rules are criticized) 2.10 and 2.33 are not worth a bare mentioning, 3.79 constitutes positive evidence, and 5.27 is well beyond the demarcation value of 3.0 for positive evidence in favor of psi (but do not forget to read the epilogue to the current paper). Consequently, the choice of well-calibrated prior distributions if the goal is to compare hypotheses by means of a default Bayes factor (also beyond the context of the rather simple hypotheses that are considered in the current paper) is an issue that should be placed high on the research agenda of Bayesian psychologists.
Interpreting the size of the Bayes factor
In the previous section it was shown that relatively ad hoc choices of τ will lead to ill-calibrated Bayes factors. Furthermore, possible routes to a choice of τ such that well-calibrated Bayes factors are obtained were discussed and illustrated. In this section it will be shown that rules for the interpretation of the size of the Bayes factor proposed by Jeffreys (Citation1961) and modified by Kass and Raftery (Citation1995) are also ad hoc. The rules were that BF01 values in the range 1–3 and 1/3–1 are considered “anecdotal evidence,” in the range 3–20 and 1/20–1/3 “positive evidence,” and in the range 20–150 and 1/150–1/20 “strong evidence.” Using the running example, it will be shown that there is no generally applicable foundation for these rules. An alternative is the use of conditional probabilities, that is, the probability of a correct decision given the value of the Bayes factor computed for the data set at hand.
In two conditional probabilities are presented. If BF01 is smaller than 1.0, the evidence in the data is in favor of H1. The corresponding conditional probability is P(H1|BF01, δ = ES), that is, the probability of correctly choosing H1 if the Bayes factor is smaller than 1.0 and δ = ES. Note that, as will be shown in , the smaller BF01 the larger this conditional probability. It is displayed in the left-hand panel of . If BF01 is larger than 1.0, the evidence in the data is in favor of H0. The corresponding conditional probability is P(H0|BF01, δ = ES), that is, the probability of correctly choosing H0 if the Bayes factor is larger than 1.0 and δ = ES. Note that, as will be shown in , the larger BF01 the larger this conditional probability. It is displayed in the right-hand panel of . Before discussing , it will now be elaborated how this figure was constructed:
Step 1a. Sample 1,000,000 data matrices with N = 100 from a population in which H0 is true. This corresponds to 1,000,000 t values sampled from a t distribution with 99 degrees of freedom and non-centrality parameter 0, that is, almost a standard normal distribution.
Figure 3. Conditional probabilities of preferring H0 and H1 given the observed size of the scaled information Bayes factor for N = 100 and τ = .225. The left hand side of the figure displays P(H1|BF01, δ = ES) for ES ∈ {.20, .25, .30} the right hand side of the figure displays P(H0|BF01, δ = ES) for ES ∈ {.20, .25, .30}. Vertical lines have been added to highlight the conditional probabilities at BF01 = .3 and BF01 = 2.3. 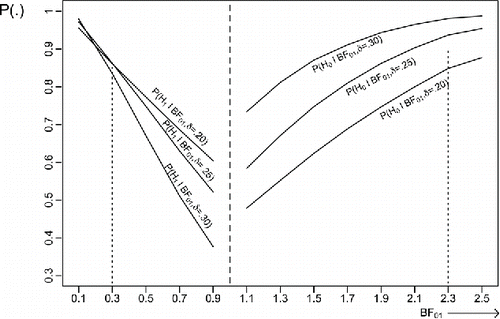
Step 1b. Sample 1,000,000 data matrices with N = 100 from populations in which H1 is true and δ’s of .20, .25, and .30, respectively. This corresponds to 1,000,000 t values sampled from each of three t distributions with 99 degrees of freedom and non-centrality parameters 2.0, 2.5, and 3.0, respectively.
Step 2. Compute the scaled information Bayes factor Equation (Equation2
Step 3. Collect the resulting 4,000,000 Bayes factor values in the following bins: 0–.2, .2–.4, …, 2.6–2.8. What is displayed on the x-axis in are the centers of each bin, that is, .3, .5, …, 2.7.
Step 4. For the first five bins (corresponding to Bayes factors smaller than 1.0) compute the proportion of Bayes factors in favor of H1, that is, the conditional probability P(H1∣BF01, δ = ES) for each value of ES. If, for example, a Bayes factor in the bin with center .5 is observed, this is the probability that this Bayes factor corresponds to a data set sampled from H1 with δ = ES. Display these proportions in . Similarly, for the last eight bins (corresponding to Bayes factors larger than 1.0) compute P(H0∣BF01, δ = ES) for each value of ES and display the corresponding proportions in .
can be used to judge the evidence implied by a certain range of Bayes factor values. Suppose, for example, the Bayes factor computed using the observed data has a value falling in the bin with center .3. Then, as can be seen in , irrespective of the effect size (.20, .25, and .30), the conditional probability of correctly concluding that the data originated from H1 is about 85%. Without hesitation this can be called “strong evidence” because in only 15% of the cases the preference for H1 is incorrect. Applying the rules presented in Kass and Raftery (Citation1995), the conclusion would be that .3 is smaller than 1/3 but larger than 1/20, that is, positive evidence in favor of H1. Clearly the label “positive evidence” is not in agreement with conditional error probabilities of 85%. To give another example, suppose the Bayes factor falls in the bin with center 2.3. For ES = .25 the conditional probability of correctly concluding that the data originated from H0 is about 90%. For ES = .20 and ES = .30 the conditional probabilities are somewhat smaller and higher, respectively. Applying the rules presented in Kass and Raftery (Citation1995), the conclusion would be that 2.3 is smaller than 3 and therefore constitutes anecdotal evidence in favor of H0. Clearly the label “anecdotal evidence” is not in agreement with conditional error probabilities of around 90%. The conclusion must be that labels for different sizes of the Bayes factor are misleading. A labeling in terms of the conditional probabilities P(H1∣BF01, δ = ES) and P(H0∣BF01, δ = ES) is much less ambiguous.
Like for the interpretation of is complicated by the fact the effect size is unknown. Here too this can in principle be handled using subjective, rational, and data-based approaches. Which of these options is to be preferred (also beyond the context of the simple hypotheses that are used to illustrate the current paper) requires further evaluation. This constitutes another item for the research agenda of Bayesian psychologists.
The interested reader is referred to Wetzels, Matzke, Lee, Rouder, Iverson, and Wagenmakers (Citation2011) who use effect sizes observed in empirical research instead of frequency calculations to critically reflect on benchmarks for the interpretation of p values and Bayes factors. Their work too shows that attaching verbal labels to ill-founded benchmarks is asking for trouble. We will end our criticism of fixed benchmarks and arbitrary labels using a quote from Rosnow and Rosenthal (Citation1989) who address the label “significant” which is attached to p values smaller than the benchmark “.05”: “Surely God loves the .06 as much as the .05.” A much better approach is to use information as displayed in to evaluate the size of a Bayes factor. It allows very clear statements like “if BF01 = .19 (like it is for the Bem data using τ = .225) it is in the bin with center .1 which implies that the conditional probability that the data originated from H1 is about .95” (see ). This implies that the size of the Bayes factor does not constitute “positive” evidence in favor of H1 (as would be concluded using the rules from Kass and Raftery, Citation1995), but a conditional probability of .95 that psi exists (but do not forget to read the epilogue to the current paper).
Subjective prior knowledge
Rouder et al. (Citation2009), Wagenmakers et al. (Citation2011), and Bem (Citation2011) use default Bayes factors based on a prior distribution for δ with a mean fixed at zero and τ = .5 or τ = 1.0. There is no objection against the use of default Bayes factors if τ is chosen such that the resulting Bayes factors are well calibrated. However, if a researcher has subjective opinions these could be translated in subjective prior distributions thereby “baking a Bayesian omelette after breaking the Bayesian egg.”
Bem et al. (Citation2011) use a Cauchy(0, .5) prior distribution for δ to reflect their belief that effect sizes in psychological research are usually in the range .2–.3. However, this prior places equal amounts of mass at positive and negative effect sizes, that is, it reflects the prior believe that the erotic hit rate is either larger or smaller than .5. This is not in agreement with Bem’s theory that states that erotic pictures improve the performance of the participants in his experiment, that is, the erotic hit rate should be larger than .5.
A translation of Bem’s ideas into prior distributions for δ and σ2 under H0 and H1 could be as follows. If psi does not exist, each of i = 1, …, 100 participants has a probability of .5 to guess correctly behind which curtain the erotic picture is hidden. This implies that h(δ) has a density of 1.0 at δ = 0 and 0.0 elsewhere. Participants have to evaluate 12 or 18 pairs of curtains. Assuming that the probability of choosing the correct curtain is about .5, the variance of the erotic hit rates will be about (note that 15 is the average of the 12 or 18 pairs of curtains presented to the participants in the experiment). Based on this result a convenient choice for the prior distribution of σ2 could be h(σ2) = U[.012, .022] (U denotes a uniform distribution). If psi does exist and based on an expected effect size range of .2–.3,
and h(σ2) = U[.012, .022] can be used. Note that .000625 is obtained as the prior variance if it is assumed that a range of .2–.3 implies a standard deviation of .025 (.25 ± 2 × .025 renders the interval .2–.3).
Using a Bayes factor the support in the data for both hypotheses can be quantified:
(3) where δm and σ2m for m = 1, …, 100000 are numbers sampled from the prior distributions of δ and σ2, respectively.
We do not have the data from Bem (Citation2011). However, in Bem’s (Citation2011) first example yi is distributed with a mean of .031 (corresponding to an erotic hit rate of .531) and a variance of .015. Using N = 100 normally distributed numbers with this mean and variance we computed BFno psi, psi to be .12, that is, the support in the data is 8.33 times larger for Hpsi than for Hnopsi. According to the Kass and Raftery (Citation1995) rules, this constitutes positive evidence in favor of psi (but see the epilogue to the current paper).
Calibration is not an issue if subjective prior distributions are used. However, the interpretation of the size of the Bayes factor still is an issue. This issue could be addressed using a modification of the procedure described in the previous section. Another issue is of course: how to arrive at sensible subjective prior distributions. The interested reader referred to O’Hagan, Buck, Daneshkhah, Eiser, Garthwaithe, Jenkinson, Oakley, and Rakow (Citation2006) for a book about the elicitation and formalization of subjective prior knowledge and Hoijtink (Citation2012) for a book about the specification and evaluation of subjective hypotheses (in the book these are called informative hypotheses).
Resume: Bayesian psychologists should change the way they use the Bayes factor
Bayesian psychologists should change the way they use the Bayes factor, or, as a reviewer formulated it, Bayesian psychologists should use the Bayes factor in the right way. As was illustrated in the previous section, one option is to bake a Bayesian omelette (computing Bayes factors for the hypotheses of interest) by breaking the Bayesian egg (formulating subjective prior distributions) because then calibration of prior distributions is not an issue. What is an issue is the formulation of subjective prior distributions such that the hypotheses of interest are adequately represented. This topic requires further study and research by Bayesian psychologists. A good point of departure is given by the books by O’Hagan et al. (Citation2006) about the subjective specification of prior distributions and Hoijtink (Citation2012) about the specification and evaluation of subjective hypotheses. What remains important, also if the Bayesian egg is broken, is the interpretation of the size of the Bayes factor. What should be reported after hypotheses are evaluated are not only the prior distributions used and the Bayes factor, but also information like is displayed in that can be used to interpret the strength of evidence represented by the size of the Bayes factors that are obtained.
Another option is to use default hypotheses like the traditional null and alternative hypotheses that are omnipresent in psychological research. However, as elaborated in the current paper, then it is necessary to use well-calibrated prior distributions leading to well-calibrated Bayes factors. An evaluation of default hypotheses using the Bayes factor should lead to a report containing four items:
A definition of well-calibrated inference should be given. There may be more than one alternative for the definition of well-calibrated used in the current paper, especially in the context of statistical models that contain many instead of a single target parameter.
Information as displayed in Figures and that is used to obtain well-calibrated prior distributions.
The strength of evidence quantified using information like in .
The Bayes factors obtained from an empirical data set evaluated in the light of the information contained in the first three items.
The development of a well-founded approach for Bayesian hypothesis evaluation is far from completed. For each new application a four-step report as described in the previous paragraph will have to be constructed. This opens up a new research area for Bayesian psychologist that will continue to exist until well-founded agreed-upon generally applicable approaches have been developed. Only if this research area is properly explored, Bayesian psychologists will be able to add a valuable new approach to the toolkit of research psychologists.
Epilogue
In the current paper four Bayes factors comparing “psi” and “no psi” hypotheses were computed. It started with Bayes factors of 3.79 and 2.10 in favor of psi. It continued with a Bayes factor of 5.27 based on calibrated prior distributions and ended with a Bayes factor of 8.33 based on subjective prior distributions. These values constitute evidence in favor of “psi.” However, these results should not be taken as support for the existence of psi. There are other aspects of the analyses executed by Bem (Citation2011) that have been criticized. The interested reader is referred to Wagenmakers et al. (Citation2011) and Rouder and Morey (Citation2011) who discuss the implications of evaluating many instead of one experiment using the Bayes factor, and, above all, Ritchie, Wiseman, and French (Citation2012) who were not able to replicate the results presented in Bem (Citation2011).
Related Research Data
References
- Bem, D. J. (2011). Feeling the future: Experimental evidence for anomalous retroactive influences on cognition and affect. Journal of Personality and Social Psychology, 100, 407–425. doi: 10.1037/a0021524
- Bem, D. J., Utts, J., & Wesley, J. O. (2011). Must psychologists change the way they analyze their data? Journal of Personality and Social Psychology, 101, 716–719. doi: 10.1037/a0024777
- Hoijtink, H. (2012). Informative Hypotheses: Theory and Practice for Behavioral and Social Scientists. Boca Raton, FL: Chapman and Hall/CRC.
- Jeffreys, H. (1961). Theory of Probability (3rd ed.). Oxford: Oxford University.
- Kass, R. E., & Raftery, A. E. (1995). Bayes factors. Journal of the American Statistical Association, 90, 773–795. doi: 10.1080/01621459.1995.10476572
- Liang, F., Paulo, R., Molina, G., Clyde, M., & Berger, J. (2008). Mixtures of g priors for Bayesian variable selection. Journal of the American Statistical Association, 103, 410–423. doi: 10.1198/016214507000001337
- Mulder, J., Hoijtink, H., & de Leeuw, C. (2012). BIEMS, a Fortran90 program for calculating Bayes factors for inequality and equality constrained models. Journal of Statistical Software, 46, 2. doi: 10.18637/jss.v046.i02
- O’Hagan, A. (1995). Fractional Bayes factors for model comparisons (with discussion). Journal of the Royal Statistical Society, Series B, 57, 99–138.
- O’Hagan, A., Buck, C. E., Daneshkhah, A., Eiser, J. R., Garthwaithe, P. H., Jenkinson, D. J., Oakley, J. E., & Rakow, T. (2006). Uncertain Judgements. Eliciting Experts’ Probabilities. Chichester: Wiley.
- Ritchie, S. J., Wiseman, R., & French, C. C. (2012). Failing the future: Three unsuccessful attempts to replicate Bem’s ‘retroactive facilitation of recall’ effect. Plos One, 7. doi: 10.1371/journal.pone.0033423
- Robert, C. P., Chopin, N., & Rousseau, J. (2009). Harold Jeffreys’s theory of probability revisited. Statistical Science, 2, 141–172. doi: 10.1214/09-STS284
- Rosnow, R., & Rosenthal, R. (1989). Statistical procedures and the justification of knowledge in psychological science. American Psychologist, 44, 1276–1284. doi: 10.1037/0003-066X.44.10.1276
- Rouder, J. N., Speckman, P. L., Sun, D., Morey, R. D., & Iverson, G. (2009). Bayesian t tests for accepting and rejecting the null hypothesis. Psychonomic Bulletin and Review, 16, 225–237. doi: 103758/PBR.16.2.225
- Rouder, J. N., & Morey, R. D. (2011). A Bayes factor meta-analysis of Bem’s ESP claim. Psychonomic Bulletin and Review, 18, 682–698. doi: 10.3758/s13423-011-0088-7
- Savage, L. J. (1961). The foundations of statistical inference reconsidered. In J. Neyman, (Ed.), Proceedings of the Fourth Berkeley Symposium on Mathematical Statistics and Probability, Volume 1: Contributions to the Theory of Statistics, pp. 575–586. BerkeleyCA: University of California.
- Trafimow, D. (2003). Hypothesis testing and theory evaluation at the boundaries: Surprising insights from Bayes’s theorem. Psychological Review, 3, 526–535. doi: 10.1037/0033-295X.110.3.526
- Wagenmakers, E. J. (2007). A practical solution to the pervasive problems of p values. Psychonomic Bulletin and Review, 14, 779–804. doi: 10.3758/bf03194105
- Wagenmakers, E. J., Wetzels, R., Borsboom, D., & Van der Maas, H. L. (2011). Why psychologists must change the way they analyze their data: The case of psi. [Commentary on Bem (2011)]. Journal of Personality and Social Psychology, 100, 426–432. doi: 10.1037/a0022790
- Wetzels, R., Matzke, D., Lee, M. D., Rouder, J. N., Iverson, G. J., & (2011). Statistical evidence in experimental psychology: An empirical comparison using 855 t tests. Perspectives on Psychological Science, 6, 291–298. doi: 10.1177/1745691611406923