
 ?Mathematical formulae have been encoded as MathML and are displayed in this HTML version using MathJax in order to improve their display. Uncheck the box to turn MathJax off. This feature requires Javascript. Click on a formula to zoom.
Abstract
Careless responding by mental health patients on self-report assessments is rarely investigated in routine care despite the potential for serious consequences such as faulty clinical decisions. We investigated validity indices most appropriate for detecting careless responding in routine outcome monitoring (ROM) in mental health-care. First, we reviewed indices proposed in previous research for their suitability in ROM. Next, we evaluated six selected indices using data of the Brief Symptom Inventory and the Mood and Anxiety Symptom Questionnaire from 3,483 outpatients. Simulations showed that for typical ROM scales the index, Mahalanobis distance, and inter-item standard deviation may be too strongly confounded with the latent trait value to compare careless responding across patients with different symptom severity. Application of two different classification methods to the validity indices did not converge in similar prevalence estimates of careless responding. Finally, results suggest that careless responding does not have a substantial biasing effect on scale-score statistics. We recommend the
person-fit index to screen for random careless responding in large ROM data sets. However, additional research should further investigate methods for detecting repetitive responding in typical ROM data and assess whether there are specific circumstances in which simpler validity statistics or direct screening methods perform similarly as the
index.
Introduction
There is growing interest in routinely monitoring clients’ progress during psychiatric or psychological treatment, termed routine outcome monitoring (ROM; de Beurs et al., Citation2011). ROM has been implemented in many countries and in many different mental health care settings (Carlier & van Eeden, Citation2017; Trauer, Citation2010). It can provide feedback to clinicians and to clients themselves on how clients fare during treatment. Such feedback may improve clinical judgment and may allow for better decision-making regarding the clinical course of the therapy. Furthermore, ROM data in aggregated form (e.g., aggregated over groups of clients, departments, or institutions) may provide managers and policy makers with salient information about the effectiveness of health care that is offered (Barendregt, Citation2015; Trauer, Citation2010). ROM data are collected using clinician-rated scales and self-report instruments that assess clients’ psychological problems and symptoms of psychopathology. Often a combination of generic and disorder-specific scales is used. Some mental health care institutions use a battery of instruments at intake and during (e.g., every 6 weeks or 3 months) and after treatment, whereas others use fewer scales at more frequent intervals (de Beurs et al., Citation2011).
When using self-report instruments, the underlying assumption is that respondents answer the questions as truthfully and accurately as possible. Regarding ROM, Boswell, Kraus, Miller, and Lambert (Citation2015) stated that “these systems and their usefulness in treatment are predicated on accurate self-reporting of levels of disturbance and corresponding changes” (p. 12). Unfortunately, this accuracy occasionally may be compromised. For example, some patients may intentionally over-report their symptoms, whereas others may underreport their symptoms (Ben-Porath, Citation2013). These content-based invalid response styles and their effects have been studied extensively (Ingram & Ternes, Citation2016).
In this study, we focus on careless responding (e.g., Meade & Craig, Citation2012), also called “insufficient effort responding” (Huang, Liu, & Bowling, Citation2015). Careless responding refers to answering items without sufficiently considering item content or item instructions. As careless respondents are not purposefully manipulating their answers, careless responding is a noncontent-based response style (McGrath, Mitchell, Kim, & Hough, Citation2010). Recently, several studies have shown that noncontent-based response styles may be prevalent in mental health care patients because the cognitive problems of psychopathology may induce patients to satisfice (i.e., to provide nonoptimal responses) to questionnaires (Conijn, van der Ark, & Spinhoven, Citation2017; Gervais et al., Citation2017; Keeley, Webb, Peterson, Roussin, & Flanagan, Citation2016). Especially on longer instruments, extensive assessment batteries, or repeated assessments, mental health care patients may become tired and lose concentration or motivation. Research suggests that this may induce two different types of careless responding, including random careless responding and repetitive careless responding (e.g., Kam & Chan, Citation2018; Meade & Craig, Citation2012). Random careless responders tend to respond in an unsystematic manner, while repetitive careless responders tend to repeat the same answer regardless of item content. Respondents may show varying degrees of careless responding, ranging from completely random or repetitive item-score patterns to “nonoptimal” response patterns with only some degree of unsystematic or repetitive responses (Krosnick, Citation1991).
The consequences of careless responding (and invalid response styles in general) in clinical practice are described in Armistead-Jehle and Green’s (Citation2016) model and include first order (e.g., faulty diagnosis decisions), second order (e.g., poor treatment outcomes), and third order effects (e.g., societal financial costs). Although no studies have assessed the possible negative effects of careless responding in ROM on these levels, ample studies in various other settings (e.g., employee job satisfaction, educational intervention study) have assessed the effects of careless responding on research results. Most studies concluded that careless responding can substantially bias results, such as estimated group differences in mean scores, bivariate correlations, and reliability coefficients (e.g., Burchett et al., Citation2016; Holtzman & Donnellan, Citation2017; Huang, Liu et al., Citation2015; Kam & Meyer; 2015; McGonagle, Huang, & Walsh, Citation2016; Osborne & Blanchard, Citation2011). Other studies found only small (or no) effects of removing careless respondents on the factor structure of questionnaire data, criterion test validity, bivariate correlations or Cronbach’s alpha (Conijn, Emons, & Sijtsma, Citation2014; Meijer, Citation1997; Widhiarso & Sumintono, Citation2016; Zijlstra, van der Ark, & Sijtsma, Citation2011). The varying effects of carelessness are likely to be a result of the different psychometric aspects evaluated, the type of careless response strategy, the prevalence of aberrant responding, the study design (simulated vs. real data), and the method used to detect careless respondents. The varying effects also imply that the effect of careless responding needs to be investigated in specific settings.
Methods for detecting careless responding
Some popular clinical test batteries, such as the Personality Assessment Inventory (PAI; Morey, Citation1991) and the Minnesota Multiphasic Personality Inventory-2 (MMPI-2; Butcher, Dahlstrom, Graham, Tellegen, & Kaemmer, Citation1989), include questionnaire-specific scales to detect random responding (e.g., the Variable Response Inconsistency scale; Handel, Ben-Porath, Tellegen, & Archer, Citation2010). However, ROM systems rarely include validity checks, and therefore a general (instead of a questionnaire-specific) approach to detect careless responding is required. Most approaches to detect careless responding originate from survey methodology and can be divided in two main groups: direct (or item-based) screening methods and statistical (or post hoc) screening methods (DeSimone, Harms, & DeSimone, Citation2015; Meade & Craig, Citation2012).
In direct screening methods, items (or even whole scales) are added to a questionnaire to detect careless responses. For example, researchers can ask participants to estimate how reliable their answers are (Meade & Craig, Citation2012). Researchers can also deliberately include items that every conscientious responder either should or should not endorse (Fervaha & Remington, Citation2013). Direct screening methods have been shown to be effective (e.g., Huang, Bowling, Liu, & Li, Citation2015; Kam & Chan, Citation2018; Meade & Craig, Citation2012), but they increase test length and may lead respondents to feel that their answers are not trusted or taken seriously. The latter is especially problematic in routine mental health care practice, where direct screening methods may negatively influence patient’s treatment motivation.
Alternatives to direct screening methods are statistical post hoc indices that detect careless responding by quantifying how unusual or inconsistent a response pattern is. The performance of these validity indices has been investigated by means of simulation studies and experimental research (e.g., Huang, Curran, Keeney, Poposki, & DeShon, Citation2012; Meade & Craig, Citation2012; Niessen, Meijer, & Tendeiro, Citation2016). However, most research on these indices has been done in the context of personality research (Emons, Citation2008; Huang et al., Citation2012; Meade & Craig, Citation2012; Niessen et al., Citation2016). The indices found suitable for personality data, such as long string indices, item response theory (IRT)-based person-fit indices (Meijer, Niessen, & Tendeiro, Citation2016) or the Mahalanobis distance, may not necessarily be suitable for typical ROM data. Psychopathology measures are characterized by skewed item-score data, items worded in the same direction, and subscale data that do not fit unidimensional IRT models well (Reise & Waller, Citation2009; Thomas, Citation2011).
To assess the suitability of different validity checks in ROM, two important issues also need to be addressed. First, a method for categorizing respondents as careless versus noncareless should be chosen. A categorization method is required to inform clinicians at what value of a validity index, the patients’ test score is likely to be invalid, and to inform data analysts of aggregated ROM data at which cutoff value a response pattern should be excluded from the analyses. Currently it is unclear how to best determine cutoff values for post hoc indices (DeSimone et al., Citation2015; Niessen et al., Citation2016), but two different methods have been suggested. First, IRT-based Monte Carlo simulations can generate null distributions—the distribution of the index in a clean data set—for a validity index, and cutoff values can be computed based on these distributions and a desired Type I error rate (e.g., Emons, Citation2008; Seo & Weiss, Citation2013; Sinharay, Citation2017). Although most often used, the drawback of this method is that its suitability may depend on the fit of the estimated IRT model to the data. Second, Tukey’s fences method, also known as the boxplot method, can be used to identify respondents with outlying values on the validity indices (Zijlstra, van der Ark, & Sijtsma, Citation2007). This method is relatively easy because the cutoff value solely depends on the observed distribution of the statistic and does not require the use of IRT. To our knowledge, no study has assessed whether these two methods for categorizing respondents provide consistent results.
Second, it should be investigated to what extent the null distributions of different validity indices are confounded by the respondent’s trait level (Emons, Citation2008). A strong relation between trait level and a validity index’s null distribution is problematic for two reasons. First, in that case, the probability of incorrectly being categorized as careless depends on the respondent’s level of symptom severity. Consequently, excluding careless respondents based on a common cutoff may lead to selection bias by excluding respondents with most severe psychopathology (Roivainen, Veijola, & Miettunen, Citation2016). Second, appropriate cutoff values (e.g., the 95th percentile derived from a simulated null distribution) may vary across different patient samples depending on the symptom severity in the sample. Consequently, one cannot meaningfully compare prevalence estimates based on the same cutoff value between subgroups with different average symptom severity levels; variation in prevalence may be due to differences in symptom severity instead of differences in careless responding. For individual decision-making, a similar problem exists: cutoff values may be more or less suitable for a patient, depending on his or her latent trait level.
Study aim
To summarize, recent research has concluded that screening for careless responding should be common practice and that the consequences of careless responding are underestimated (e.g., Curran, Citation2016; Godinho, Kushnir, & Cunningham, Citation2016; McGonagle et al., Citation2016; Osborne & Blanchard, Citation2011). Screening for careless responding in ROM can improve diagnosis and treatment decisions of individual patients, and improve decision-making by managers and policy makers based on aggregated ROM data.
In the first part of this article, we use previous research results to discuss the suitability of various post hoc validity indices for detecting careless responding in typical ROM data. In the second part of this article, using six selected validity indices, we address three research questions using simulated data and empirical ROM data of 3543 psychiatric outpatients. Addressing these questions is fundamental for selecting appropriate validity checks for use in ROM and for assessing the necessity of such checks in the analyses of aggregated ROM data.
To what extent are the validity index values in clean data confounded with the latent trait value measured by the scale?
What is the effect of different categorization methods on prevalence estimates?
To what extent does careless responding affect means and standard deviations of scale scores in aggregated ROM data?
Post hoc validity indices in ROM
Below, we review eight post hoc validity indices that have been most often applied in recent studies (e.g., Godinho et al., Citation2016; Kam & Meyer, Citation2015; Marjanovic, Holden, Struthers, Cribbie, & Greenglass, Citation2015; Meade & Craig, Citation2012; Niessen et al., Citation2016), and discuss their suitability given typical ROM data properties (for a more general discussion of validity indices, see Curran, Citation2016). The typical ROM data properties include the following. Most of the ROMs are characterized by multiple short subscales assessing different dimensions of psychopathology and skewed item-score data (i.e., skewed in the direction of stronger symptoms) (e.g., Reise & Waller, Citation2009). Examples of frequently used ROM scales and test batteries include the Brief Symptom Inventory (BSI; Derogatis & Melisaratos, Citation1983) including 54 items and 9 subscales, the Outcome Questionnaire 45 (OQ-45; Lambert et al., Citation2004) including 45 items and 3 subscales, and the Treatment Outcome Package (TOP; Boswell, Kraus, Castonguay, & Youn, Citation2015) including 93 items and 11 subscales. Also, even though the ROM instruments measure different dimensions, the traits measured by various subscales are often strongly related (e.g., Caspi et al., Citation2014; Urbán et al., Citation2014), and items are often worded in the same direction (i.e., indicative of psychopathology). The subscale data designed to assess a single dimension are commonly not well-described by unidimensional factor models or IRT models (e.g., Thomas, Citation2011). Finally, although not previously investigated, we expect ROM data to mainly include mild careless responding (i.e., instead of fully random or repetitive patterns) and a relative low prevalence of careless respondents (<10%), as patients have self interest in accurately completing the ROM.
Inconsistency indices
Indices to detect inconsistent or random careless responding are the statistical synonyms and antonyms indices, the even-odd consistency (EO) index, and the inter-item standard deviation (ISD) index. To compute the statistical synonyms and antonyms indices (e.g., Johnson, Citation2005; Meade & Craig, Citation2012), pairs of items that are strongly correlated (r=|.60| is a commonly used cutoff) are selected. Next, the within-person correlation between the synonymous pairs and the antonymous pairs is calculated, resulting in two indices. For computing the EO index, all unidimensional subscales are divided into an even and odd part (i.e., the even-numbered items and the odd-numbered items), and for every even- and odd-scale the person’s score is calculated (e.g., Johnson, Citation2005). Then, the correlation between the even- and odd-averages is calculated and corrected for test-length using the Spearman–Brown prophesy formula. Both the statistical synonyms and antonyms indices and the EO index are unlikely to be suitable for application in ROM. The statistical synonym/antonym indices require a large number of item pairs to render the indices reliable, as the number of item pairs is the sample size for computing the correlation coefficient (Meade & Craig, Citation2012; Niessen et al., Citation2016). ROM scales usually include no more than 100 items, resulting in a maximum number of 50 pairs. Similarly, the EO index is only reliable when data of a large number of subscales is available, as the number of subscales consitutes the sample size (Niessen et al., Citation2016; Meade & Craig, Citation2012). Another drawback of the EO index for ROM data is that it can detect fully random response patterns but performs poorly in detecting partial careless responding (Meade & Craig, Citation2012).
The ISD index is the standard deviation of a respondent’s item scores on a unidimensional subscale (Marjanovic, Holden, Struthers, Cribbie, & Greenglass, Citation2015). Despite the simplicity of the index, Marjanovic et al. (Citation2015) found that this measure could distinguish completely random response patterns from nonrandom response patterns on a 60-item personality inventory, and Franz (2016) found that the index could detect response patterns with at least 25% random item scores on a test battery of 261 items, with high sensitivity and specificity. However, other studies suggested that the ISD index should be used with caution and its value may be strongly confounded with the substantive trait measured (Curran, Citation2016; Golay, Fagot, & Lecerf, Citation2013).
Long string index
Repetitive careless responding can be detected by determining the length of strings of identical answers (Curran, Citation2016; DeSimone et al., Citation2015; Johnson, Citation2005). The index is the maximum length of a string of consecutive identical answers. Some researchers have computed
as the maximum length of a string on single web or questionnaire page (Meade & Craig, Citation2012); others have computed its value across the complete questionnaire (Kam & Chan, Citation2018; Niessen et al., Citation2016).
is most appropriate for multidimensional questionnaires with a mixture of differently scored items (i.e., scored either positively or negatively), and many response categories (DeSimone et al., Citation2015). Such scale characteristics reduce the possibility that a conscientious respondent produces long strings. For ROM scales, long string indices may have limited value as many of such scales assess highly related dimensions and items are often scored in a single direction.
Multivariate outlier index
The Mahanalobis distance (MD) is a multivariate outlier statistic (e.g., Johnson & Wichern, Citation2008) that quantifies the distance between a respondent’s item-score pattern and the mean item scores in the remaining data, while taking into account inter-item correlations. Several (simulation) studies have recommended this index for detecting random careless responding (e.g., Meade & Craig, Citation2012; Maniaci & Rogge, Citation2014; DeSimone et al., Citation2015). A potential disadvantage of this index is that it may also detect persons with extreme trait values, whereas an extreme trait value does not necessary imply careless responding.
Person-fit indices
 index
index
The parametric person-fit index for polytomous items (Drasgow, Levine, & Williams, Citation1985) is the standardized log-likelihood of a response pattern given the estimated unidimensional IRT model. The
index mainly detects random careless responding but also has the potential to pick up other types of carelessness if these lead to inconsistencies with the IRT model (Emons, Citation2008). Disadvantages of the
index are that large samples are required to accurately estimate IRT models for polytomous data. Also, IRT item parameters may be biased due to the misfit commonly observed between psychopathology data and unidimensional IRT models (Thomas, Citation2011). On the other hand, simulation studies suggest that sensitivity and specificity of
is not affected much by parameter bias or violations of unidimensionality (Conijn et al., Citation2014, Citation2015). Therefore, the
index may be appropriate for application to ROM data, despite some possible misfit between the estimated IRT model and the observed data.
and indices
The nonparametric Guttman statistic, , is the sum of the number of Guttman errors in a response pattern (Emons, Citation2008; Guttman, Citation1950). The
index weights the number of errors (i.e.,
) by the maximum number of errors for the total score of the corresponding response pattern (Emons, Citation2008). For items with a polytomous response format, a Guttman error occurs when a respondent endorses a less popular item category (i.e., indicative of high symptom severity) without endorsing a more popular one (i.e., indicative of low symptom severity). Item popularity is based on the average category endorsement rates in the sample.
and
are highly related to
(e.g., Niessen et al., Citation2016) and are also mostly sensitive to careless responding that leads to response inconsistencies, such as random responding. Comparing
and
,
has the advantage of being less confounded with the respondents’ trait value but
has the advantage of higher detection rates for random careless responding (Emons, Citation2008; Franz, Citation2016).
Comparison studies
Two recent studies conducted a comprehensive comparison of post hoc validity indices, including also person-fit indices. In the first study, Franz (Citation2016) used item parameters of three different psychopathology scales (resulting in a total of 261 items) to generate data using IRT models, and compared detection rates of 11 statistics. Results showed that for detecting severe random careless responding (e.g., response patterns including 50% random responses), ,
,
, MD, and ISD all had very high sensitivity and specificity values. For detecting less severe random carelessness (e.g., 25% random responses),
performed best, MD,
, and
performed quite similarly, while ISD performed somewhat more poorly. The EO and the statistical synonyms and antonyms indices performed poorly in all conditions.
performed best in detecting repetitive responding, with high sensitivity and specificity for detecting severe repetitive responding. In the second study, Niessen et al. (Citation2016) compared the performance of
,
,
, EO, and MD using data of a 100-item big five inventory using both an experiment (respondents were instructed to respond carelessly) and a simulation study (partial random response patterns were inserted in real data). Results were largely consistent with those of Franz (Citation2016): EO was outperformed by all indices; the MD index was outperformed by
and
particularly when the prevalence of careless responding was low (5–10%) and data included only mild types of carelessness. A comparison of
and
showed that detection rates were either comparable (in the experimental study) or somewhat higher for
(simulation study). In the experimental study, the
index had detection rates that were similar to those of
and
Given the expected low prevalence and mild types of carelessness in ROM data, these two studies suggest that person-fit indices may have best performance for detecting random careless responding in ROM data, and that the EO and statistical synonyms and antonyms indices are least useful. Furthermore, the two studies suggest that the index may also perform well in detecting repetitive careless responding. However, both studies are not representative for typical ROM data, for example, Franz (Citation2016) used a very large amount of items and Niessen et al. (Citation2016) used data of a personality inventory.
Method
Participants and procedure
We used secondary data from ROM baseline measurements from outpatients referred to the Department of Psychiatry of the Leiden University Medical Center (LUMC) and to the Regional Mental Health Care Provider GGZ Rivierduinen for treatment of mood, anxiety, and/or somatoform disorders. Patients with insufficient command of the Dutch language, who were illiterate, or who suffered from serious cognitive impairments were excluded from the ROM procedure. Because ROM is considered an integral part of the treatment process, no written informed consent of patients is required, and anonymized ROM data can be used for scientific purposes (LUMC Ethics approval).
The standard ROM baseline assessment included a structured diagnostic interview (Mini-International Neuropsychiatric Interview Plus; Sheehan et al., Citation1998) and several observer-rated and self-report instruments (de Beurs et al., Citation2011). Additionally, demographic data were collected, such as housing situation, employment status, and nationality. The data were collected using touch-screen computers, showing one item at a time on a screen, and items of different subscales of a single questionnaire were shown in mixed order. The ROM baseline session, including the MINI-plus interview, took 1–2 h. For more details on ROM, see de Beurs et al. (Citation2011).
In the current study, we included the anonymized data of 3,543 psychiatric outpatients, who had their baseline ROM measurement between 2005 and 2009 and who completed the BSI (Derogatis & Melisaratos, Citation1983) and the Mood and Anxiety Symptoms Questionnaire (MASQ; Watson et al., Citation1995). We excluded 60 patients (1.6%) who had missing item score values, so our final sample consisted of 3,483 patients (64.6% woman), with ages ranging from 17 to 91 years (Mage=39.0, SD = 12.7). Of these patients, 7.6% completed primary education, 29.4% lower secondary education, 34.6% higher secondary education, and 17.7% higher professional or university education. Diagnosis and ethnicity information was available for a subsample (n = 2,026). In this sample, 9.6% of the patients were of nonDutch ethnic origin, and the percentages in different diagnostic categories were as follows: pure depression or dysthymia (31.6%); pure anxiety disorder (10.2%); pure somatoform disorder (3.5%); comorbid anxiety, depression, or somatoform disorder (37.3%); and other disorders (17.5%).
Measurement instruments
From the many ROM self-report instruments used in the assessment, we selected the BSI and the MASQ because they were completed by a large part of the sample and because they are often used in ROM procedures (Carlier & van Eeden, Citation2017). The BSI is a shortened version of the Symptom Checklist (SCL-90) and consists of 53 items. Of the 53 items, four items are used as independent clinical indicators. The remaining 49 items are assigned to one of nine subscales consisting of four to seven items each: somatization, obsessive–compulsive, interpersonal sensitivity, depression, anxiety, hostility, paranoid ideation, psychoticism, and phobic anxiety (de Beurs & Zitman, Citation2006; Derogatis & Melisaratos, Citation1983). Respondents indicate how much a problem bothered or distressed them during the past week on a five-point Likert scale ranging from 0 (not at all) to 4 (extremely). The total sore on the BSI reflects the degree of general psychopathology (de Beurs, den Hollander-Gijsman, Helmich, & Zitman, Citation2007). Some research found support for the theoretical nine-factor structure (de Beurs & Zitman, Citation2006; Derogatis and Melisaratos, Citation1983) but more recent studies found support for a bi-factor model suggesting a strong general dimension underlying all items (Thomas, Citation2012; Urbán et al., Citation2014). In the current study, the Cronbachs’ alpha value for the psychoticism subscale equaled .71 but was at least .80 for the other subscales. Correlations between subscale total scores ranged from .41 to .85.
The MASQ was developed as an instrument to measure anxiety- and mood-disorder symptoms, following the tripartite model of anxiety and depression (Watson et al., Citation1995). In the present study, we used the Dutch adaptation of the MASQ (de Beurs et al., Citation2007), which consists of 90 items asking about symptoms of depression and anxiety using a five-point Likert scale ranging from 1 (not at all) to 5 (extremely). Of these 90 items, 14 items are used as independent clinical indicators. The other 76 items are assigned to one of three main subscales: Anhedonic Depression (AD; 22 items), Anxious Arousal (AA; 17 items), and General Distress (GD; 37 items). GD is further divided into three specific subscales: General Distress Depression (GDD; 12 items), General Distress Anxiety (GDA; 11 items), and General Distress Mixed (GDM; 14 items). Fifteen of the MASQ items, nearly all of which belong to the AD subscale, describe positive feelings and are reverse scored.
Research results on the factor structure of the MASQ generally support the three main scales, but there is limited support for the three GD subscales (e.g., de Beurs et al., Citation2007; Watson et al., Citation1995). Another study showed neither support for the three-factor nor the five-factor solution and suggested that alternative measures should be used for measuring anxiety and depression (Boschen & Oei, Citation2006). Research shows sufficient evidence for the reliability and validity of the Dutch MASQ (de Beurs et al., Citation2007). In our study, Cronbach’s alpha values for the subscale scores ranged from .86 to .95. Correlations between subscale total scores ranged from .48 to .78.
Validity indices
We applied validity indices separately to the BSI and the MASQ. We used all indices reviewed in the “Post hoc validity indices in ROM” section, apart from the statistical synonyms and antonyms indices and the OE index. These indices were excluded because (1) the number of subscales and synonym/antonym item pairs in the MASQ and BSI were too low for a reliable detection of (partial) careless response patterns, and (2) simulation studies showed poor performance compared to the other validity indices (see “Post hoc validity indices in ROM” for more elaborate explanations).
Computation
was computed as the maximum length of a string of consecutive identical answers across the complete questionnaire. We could not compute
for separate webpages (Meade & Craig, Citation2012) because only one item was shown on a screen.
was based on the original item-scores; the other indices were computed after recoding the negatively worded MASQ items. The validity indices requiring unidimensional data (ISD,
,
, and
) were first computed for each subscale and next averaged into an overall multiscale validity index. For the person-fit indices, this approach corresponds to computing multiscale person-fit statistics (e.g., Conijn et al., Citation2014; Niessen et al., Citation2016). Although the MD index does not assume unidimensionality, it is computationally intensive when applied to many items and therefore the same multiscale approach was taken (Meade & Craig, Citation2012; Zijlstra et al., Citation2011). In calculating the ISD,
,
,
and MD indices, we did not include the four BSI items and the 13 MASQ items that did not belong to a subscale (see “Measures” section). Consistent with previous studies, the
index was computed with respect to the graded response IRT model (GRM) (e.g., Wanders, Wardenaar, Penninx, Meijer, & de Jonge, Citation2015; Wardenaar et al., Citation2015). Apart from the
index, all validity indices could be interpreted such that higher positive values indicate more careless responding. We therefore multiplied
by −1 so that a higher value was indicative of more careless responding.
Simulated null distribution for the indices
We simulated null distributions for the validity indices (i.e., their distribution in clean data without careless responding) for two purposes: assess how the indices relate to the total scale score in clean data (i.e., RQ1) and to derive the cutoff values for categorizing respondents as careless (i.e., RQ2, see the “Classification methods” section). To simulate null distributions, we generated BSI and MASQ subscale data based on various unidimensional and multidimensional GRMs that were estimated using the real BSI and MASQ data. For items with five ordered categories, as is the case for all BSI and MASQ items, the unidimensional GRM describes each item by four category-threshold parameters (β1–β4), indicating the popularity of a response category, plus one discrimination parameter (α). The GRM estimates a single latent trait value for each respondent (e.g., depression symptom severity on the BSI depression subscale). The multidimensional GRM (e.g., Reckase, Citation2009) extends the unidimensional GRM by positing multiple latent traits and multiple corresponding discrimination parameters.
To obtain a null distribution for the index, we needed to produce data for all items, not only those belonging to a subscale. The BSI and MASQ included four and 14 items, respectively, that did not belong to any subscale. Therefore, we assessed with which subscale total score these “single” items correlated the highest and then attributed each item to the appropriate subscale. These correlations ranged from .27 to .69. One of the single MASQ items (Item 32) did not correlate substantially with any subscale (r<.10) and was therefore excluded.
The first step of our null-distribution simulations was to assess dimensionality for each of these “extended” subscales. We used the nfactors R package (Raiche, Citation2010) to assess dimensionality of the subscale data by means of three different approaches: the number of eigenvalues >1, parallel analysis, and a visual inspection of the scree plot. When methods provided a different number of factors, we chose the larger number to minimize the risk of missing important factors. Results of the three different approaches showed that the BSI scales could be well-described by a single factor. The MASQ subscales were dominated by either two dimensions (AD or AA) or three dimensions (GDD, GDA, and GDM), see Supplementary data, Appendix A.
The second step was to estimate either a unidimensional GRM or a multidimensional exploratory GRM for each of the subscales using the mirt R package (Chalmers, 2012) and results of the dimensionality analyses. The Metropolis–Hastings Robbins–Monro algorithm was used for parameter estimation because it has been found to perform well for both unidimensional and multidimensional exploratory IRT models (Cai, Citation2010). Supplementary data, Appendix A provides model and item-fit indices for the estimated (M)IRT models.
In the last step, we used the estimated (M)IRT models to generate 200 replicated clean data sets (i.e., without careless responses) of N = 5,000 each. For every simulated participant, trait values per subscale were drawn from a multivariate normal distribution using the covariances between the trait estimates derived from the ROM data (Supplementary data, Appendix B provides results on a comparison between the real BSI and MASQ data and the simulated data). Finally, we computed the validity index values for each simulated data set, resulting in 200 replicated null distributions for each index. Note that we used multidimensional models to produce MASQ subscale data but we applied validity indices designed for unidimensional data (i.e., the person-fit indices and the ISD index) to the subscale data. We followed this procedure to obtain representative results, as model-data misfit can be expected in practice.
Classification methods
The first method used the null distribution of the validity indices (e.g., Seo & Weiss, Citation2013; Sinharay, Citation2017) and nominal Type I error levels of .01 and .05 (e.g., Meijer et al., Citation2016; Wanders et al., Citation2017). Specifically, for each of the 200 simulated data sets of n = 5,000, we computed the 99th and 95th percentile values of each validity index and averaged these values into two single cutoff values for each index. We classified respondents with a validity index value larger than the cutoff value as being careless.
The second classification method was based on Tukey’s fences (Tukey, Citation1977, pp. 43–44; also known as the boxplot method) and followed Zijlstra et al. (Citation2007). Classification of respondents was based on percentile values in the observed distribution of the validity index values: the 25th percentile value (i.e., Q1), the 75th percentile value (i.e., Q3), and the interquartile range (IQR; computed as Q3 − Q1). We classified respondents with a validity index value larger than Q3 + 1.5 IQR as careless respondents.
Main analyses
To address our first goal, we used the first simulated clean data set (n = 5000), to graphically assess the relation between the total scores on the MASQ and BSI and the validity index values. To assess the extent that a Type I error depends on the person’s latent trait value we plotted the cutoff values derived from the three categorization methods. Next, we applied the validity indices to the real BSI and MASQ data, inspected the distribution of the indices and the relations between indices. To address our second goal, we compared the estimated prevalence of careless responding (i.e., number of respondents classified as careless divided by the total number of respondents) in the BSI and MASQ data based on the two different methods of classification. To address our third goal, we assessed the effect of removing respondents classified as careless from the real ROM data on the means and standard deviations of the BSI and MASQ (sub)scale scores. The (sub)scale scores were computed as the average of the subscales’ item scores (ranging from 1 to 5). We chose to use this method to compute (sub)scale scores because it allowed for a straightforward comparison of the bias across scales with a different number of items.
Results
Relation with total score
and show the relation between the validity index values and the total BSI and MASQ score, respectively, in simulated data without careless respondents. Cutoff values based on the simulated 95th and 99th percentile and on Tukey’s fences are represented with horizontal lines. The figures show that values depend (strongly) on the BSI and the MASQ scale scores, respectively. The Type I errors mainly concern respondents with low trait values. The shape of the distribution suggests that appropriate cutoff values depend on the samples’ symptom severity. Lower values are needed in samples with higher symptom severity and higher values are needed in samples with low symptom severity. For the ISD index, the distribution also depends strongly on the BSI and MASQ scale scores. Type I errors mainly concern respondents with moderate trait values. Furthermore, the distribution suggests that in samples with more extreme (either high or low) symptom severity lower cutoff values are needed compared to samples with moderate symptom severity. For the MD index, the shape of the distribution differs across the BSI and the MASQ data. The bivariate distribution of MD is not problematic for the MASQ but for the BSI, the relation is strongly positive and Type I errors only occur for respondents with moderate to high trait values. The
index has distributions similar to that of the ISD index but the relationships are weaker. For
and
, the relations with the scales scores were relatively weak. For
, Type I errors do not occur for a particular trait values. For
, Type I errors in the MASQ data occur mainly for persons with low trait values but Type I errors in the BSI data are rather constant across scale values.
Figure 1. Scatterplots indicating the relation between the total score and the validity indices in simulated clean BSI data.
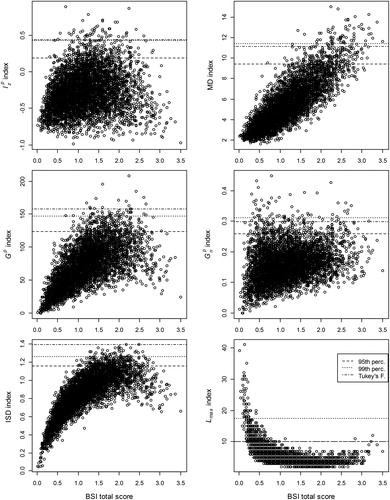
Figure 2. Scatterplots indicating the relation between the total score and validity indices in simulated clean MASQ data.
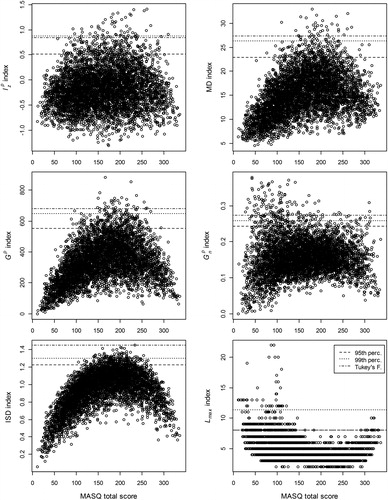
To summarize, the distribution of ISD, MD and values were most strongly confounded with the trait values, particularly for the BSI. The bivariate distribution of the
,
and
indices with the scale scores seem more favorable for making fair classification decisions based on common cutoff values. However, of these three person-fit indices, only for the
index, the probability of a Type I error was (rather) constant across scales scores for both the BSI and MASQ.
Prevalence and classifications
Descriptive statistics
We applied the indices to the real BSI and MASQ data. shows the rank order correlations. The ISD, MD, ,
and
indices were highly interrelated (.53–.93). The shape of the relations between the validity indices and the total scores was similar to those in the simulated clean data ( and ). The main differences between the real data and simulated clean data were a stronger positive linear relation between the total MASQ score and the
,
and MD indices in the real data, and a weaker linear negative relation between the total score and
index in both the BSI and MASQ real data. Considering that
, ISD and MD were highly intercorrelated () and that
was least confounded with the respondents’ trait level ( and ), we excluded the ISD and MD indices from further analyses.
Table 1. Spearman’s rho correlation between validity indices and with total score in real BSI and MASQ data.
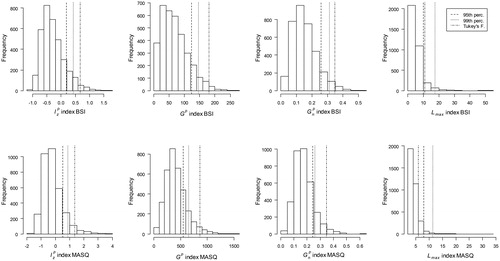
shows the distributions of the remaining statistics. The three lines indicate the cutoff values according to the simulated 95th and 99th percentile values and Tukey’s fences. The cutoff values of the person-fit indices are not directly interpretable. The cutoff can be interpreted as the maximum length of a long string of item scores in respondents not categorized as careless. Notably, cutoff vales for
varied substantially—from 10.8 (simulated 95th percentile) to 17.4 (simulated 99th percentile) for the BSI and from 6 (Tukey’s fences) to 11.3 (simulated 99th percentile) for the MASQ. The high simulated 99th percentile cutoff values for
suggests that using these cutoff values, the prevalence of repetitive careless responding might be underestimated, while the low cutoff value based on Tukey’s fences for the BSI may result in an overestimation of repetitive carless responding.
Figure 3. Histograms showing the distributions of validity indices and the three cutoff values.
The prevalence of careless responding
shows the prevalence estimates for careless responding using the three different cutoff values. For the simulated 95th and 99th percentile values, the estimates based on the person-fit indices were considerably higher than the nominal Type I error rates (.05 and .01, respectively). So, after taking into account the respondents that were classified as careless by chance, a substantial rate of response patterns were classified as careless. For , the prevalence estimates based on the simulated percentile values suggested the presence of repetitive careless responding in the BSI data, but the MASQ prevalence estimates did not exceed the nominal Type I error rates. The negatively worded items in the MASQ may have triggered respondents to be more attentive and prevented them from producing long strings of identical item scores.
Table 2. Estimated prevalence of careless responding using three different cutoff values.
There was substantial variation between the prevalence estimates based on the simulated percentiles and those based on Tukey’s fences. For example, in the MASQ data, estimated prevalence based on the index ranged from .028 (Tukey’s fences) to .196 (95th percentile), and estimated prevalence based on the
index ranged from .010 (99th percentile) to .117 (Tukey’s fences). Tukey’s fences classified relatively many response patterns as careless based on
but only a small rate (<.035) based on the person-fit indices. The prevalence estimates based on the person-fit indices were consistently higher for the MASQ compared to the BSI. Possible explanations are that the negatively worded items in the MASQ facilitate picking up response inconsistencies and that the longer MASQ test length increases power to detect careless responding.
Agreement between indices
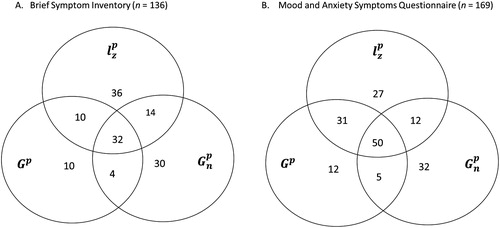
Although were highly correlated (Spearman’s rho ≥.78) and some prevalence estimates were quite similar across these indices (e.g., for Turkey’s fences), the individuals that were classified as careless were quite different. As an example, shows the overlap in persons classified as careless based on Tukey’s fences for
. Of the total number of respondents that were classified as careless on the BSI by at least one index, 24% was classified as careless by all three methods, 21% by two out of three methods and 55% by only one of the methods. For the MASQ, the corresponding percentages equal 30, 28 and 42, respectively. So, of the response patterns classified as invalid using Tukey’s fences, a large part is only classified as such by one of the validity indices.
Figure 4. Venn diagrams of the respondents classified as careless using Tukey’s fences and by at least one of three methods (,
, and
) on the BSI and MASQ, respectively.
Effect of carelessness on (sub)scale score means and standard deviations
To assess the effects of careless responding on scale score means and standard deviations, we used and
to exclude careless respondents. First, because the combination of these indices resulted in the highest detection rates. Second, because these indices were most strongly related to the total score. This way, we could estimate the “maximal effect” of excluding careless respondents on the scale mean scores and standard deviations.
and show the effect of excluding respondents classified as careless on the (sub)scale means and standard deviations. Results are shown separately for each index but also for excluding respondents that were flagged by either or
. For the (sub)scale score means, the largest effect was found for the AA subscale score when we used the
index and the simulated 95th percentile cutoff value. The difference in the mean score was 0.11, which corresponds to 15% of the score standard deviation in the full sample. For the (sub)scale score standard deviations, we found the largest difference for the BSI when we excluded respondents based on
and
using the simulated cutoff values—the standard deviation equaled 0.70 for the full sample and 0.63 for the clean sample.
Table 3. The differences in (sub)scale mean score values when comparing the cleaned empirical dataset with full empirical dataset ( –
).
Table 4. The differences in (sub)scale SD values when comparing the cleaned empirical dataset with full empirical dataset ( –
.
Effect of carelessness: post hoc analyses
When applying validity indices to the real data, not all careless respondents are excluded (i.e., due to a lack of power) and some respondents are excluded who are not responding carelessly (i.e., the Type I error rate). Therefore, we also assessed the effect of excluding careless response patterns from simulated data sets. To this end, we modified the 200 clean data sets of N = 5,000 (i.e., the data that was used to establish the null distribution of the validity indices) by replacing some of the clean response patterns to represent random careless respondents. We simulated a strong degree of carelessness in the data: a prevalence of 20% careless respondents with each 50% random item scores in each questionnaire. To simulate careless responding for a given respondent, items were randomly selected from the questionnaire, and the IRT-based item scores were replaced by random item scores. For half of the careless respondents, the random item scores came from a uniform distribution; for the other half, the scores came from a normal distribution (Meade & Craig, Citation2012). Finally, we calculated the difference between the means and standard deviations of the (sub)scale total scores before and after inserting the careless responses for every simulated response pattern. These differences were averaged into mean difference values ().
Table 5. The average differences in (sub)scale M and SD values when comparing the simulated clean samples with the samples including 20% careless respondents (clean sample– full sample).
The differences in mean scale scores before and after including all of the simulated random careless responses in the clean data sets was small for the mean BSI total score (−0.08) and for the mean MASQ subscales scores (0.05 to −0.11). The differences in standard deviation values equaled at most 0.09 (GDD scale). For this scale, the standard deviation equaled, on average, 1.32 in the clean samples and 1.41 in the careless condition. So, even in data where 20% of the respondents had 50% random item scores, the effects of careless responding were not large.
Discussion
Screening for careless responding in ROM is complicated by the fact that direct validity checks may give the patient the impression that his or her responses are not taken seriously. Implementing indirect post hoc validity checks can mitigate this problem, and may be especially feasible when ROM data are collected by means of computerized tests (Wanders et al., Citation2017). Our study investigated which post hoc validity checks can best be used to detect careless responding in ROM data. Moreover, we assessed the necessity of implementing these checks in the analyses of aggregated ROM data.
Our review of different validity indices and their performance in previous comparison studies (e.g., Franz, Citation2016; Meade & Craig, Citation2012; Niessen et al., Citation2016) suggests that the person-fit indices and
are likely to have highest sensitivity and specificity for detecting random careless responding in ROM data. Person-fit indices take more (useful) information into account compared to, for example, the MD and ISD index. They use multiple parameter estimates for each item to compute the likelihood of a particular response pattern (
) or the number of response inconsistencies (
and
) for each person. The ISD index does not take any item properties into account, and the MD index only takes the mean item scores and item correlation matrix into account. However, another important conclusion from the review is that additional (simulation) studies are needed to compare detection rates between person-fit statistics and simpler validity indices. Such studies should take into account the specific properties of ROM data (e.g., different violations of model assumptions, short scale length and different types of carelessness) and assess which index is most powerful when a parametric IRT model does not fit the data well.
Our simulations suggest that particularly the null distributions of the , MD and ISD indices may be substantially confounded with the total scale score; in particular, when scales are short, item score distributions skewed, and all items worded in the same direction (i.e., scales such as the BSI). This is problematic in practical applications where a common cutoff value is applied to validity-index data of respondents with a large range in latent trait values. These cutoff values are more or less suitable depending on the trait value, and Type I errors may only occur for persons with specific trait values. The
person-fit index had the most favorable null distribution for using a common cutoff in subgroups of patients with different symptom severity. The null distribution of the
index should be further investigated as previous research found that the
null distribution was unrelated to the scale score (Emons, Citation2008), while we found relatively high Type I errors for low trait values on the MASQ. Regarding the
index, post hoc analyses of the real BSI data showed that long strings on the BSI were mostly strings of 0 values. Such strings may be a sign of careless responding, but they may also be due to a floor effect or purposeful under-reporting of symptoms. Future applications of the
index to psychopathology scales should therefore compute different cutoff values for different response options (i.e., a separate cutoff value for the 0-score and for the 4-score) to take into account the skewed nature of the data (Johnson, Citation2005).
A comparison of two different methods (IRT-based simulations and Tukey’s fences) for categorizing respondents as careless resulted in a wide range of prevalence estimates in real BSI and MASQ data. We found particularly high rates of respondents classified as careless (0.14–0.20) based on person-fit indices using the IRT-based 95th percentile cutoff value. These results are consistent with results of Wanders et al. (Citation2017) in another ROM patient sample: application of the statistic combined with a 95th percentile cutoff value to self-report depression data resulted in a classification rate of 0.24. Although use of the 95th percentile is common practice in person-fit research (Meijer et al., Citation2016), for using person-fit indices to screen for carelessness in ROM, we recommend the use of more conservative cutoff values (i.e., such as the 99th simulated percentile or Tukey’s fences value). First, because the nominal Type I error rate of .05 is relatively large compared to the expected low prevalence of carelessness in ROM data. When the prevalence is low and the test liberal, the majority of identified respondents may be false positives. Second, because there is always some degree of misfit between the IRT-based simulated data (and resulting cutoff values) and the empirical psychopathology data (such misfit was also present in our analysis; see Appendix B). This misfit may further increase Type I error rates. Third, the high classification rates in our study and previous studies suggest that the 95th percentile cutoff also detects (very) mild forms of carelessness; such mild carelessness may only result in negligible test score bias. For practical use in ROM, it is important that only those response patterns are detected for which the carelessness leads to biased test scores. Based on the prevalence estimates in this study, we expect that the conservative categorization methods have enough power to detect such cases.
Finally, the results suggest that the effects of careless responding in ROM data on scale score means and standard deviations are not large. There are two explanations. First, many patients are motivated (at least to some extent) to produce valid data because the results may affect treatment decisions. Consequently, severe degrees of careless responding seldom occur, and most respondents classified as careless in this study showed only modest carelessness. Second, as shown by the post hoc simulated data results, even if there is a substantial degree of random responding in a sample, this still has small effects on scale score means and standard deviations. If careless responding in ROM data is similar to pure random responding, part of the random errors are canceled out on the (sub)scale score level. Despite these plausible explanations, more research should be done to verify and to expand our findings. For example, is the degree of bias also negligible when using direct screening methods or response time to exclude respondents? What is de degree of bias resulting from repetitive careless responding?
The literature review and results in this article suggest that a relatively complicated person-fit index () may be most useful for detecting random carelessness in ROM, as the more simple indices may be confounded with the trait level and have lower power to detect partial careless responding. This is a notable outcome as recent reviews on methods to detect careless responding did not include
(e.g., DeSimone et al., Citation2015; Curran, Citation2016). For larger mental-health care institutions, ROM systems are practically always computerized. So, despite its relative complexity, the
index seems feasible for application in ROM, even for providing real-time information on careless responding (Wanders et al., Citation2017). In such systems, the cutoff values for categorizing patients as careless should be established separately for different ROM measures, and be preferably based on data of large and representative samples. When validity indices are used that are not strongly confounded by the latent trait value (
and possibly also
), these cutoff values are equally applicable to groups of respondents with different degrees of symptom severity.
Strengths and limitations
The main strength of this study is that we reviewed and investigated indices for careless responding within the specific context of ROM, in a large and representative ROM sample. Consequently, our results provide recommendations regarding the implementation of validity checks in that context. Next to that, our results are also useful for other researchers collecting data with psychopathology scales, and provide suggestions on how to further investigate the performance of validity indices for detecting carelessness in psychopathology data.
However this study had limitations, which lead to recommendations for further research. First, we could not identify a validity index suitable for detecting repetitive careless responding in ROM data. Second, we did not compare the performance of post hoc validity checks to the performance of direct screening methods. Future research may focus on developing direct screening methods for ROM that are effective but do not lead respondents to feel that their answers are not trusted. Third, our study focused on careless responding but other invalid response styles such as consciously under-reporting or over-reporting symptoms (Godinho et al., Citation2016) are likely to be present in ROM data. These response styles may have affected our prevalence estimates, especially those based on . The prevalence estimates based on the person-fit indices are less likely affected by purposeful under-or over-reporting because such respondents adopt another trait value and respond consistently with respect to that trait value (Zickar & Drasgow, Citation1996). An important topic for future research is to find ways to divide aberrant response patterns into a careless group and over-and under-reporting group. Response times could be used for this purpose, as careless respondents are likely faster than respondents purposefully over- and underreporting symptoms. Alternative measures could be self-reported motivation and fatigue during the completion of self-report measures. Additional advantages of including external measures such as response time in future research would be to validate the response-pattern-based validity indices and to potentially identify a subgroup of careless respondents not identified by the statistical validity indices.
Conclusion
Our study suggests that various post hoc validity indices that have been recommended for survey and personality research should be used with caution in ROM and psychopathology data. Some of these indices lack power for detecting partial carelessness, and using other indices Type I errors may only occur for respondents with specific latent trait values. Among the investigated post hoc indices in this study, person-fit index , combined with conservative cutoff values, seems most appropriate for detecting random carelessness in large ROM data sets. However, future studies are needed that (1) compare the performance of
with of simpler (direct) screening methods given typical ROM data properties and direct screening methods, and (2) develop more appropriate methods for detecting repetitive responding. Finally, we found that the effect of careless responding on results of aggregated data analysis may not be very large, which suggests that screening for careless responding may be most useful for improving individual decision-making.
Article Information
Conflict of interest disclosures: Each author signed a form for disclosure of potential conflicts of interest. No authors reported any financial or other conflicts of interest in relation to the work described.
Ethical principles: The authors affirm having followed professional ethical guidelines in preparing this work. These guidelines include obtaining informed consent from human participants, maintaining ethical treatment and respect for the rights of human or animal participants, and ensuring the privacy of participants and their data, such as ensuring that individual participants cannot be identified in reported results or from publicly available original or archival data.
Funding: This work was not supported by a Grant.
Role of the funders/sponsors: None of the funders or sponsors of this research had any role in the design and conduct of the study; collection, management, analysis, and interpretation of data; preparation, review, or approval of the manuscript; or decision to submit the manuscript for publication.
Acknowledgments: We gratefully acknowledge the mental health care provider GGZ Rivierduinen and the patients participating in this study. The ideas and opinions expressed herein are those of the authors alone, and endorsement by the authors’ institutions is not intended and should not be inferred.
References
- Armistead-Jehle, P., & Green, P. (2016). Model for the effects of invalid styles of response. Applied Neuropsychology: Adult, 23(6), 449–458. doi:10.1080/23279095.2016.1178646
- Barendregt, M. (2015). Benchmarken en andere functies van ROM: Back to basics [Benchmarking and other functions of ROM: Back to basics]. Tijdschrift Voor Psychiatrie, 7, 517–525.
- Ben-Porath, Y. S. (2013). Self-report inventories: Assessing personality and psychopathology. In J. R. Graham & J. Naglieri (Eds.), Handbook of assessment psychology (pp. 622–644). 2nd ed. Vol. X. New York, NY: Wiley.
- Boschen, M. J., & Oei, T. P. S. (2006). Factor structure of the Mood and Anxiety Symptom Questionnaire does not generalize to an anxious/depressed sample. Australian and New Zealand Journal of Psychiatry, 40(11–12), 1016–1024. doi:10.1111/j.1440-1614.2006.01926.x
- Boswell, J. F., Kraus, D. R., Castonguay, L. G., & Youn, S. J. (2015). Treatment outcome package: Measuring and facilitating multidimensional change. Psychotherapy, 52(4), 422. doi:10.1037/pst0000028
- Boswell, J. F., Kraus, D. R., Miller, S. D., & Lambert, M. J. (2015). Implementing routine outcome monitoring in clinical practice: Benefits, challenges, and solutions. Psychotherapy Research, 25(1), 6–19. doi:10.1080/10503307.2013.817696
- Burchett, D., Dragon, W. R., Smith Holbert, A. M., Tarescavage, A. M., Mattson, C. A., Handel, R. W., & Ben-Porath, Y. S. (2016). “False feigners”: Examining the impact of non-content-based invalid responding on the Minnesota Multiphasic Personality Inventory-2 Restructured Form content-based invalid responding indicators. Psychological Assessment, 28(5), 458–470. doi:10.1037/pas0000205
- Butcher, J. N., Dahlstrom, W. G., Graham, J. R., Tellegen, A., & Kaemmer, B. (1989). The Minnesota Multiphasic Personality Inventory-2 (MMPI-2): Manual for administration and scoring. Minneapolis, MN: University of Minnesota Press.
- Cai, L. (2010). High-dimensional exploratory item factor analysis by a Metropolis–Hastings Robbins–Monro algorithm. Psychometrika, 75(1), 33–57. doi:10.1007/s11336-009-9136-x
- Carlier, I. V. E., & van Eeden, W. A. (2017). Routine outcome monitoring in mental health care and particularly in addiction treatment: Evidence-based clinical and research recommendations. Journal of Addiction Research & Therapy, 8, 1–7. doi:10.4172/2155-6105.1000332
- Caspi, A., Houts, R. M., Belsky, D. W., Goldman-Mellor, S. J., Harrington, HLee., Israel, S., … Moffitt, T. E. (2014). The p factor: One general psychopathology factor in the structureof psychiatric disorders? Clinical Psychological Science, 2(2), 119–137. doi:10.1177/2167702613497473
- Chalmers, R. P. (2012). mirt: A multidimensional item response theory package for the R environment. Journal of Statistical Software, 48, 1–29. doi:10.18637/jss.v048.i06
- Conijn, J. M., Emons, W. H., & Sijtsma, K. (2014). Statistic lz-based person-fit methods for noncognitive multiscale measures. Applied Psychological Measurement, 38(2), 122–136. doi:10.1177/0146621613497568
- Conijn, J. M., Emons, W. H., De Jong, K., & Sijtsma, K. (2015). Detecting and explaining aberrant responding to the Outcome Questionnaire–45. Assessment, 22(4), 513-524. doi:10.1177/1073191114560882
- Conijn, J. M., van der Ark, A., & Spinhoven, P. (2017). Satisficing in mental health care patients: The effect of cognitive symptoms on self-report data quality. Assessment. Advance Online Publication. doi:10.1177/1073191117714557
- Curran, P. G. (2016). Methods for the detection of carelessly invalid responses in survey data. Journal of Experimental Social Psychology, 66, 4–19. doi:10.1016/j.jesp.2015.07.006
- de Beurs, E., den Hollander-Gijsman, M. E., Helmich, S., & Zitman, F. G. (2007). The tripartite model for assessing symptoms of anxiety and depression: Psychometrics of the Dutch version of the mood and anxiety symptoms questionnaire. Behaviour Research and Therapy, 45(7), 1609–1617. doi:10.1016/j.brat.2006.07.004
- de Beurs, E., den Hollander-Gijsman, M. E., van Rood, Y. R., van der Wee, N. J. A., Giltay, E. J., van Noorden, M. S., … Zitman, F. G. (2011). Routine outcome monitoring in the Netherlands: Practical experiences with a web-based strategy for the assessment of treatment outcome in clinical practice. Clinical Psychology & Psychotherapy, 18(1), 1–12. doi:10.1002/cpp.696
- de Beurs, E., & Zitman, F. G. (2006). De Brief Symptom Inventory (BSI): De betrouwbetrouwbaarheid en validiteit van een handzaam alternatief voor de SCL-90 [The Brief Symptom Inventory (BSI): Reliability and validity of a practical alternative to SCL-90]. Maandblad Geestelijke Volksgezondheid, 61, 120–141.
- Derogatis, L. R., & Melisaratos, N. (1983). The Brief Symptom Inventory: An introductory report. Psychological Medicine, 13(03), 595–605. doi:10.1017/S0033291700048017
- DeSimone, J. A., Harms, P. D., & DeSimone, A. J. (2015). Best practice recommendations for data screening. Journal of Organizational Behavior, 36(2), 171–181. doi:10.1002/job.1962
- Drasgow, F., Levine, M. V., & Williams, E. A. (1985). Appropriateness measurement with polychotomous item response models and standardized indices. British Journal of Mathematical and Statistical Psychology, 38(1), 67–86. doi:10.1111/j.2044-8317.1985.tb00817.x
- Emons, W. H. (2008). Person-fit analysis of polytomous items. Applied Psychological Measurement, 32(3), 224–247. doi:10.1177/0146621607302479
- Fervaha, G., & Remington, G. (2013). Invalid responding in questionnaire-based research: Implications for the study of schizotypy. Psychological Assessment, 25(4), 1355–1360. doi:10.1037/a0033520
- Franz, G. (2016). Identifying careless responders in routine outcome monitoring data (Master’s thesis). Leiden University, Leiden, the Netherlands. Retrieved from https://openaccess.leidenuniv.nl/handle/1887/41722
- Gervais, R. O., Tarescavage, A. M., Greiffenstein, M. F., Wygant, D. B., Deslauriers, C., & Arends, P. (2017). Inconsistent responding on the MMPI-2-RF and uncooperative attitude: Evidence from cognitive performance validity measures. Psychological Assessment. Advance Online Publication. doi:10.1037/pas0000506
- Godinho, A., Kushnir, V., & Cunningham, J. A. (2016). Unfaithful findings: Identifying careless responding in addictions research. Addiction, 111(6), 955–956. doi:10.1111/add.13221
- Golay, P., Fagot, D., & Lecerf, T. (2013). Against coefficient of variation for estimation of intraindividual variability with accuracy measures. Tutorials in Quantitative Methods for Psychology, 9(1), 6–14. doi:10.20982/tqmp.09.1.p006
- Guttman, L. (1950). The principal components of scale analysis. In S. A. Stouffer measurement of prediction (pp. 312–361). Princeton, NJ: Princeton University Press.
- Handel, R. W., Ben-Porath, Y. S., Tellegen, A., & Archer, R. P. (2010). Psychometric functioning of the MMPI-2-RF VRIN-r and TRIN-r scales with varying degrees of randomness, acquiescence, and counter-acquiescence. Psychological Assessment, 22(1), 87–95. doi:10.1037/a0017061
- Holtzman, N. S., & Donnellan, M. B. (2017). A simulator of the degree to which random responding leads to biases in the correlations between two individual differences. Personality and Individual Differences, 114, 187–192. doi:10.1016/j.paid.2017.04.013
- Huang, J. L., Curran, P. G., Keeney, J., Poposki, E. M., & DeShon, R. P. (2012). Detecting and deterring insufficient effort responding to surveys. Journal of Business and Psychology, 27(1), 99–114. doi:10.1007/s10869-011-9231-8
- Huang, J. L., Liu, M., & Bowling, N. A. (2015). Insufficient effort responding: Examining an insidious confound in survey data. Journal of Applied Psychology, 100(3), 828–845. doi:10.1037/a0038510
- Huang, J. L., Bowling, N. A., Liu, M., & Li, Y. (2015). Detecting insufficient effort responding with an infrequency scale: Evaluating validity and participant reactions. Journal of Business and Psychology, 30(2), 299–311. doi:10.1007/s10869-014-9357-6
- Ingram, P. B., & Ternes, M. S. (2016). The detection of content-based invalid responding: A meta-analysis of the MMPI-2-Restructured Form’s (MMPI-2-RF) over-reporting validity scales. The Clinical Neuropsychologist, 30(4), 473–496. doi:10.1080/13854046.2016.1187769
- Johnson, J. A. (2005). Ascertaining the validity of individual protocols from web-based personality inventories. Journal of Research in Personality, 39(1), 103–129. doi:10.1016/j.jrp.2004.09.009
- Johnson, R. A., & Wichern, D. W. (2008). Applied multivariate statistical analysis. Australia: Pearson.
- Kam, C. C. S., & Chan, G. H. H. (2018). Examination of the validity of instructed response items in identifying careless respondents. Personality and Individual Differences, 129, 83–87. doi:10.1016/j.paid.2018.03.022
- Kam, C., & Meyer, J. P. (2015). How careless responding and acquiescence response bias can influence construct dimensionality: The case of job satisfaction. Organizational Research Methods, 18(3), 512–541. doi:10.1177/1094428115571894
- Keeley, J. W., Webb, C., Peterson, D., Roussin, L., & Flanagan, E. H. (2016). Development of a response inconsistency scale for the personality inventory for DSM–5. Journal of Personality Assessment, 98(4), 351–359. doi:10.1080/00223891.2016.1158719
- Krosnick, J. A. (1991). Response strategies for coping with the cognitive demands of attitude measures in surveys. Applied Cognitive Psychology, 5(3), 213–236. doi:10.1002/acp.2350050305
- Lambert, M. J., Morton, J. J., Hatfield, D., Harmon, C., Hamilton, S., Reid, R. C., …Burlingame, G. M. (2004). Administration and scoring manual for the OQ-45.2 (Outcome Questionnaire). 3th ed. Wilmington DE: American Professional Credential Services.
- Maniaci, M. R., & Rogge, R. D. (2014). Caring about carelessness: Participant inattention and its effects on research. Journal of Research in Personality, 48, 61–83. doi:10.1016/j.jrp.2013.09.008.
- Marjanovic, Z., Holden, R., Struthers, W., Cribbie, R., & Greenglass, E. (2015). The inter-item standard deviation (ISD): An index that discriminates between conscientious and random responders. Personality and Individual Differences, 84, 79–83. doi:10.1016/j.paid.2014.08.021
- McGonagle, A. K., Huang, J. L., & Walsh, B. M. (2016). Insufficient effort survey responding: An under-appreciated problem in work and organizational health psychology research. Applied Psychology, 65(2), 287–321. doi:10.1111/apps.12058
- McGrath, R. E., Mitchell, M., Kim, B. H., & Hough, L. (2010). Evidence for response bias as a source of error variance in applied assessment. Psychological Bulletin, 136(3), 450. doi:10.1037/a0019216
- Meade, A. W., & Craig, S. B. (2012). Identifying careless responses in survey data. Psychological Methods, 17(3), 437–455. doi:10.1037/a0028085
- Meijer, R. R. (1997). Person fit and criterion-related validity: An extension of the Schmitt, Cortina, and Whitney study. Applied Psychological Measurement, 21, 99–113. doi:10.1177/01466216970212001
- Meijer, R. R., Niessen, A. S. M., & Tendeiro, J. N. (2016). A practical guide to check the consistency of item response patterns in clinical research through person-fit statistics: Examples and a computer program. Assessment, 23(1), 52–62. doi:10.1177/1073191115577800
- Morey, L. C. (1991). Personality assessment inventory professional manual. Odessa, FL: Psychological Assessment Resources.
- Niessen, A. S. M., Meijer, R. R., & Tendeiro, J. N. (2016). Detecting careless respondents in web-based questionnaires: Which method to use? Journal of Research in Personality, 63, 1–11. doi:10.1016/j.jrp.2016.04.010
- Osborne, J. W., & Blanchard, M. R. (2011). Random responding from participants is a threat to the validity of social science research results. Frontiers in Psychology, 1, 1–7. doi:10.3389/fpsyg.2010.00220
- Raiche, G. (2010). nFactors: An R package for parallel analysis and non graphical solutions to the Cattell scree test. R package version 2.3.3.
- Reckase, M. (2009). Multidimensional item response theory. Vol. 150. New York, NY: Springer.
- Reise, S. P., & Waller, N. G. (2009). Item response theory and clinical measurement. Annual Review of Clinical Psychology, 5, 25–46. doi:10.1146/annurev.clinpsy.032408.153553
- Roivainen, E., Veijola, J., & Miettunen, J. (2016). Careless responses in survey data and the validity of a screening instrument. Nordic Psychology, 68(2), 114–123. doi:10.1080/19012276.2015.1071202
- Sheehan, D., Lecrubier, Y., Sheehan, K. H., Sheehan, K., Amorim, P., Janavs, J., … Dunbar, G. (1998). The Mini-International Neuropsychiatric Interview (M.I.N.I.): The development and validation of a structured diagnostic psychiatric interview for DSM-IV and ICD-10. The Journal of Clinical Psychiatry, 59(Suppl 20), 22–33.
- Seo, D. G., & Weiss, D. J. (2013). lz Person-fit index to identify misfit students with achievement test data. Educational and Psychological Measurement, 73(6), 994–1016. doi:10.1177/0013164413497015
- Sinharay, S. (2017). How to compare parametric and nonparametric person‐fit statistics using real data. Journal of Educational Measurement, 54(4), 420–439. doi:10.1111/jedm.12155
- Thomas, M. L. (2011). The value of item response theory in clinical assessment: A review. Assessment, 18, 29–307. doi:10.1177/1073191110374797
- Thomas, M. L. (2012). Rewards of bridging the divide between measurement and clinical theory: Demonstration of a bifactor model for the Brief Symptom Inventory. Psychological Assessment, 24(1), 101. doi:10.1037/a0024712
- Trauer, T. (Ed.). (2010). Outcome measurement in mental health: Theory and practice. Cambridge, UK: Cambridge University Press.
- Tukey, J. W. (1977). Exploratory data analysis. Reading, MA: Addison-Wesley.
- Urbán, R., Kun, B., Farkas, J., Paksi, B., Kökönyei, G., Unoka, Z., … Demetrovics, Z. (2014). Bifactor structural model of symptom checklists: SCL-90-R and Brief Symptom Inventory (BSI) in a non-clinical community sample. Psychiatry Research, 216(1), 146–154. doi:10.1016/j.psychres.2014.01.027
- Wanders, R. B., Meijer, R. R., Ruhé, H. G., Sytema, S., Wardenaar, K. J., & de Jonge, P. (2017). Person-fit feedback on inconsistent symptom reports in clinical depression care. Psychological Medicine, 48(11), 1844–1852. doi:10.1017/S003329171700335X
- Wanders, R. B. K., Wardenaar, K. J., Penninx, B. W. J. H., Meijer, R. R., & de Jonge, P. (2015). Data-driven atypical profiles of depressive symptoms: Identification and validation in a large cohort. Journal of Affective Disorders, 180, 36–43. doi:10.1016/j.jad.2015.03.043
- Wardenaar, K. J., Wanders, R. B. K., Roest, A. M., Meijer, R. R., & de Jonge, P. (2015). What does the beck depression inventory measure in myocardial infarction patients?: A psychometric approach using item response theory and person-fit. International Journal of Methods in Psychiatric Research, 24(2), 130–142. doi:10.1002/mpr.1467
- Watson, D., Weber, K., Assenheimer, J. S., Clark, L. A., Strauss, M. E., & McCormick, R. A. (1995). Testing a tripartite model: I. Evaluating the convergent and discriminant validity of anxiety and depression symptom scales. Journal of Abnormal Psychology, 104(1), 3–14. doi:10.1037/0021-843X.104.1.3
- Widhiarso, W., & Sumintono, B. (2016). Examining response aberrance as a cause of outliers in statistical analysis. Personality and Individual Differences, 98, 11–15. doi:10.1016/j.paid.2016.03.099
- Zickar, M. J., & Drasgow, F. (1996). Detecting faking on a personality instrument using appropriateness measurement. Applied Psychological Measurement, 20(1), 71–87. doi:10.1177/014662169602000107
- Zijlstra, W. P., van der Ark, L. A., & Sijtsma, K. (2007). Outlier detection in test and questionnaire data. Multivariate Behavioral Research, 42(3), 531–555. doi:10.1080/00273170701384340
- Zijlstra, W. P., van der Ark, L. A., & Sijtsma, K. (2011). Outliers in questionnaire data: Can they be detected. And Should They Be Removed? Journal of Educational and Behavioral Statistics, 36(2), 186–212. doi:10.3102/1076998610366263