

 ?Mathematical formulae have been encoded as MathML and are displayed in this HTML version using MathJax in order to improve their display. Uncheck the box to turn MathJax off. This feature requires Javascript. Click on a formula to zoom.
Abstract
Experience sampling studies often aim to capture social interactions. A central methodological question in such studies is whether to use event- or signal-contingent sampling. The little existing research on this issue has not taken into account that social interactions occur with unique interaction partners (e.g., Anna or Tom). We analyze one week of social interaction data of 286 students from the University of Pittsburgh (60.8% male, mean age 19.2 years), taking into account the unique interaction partners of each student. Specifically, we investigate the differences between event- and signal contingent sampling in (1) the total number of unique interaction partners captured, as well as (2) the kinds of relationships, and (3) the quality of social interactions with these captured interaction partners. Apart from a larger quantity of interactions and unique interaction partners in the event-contingent sampling design, our analyses indicate subtle differences between the two designs when aiming to assess social interactions with more distant interaction partners, such as coworkers or strangers. Most importantly, in our analyses, specific interaction partners and social roles explained a considerable amount of variance in the quality of social interactions (up to 20.5%), suggesting that future research would benefit greatly from considering “with whom” individuals interact.
In recent years, it has become easier to study mood in daily life due to advances in methodology (Silva & Cotter, Citation2021). Researchers more often focus on the bidirectional relationship between social interactions and mood, as this is relevant to many fields, such as mental and physical health (e.g., Brown et al., Citation2011; Elmer et al., Citation2020; Kopala-Sibley et al., Citation2012), attachment (Kaurin et al., Citation2022), well-being (Achterhof et al., Citation2022), or job satisfaction (Dimotakis et al., Citation2011). One method for capturing these dynamics is experience sampling methodology (ESM), also known as Ecological Momentary Assessment (EMA), which involves participants completing short smartphone surveys throughout their daily lives.
ESM is an increasingly popular tool to study social processes within daily life as it allows researchers to capture real-time, person-specific social interactions and their associations with, for example, momentary well-being by offering a dynamic and ecologically valid perspective (Myin-Germeys & Kuppens, Citation2021). By minimizing recall bias and providing rich, momentary data, ESM enables researchers to examine social processes as they naturally unfold, ultimately contributing to a better understanding of social experiences, their perceptions, and their implications for psychological processes (Stadel et al., Citation2023).
Designing an ESM study can, however, be complex, and to date, there are few established methodological standards. A central question when setting-up an ESM study is the sampling design (Myin-Germeys & Kuppens, Citation2021; Silva & Cotter, Citation2021). Two common designs are event- and signal-contingent sampling. When applying an event-contingent design, participants are asked to initiate assessments themselves, any time an event of interest (e.g., a social interaction, smoking a cigarette, or a binge-eating episode) occurs. In contrast, a signal-contingent design entails using a predefined number of (semi-)random or fixed assessment prompts distributed over the course of a day. These prompts ask about occurrences of the event of interest (e.g., social interactions) since the last assessment or in the moment itself.
To date, little is known to which extent the decision to use an event- or signal-contingent sampling design to capture social interactions affects gathered data and thus the substantive findings of a study. To our knowledge, there are only two studies explicitly comparing the two designs (Dawood et al., Citation2020; Himmelstein et al., Citation2019). These studies come to different conclusions but also differ considerably in their aims and methodology.
Himmelstein et al. (Citation2019) researched whether collecting data on social interactions with event- or signal-contingent experience sampling leads to systematic differences in data quality or quantity. They recruited students from the University of Pittsburgh who were randomly assigned to either event- or signal-contingent sampling of social interactions. Based on comparisons of mean and variance of interaction quality (i.e., affect, warmth, and dominance) between the two conditions they concluded that the two sampling designs may be used interchangeably. They further concluded that participants in the event-contingent condition indicated approximately one-third more interactions than the ones in the signal-contingent condition. Additionally, participants in the event-contingent condition were more likely to report interactions during the day (between 7 am and 7 pm) and later evening (between 10 pm and 1 am). Between 7 and 10 pm, the likelihood of interaction reporting was similar in both conditions. Overall, Himmelstein et al. note that while there is a difference in data quantity between recording interactions with event-contingent as opposed to signal-contingent designs, there appears to be none in quality.
Dawood et al. (Citation2020) researched whether affect ratings differ when collected with a signal- vs. event-contingent sampling design. They conducted a within-subject study (N = 40) with psychotherapy-outpatients who reported on their affect for 21 days via six semi-random ESM prompts per day. During the same 21-day period, participants also reported on their social interactions in an event-contingent manner. These event-contingent reports included momentary affect ratings as well. The results of Dawood et al. show that semi-random affect reports and event-contingent affect reports tied to a social interaction differ in mean and variability. Specifically, patients reported on average higher arousal and more positive valence in event-contingent interaction assessments. The signal-contingent assessments, on the other hand, showed more within and between-person mood variability. Thus, Dawood et al. showed that affect tied to social interactions is on average more positive and with a higher arousal than affect measured semi-randomly throughout the day. As this investigation did not contrast signal-contingent reports of social interactions with event-contingent reports of social interaction specifically, a comparison to the investigation of Himmelstein et al. is difficult.
Given the limited prior research, many questions regarding the effects of sampling design on the assessment of daily-life social interactions remain open. Importantly, none of the studies considered with whom a social interaction took place—neither unique interaction partners (e.g., Anna or Tom), nor a broader social role classification (e.g., friend or coworker). Differentiating between interaction partners allows us to examine their unique effects on interaction quality and study with whom social interactions are for example particularly positive or negative. Even if it is not the main interest of a study to make such a differentiation, the fact that social interactions take place with a specific interaction partner, and that likely multiple interactions happen with the same partner, creates dependencies between assessments. This dependence can and should be accounted for in analyses (Perry et al., Citation2018) and not doing so may have masked differences between the two sampling designs in previous research.
Additionally, considering with whom in ESM research enables a more comprehensive exploration of social support networks. By identifying key individuals in an person’s daily life, researchers can assess how certain interactions contribute to momentary well-being or serve as sources of stress. This knowledge can inform interventions aimed at enhancing social support. Furthermore, studying specific interaction partners or roles can shed light on the development of relationships over time. It allows researchers to assess changes in interaction quality or frequency with particular individuals, providing valuable data for understanding the dynamics of evolving social relationships. Lastly, accounting for the “with whom” aspect in ESM research aligns with the broader goal of personalization and context-specificity in psychological studies. It recognizes that individuals may have unique patterns of interaction and emotional responses with different people, emphasizing the need for tailored interventions and treatment strategies based on an individual’s specific social context (Stadel et al., Citation2023).
Yet, to date, it is not known how omitting such with whom information could bias analyses aiming to explain social interaction outcomes (e.g., quality, affect). In other words, we do not know how much variance in social interaction outcomes can be attributed to information on with whom individuals interact.
The current study
The goal of the current study is to reanalyze the data collected by Himmelstein et al. (Citation2019), differentiating between different interaction partners. We illustrate a more elaborate modeling approach for social interaction data than common ESM analysis strategies (i.e., two-level models with social interactions nested in participants) by including interaction partners as a further level of analysis. This results in a three-level model, with social interactions nested within interaction partners nested within participants (see Perry et al., Citation2018, p. 262). Such more detailed modeling can help to shed light on complex social processes in daily life by taking information about specific interaction partners/social network members into account. shows an illustration of the three-level nested structure.
Figure 1. Data structure of ESM social interaction assessments.
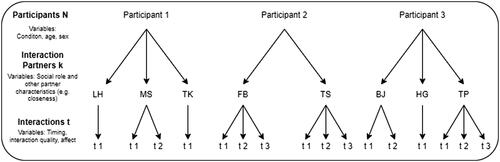
Specifically, we test whether the data obtained using the two ESM sampling designs differ with regard to the number of captured unique interaction partners and the quality of relationships with these partners. We also reexamine differences in the quality of reported social interactions—now taking into account the unique interaction partner with whom an interaction takes place. Considering the with whom allows us to further compare social interaction data obtained via an event- or signal-contingent sampling design.
Differences in the number of unique interaction partners
Given that fewer interactions are captured with signal-contingent ESM (Himmelstein et al., Citation2019), it is likely that also fewer unique interaction partners are captured. Thus, our first research question (RQ1) is whether systematically fewer unique interaction partners (Level 2 in ) are captured with signal- vs. event-contingent experience sampling reports.
Differences in the quality of relationships with captured interaction partners
Besides a different number of captured interaction partners, event- and signal-contingent sampling may result in assessing different kinds of interaction partners in terms of social roles or relationship quality (e.g., closeness). As an event-contingent design captures a substantial number of interactions outside of the common signal-contingent period (i.e., 10 am to 10 pm), it may be that this design captures more interactions with leisure-related social roles that take place, for example, with friends and family as opposed to teachers, superiors, and colleagues.
Naturally, participants have a different relationship with friends than with colleagues. Hence, the closeness of interaction partners may differ as well between the two sampling designs. Additionally, signal-contingent sampling may bias participants toward reporting more memorable interactions and thus underrepresent shorter encounters (e.g., chit-chat with a colleague) as interactions are not recorded immediately (Leertouwer et al., Citation2021). Thus, our second research question is: Do event- and signal-contingent sampling capture different kinds of relationships with interaction partners in terms of (a) social roles (RQ2a) and (b) relationship quality ratings, such as closeness (RQ2b)?
Differences in the quality of the captured social interactions
Further, we are interested to see if the two sampling designs differ in terms of the quality of captured interactions when taking interaction-partner-specific effects into account. For example, interactions with Alice are of higher quality than the average interaction of the participant. Such interaction-partner-specific effects would be masked in the original analyses of Himmelstein et al. due to averaging characteristics of social interactions across all interaction partners. Therefore, we expand on their analyses by using the three-level framework presented in to answer the following research question: Do the event- and signal-contingent sampling designs differ in the quality of captured interactions (i.e., warmth and dominance of self and other, positive and negative affect) when taking into account unique interaction partners (RQ3)?
In the following, we will describe our methods and results regarding our three research questions. We pre-registered our analyses using the registration template for secondary data analysis (Akker et al., Citation2019; Weston et al., Citation2019). The registration, a document outlining deviations from the registration, an R-Markdown file with all analysis code and results as well as Supplementary Materials can be found on the Open Science Framework.Footnote1
Methods
Participants
We used data collected by Himmelstein et al. (Citation2019). This sample is composed of undergraduate students of Pittsburgh University in the US, who received course credits as compensation for their research participation. Additionally, participants were entered into a draw for Apple Watches, with their winning chances increasing with higher experience sampling compliance rates. The dataset includes a total of 10,260 observations (6028 event-contingent and 4232 signal-contingent) spread across 286 participants (38.8% female) with a mean age of 19.22 years (SD = 1.74). As Himmelstein et al. also asked participants to indicate the initials of their interaction partner, it is possible to link ESM social interaction assessments to unique interaction partners.
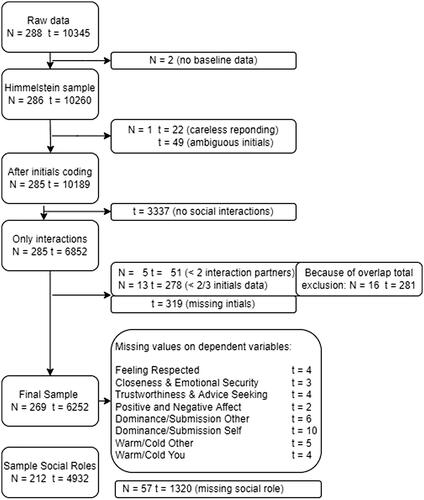
The presented analyses only include observations that captured a social interaction and contained the initials of the unique interaction partner. All initials were checked for eligibility and, when necessary, recoded into a consistent format. A detailed overview of recoded and excluded initials as well as the applicable reasons can be found in the Supplementary Materials on OSF. Further, we removed observations according to our pre-registered inclusion criteria for ensuring data quality on the initials variable: (a) We identified five participants (51 observations) who interacted with fewer than two different interaction partners during the study period and (b) 13 participants (278 observations) for whom <⅔ of all interaction data contained usable initials. Four participants presented with both issues. The final dataset included 6252 social interactions of 269 participants, of which 3810 social interactions of 139 participants were in the event-contingent condition and 2442 social interactions of 130 participants in the signal-contingent condition.
The social roles of interaction partners were unfortunately only available for 4932 observations of 212 participants, of which 3105 social interactions of 112 participants were in the event-contingent condition and 1827 social interactions of 100 participants in the signal-contingent condition. Missingness of these social role data is due to erroneous coding of this variable for a substantive part of the original sample (Number of observations = 1320, Number of participants = 57). Because the correct raw answers to this question are unrecoverable, for these participants all answers about the social role of their interaction partner are missing. A full overview of our participant and observation flow can be found in .
Figure 2. Participant flow.
Procedure
First, participants were invited to the lab for explanations and instructions about the study procedure. During this session, participants also filled in a baseline questionnaire. Then, participants were randomly assigned to one of the two sampling design conditions. In the following seven days, participants were asked to report on social interactions with either event- or signal-contingent experience sampling. Social interactions were defined as an exchange between the participant and at least one other person lasting for at least 5 min. All experience sampling assessments were done with the MetricWire application (Metricwire Inc. | Real-World Data | Real-Life Impact, Citation2022) on students’ personal smartphones.
Participants in the signal-contingent condition received six semi-random prompts per day between 10 am and 10 pm for seven days. Prompts were sent at least 90 min apart and participants were reminded to respond to a given prompt after 15 min. The questionnaire would become unavailable 30 min after the original prompt was sent. During each of the assessments, participants were asked to report on the most significant interpersonal interaction with a single individual since the last assessment. Participants only received their full credit compensation for a compliance rate of 67% (on average four out of the six daily prompts).
Participants in the event-contingent condition were asked to self-initiate assessments between 10 am to 10 pm immediately after the occurrence of each social interaction (as defined above). For compensation, participants were required to complete at least four assessments per day. Participants in this condition could also report outside of the daily 12-h assessment period if they wanted to. The content of the ESM questions was the same as in the signal-contingent condition.
Measures
In the following, we describe the measures that are used for the analyses of the present article. For more information on all measures and further details about the data collection, we refer to Himmelstein et al. (Citation2019).
Interaction partner
For every social interaction, participants were asked to indicate the initials or nickname of the interaction partner and which social role the partner had (Boss/Teacher = 0, Coworker = 1, Family member = 2, Friend/Acquaintance = 3, Romantic Partner/Spouse = 4, Roommate = 5, Someone I've not met before = 6, Other = 7).
Relationship quality
Three items from the Social Provisions Scale (SPS; Cutrona & Russell, Citation1987) were used to measure different facets of relationship quality with the current interaction partner: “Feeling Respected” (“The person I interacted with respects my skills and abilities”), “Closeness & Emotional Security” (“I have a close relationship with the person I interact with that provides me with a sense of emotional security and well-being”) and “Trustworthiness & Advice Seeking” (“The person I interacted with is a trustworthy person I could turn to for advice if I were having problems”). Participants were asked to respond on a visual analog scale from Strongly Disagree (= 0) to Strongly Agree (= 100). These items were assessed for every social interaction observation and were considered as separate variables.
Dominance and warmth
Participants were also asked for a rating of their own behavior in the interaction, as well as a rating of the interaction partner’s behavior using the Visual Interpersonal Analogue Scale (Woods et al., Citation2022): “Please rate how the other person behaved toward you during this interaction” and “Please rate your behavior toward the other person during this interaction” from Accommodating/Submissive/Timid (= −50) to Assertive/Dominant/Controlling (= 50) for “Dominance” and from Cold/Distant/Hostile (= −50) to Warm/Friendly/Caring (= 50) for “Warmth.”
Momentary affect
To measure affect, the 10-item version of the Positive and Negative Affect Schedule (PANAS; Watson & Clark, Citation1994) was used. This included the following five positive affect dimensions: “content,” “relaxed,” “happy,” “proud,” and excited.” The five negative affect dimensions were: “sad,” “nervous,” “angry,” “hostile,” and “ashamed.” Participants were asked to rate to what extent the adjective described how they felt on a 100-point visual analog scale from not at all (= 1) to extremely (= 100). Measures were always tied to a social interaction (e.g., “During the interaction, how happy did you feel?”).
Analysis
RQ1: Differences in the number of unique interaction partners
We determined the number of unique interaction partners for each participant, by using the captured initials and social roles (i.e., each unique initial/social role combination constituted a unique interaction partner). Then, we compared this variable between the two conditions with a two-tailed two-sample t-test. Because participants in the event-contingent condition had more opportunities to report social interactions (and in fact also did report more interactions), we additionally ran an analysis with a relative score of interaction partners. Specifically, we divided the raw number of unique interaction partners of a participant by the total number of interactions reported by that participant. We used a two-tailed two-sample t-test on this rate of reporting unique interaction partners given the total number of opportunities to report an interaction partner.
RQ2a: Differences in the reporting rates of specific social roles
To compare the event and signal-contingent sampling designs with regards to the captured social roles we examined the counts of unique interaction partners with a given social role (e.g., the number of captured friends) using a series of multilevel Poisson regression models. Similar to our strategy in answering the first research question, we correct for the larger number of opportunities to capture new interaction partners (i.e., the larger number of captured social interactions) in the event-contingent condition. This means that we are estimating the rate of interaction partners of a given role. Such data (i.e., counts and rates) cannot be modeled appropriately with a linear multilevel model. Hence, we turn to the Poisson regression framework (see e.g., Gelman & Hill, Citation2006). With this model, we can determine whether an independent variable, for example, sampling-design, is associated with differences in reporting rates of a given role. In our model, the rates on Level 1 are nested in participants on Level 2. Note that this is a different nesting structure than depicted in . As the main variable of interest is social role, these analyses were performed on the social roles subsample (see ). When examining the distributions of the interaction partner counts for each social role separately, it became apparent that all these distributions show overdispersion except for friends/acquaintances. This can be explained by the fact that whereas all respondents report one or more interactions with friends, many respondents report zero interactions for the other social roles (e.g., no interactions with a partner, boss, or stranger). Thus, we explored also models accommodating overdispersion (negative binomial) and an excess of zeros (zero-inflated Poisson and negative binomial (see, e.g., Hilbe, Citation2011). As a negative binomial model fits the data the best, we report the results of this analysis.Footnote2
We employed a stepwise modeling approach, starting with an empty model. In the second modeling step, to model the reporting rates of each social role, we added one dummy variable per social role as Level 1 predictors. To directly compare the rates of each social role between the two conditions, we used no intercept (Othman, Citation2014). Therefore, the main effects of the dummy variables for the social roles indicate the expected reporting rates per social role. In the following step, we added the main effect of the condition on Level 2. Lastly, we included interactions between the social role dummies and condition which indicate the differences in reporting rates per role between the two sampling designs.
RQ2b: Differences in the quality of relationships with captured interaction partners
We further wanted to examine differences between event- and signal-contingent sampling regarding the quality of the captured relationships. Thus, we estimated three-level random intercept models with the nesting structure displayed in (Level 1: social interactions, Level 2: unique interaction partners, Level 3: participants). By considering the unique interaction partners as a separate level, we can control for the nesting of social interactions within specific interaction partners.
In a stepwise approach, we build a three-level linear regression model for each dependent variable (i.e., “Feeling Respected,” “Closeness & Emotional Security,” and “Trustworthiness & Advice Seeking”) to see if there were differences in relationship quality between the two sampling designs. The main predictor of interest to answer RQ2b was the effect of condition (Level 3). We further considered relevant variables (Level 2: social role of the interaction partner, Level 3: sex and age of the participant) and interactions between these variables and conditions.Footnote3
For one specific part of the sample (i.e., one semester) all social roles of interaction partners are missing. We created a social role category “missing,” which can be considered an average across social roles, assuming that the students from the semester with missing social roles are comparable to students from the other semesters.Footnote4 With this strategy, it was possible to use all available data and investigate whether there is a bias in our outcome variables for interaction partners with missing social role information.
RQ3: Differences in the quality of captured social interactions
Lastly, we were interested to see whether and how the quality of reported social interactions differs between the event- and signal-contingent sampling design. For this we also estimated three-level linear regression models (Level 1: social interactions, Level 2: unique interaction partners, Level 3: participants) for each interaction quality rating (i.e., self and other’s warmth, self and other’s dominance, and affect) as a separate dependent variable. Starting from empty models, we added predictors in a stepwise manner. The main predictor of interest was condition (Level 3). We further considered relevant variables on all three levels (Level 1: timing of the social interaction represented by dummy variables covering 3-h time blocks, Level 2: social role of the interaction partner, Level 3: sex and age of the participant) and interactions between these variables and condition.
Exploratory analyses: How important is modeling “with whom”?
Novel in our analyses is that we examine ESM social interaction data while taking into account with whom an interaction took place (i.e., the unique interaction partner or the social role of the interaction partner). Thus, we were specifically interested in finding out what the added value of explicitly modeling unique interaction partners as nesting level or including social roles as predictors is. For this purpose, we examined the intraclass correlations (ICCs) on Level 2 and Level 3 in the models for RQ2b and RQ3. The ICCS indicates how much dependence there is between interactions of the same participant with the same interaction partner (Level 2) relative to the dependence between interactions by the same participant (Level 3). Moreover, we calculated the proportion of explained variance by the social role dummies and the dummy variables modeling the time of the day (see Snijders & Bosker, Citation2011). This will give us a direct comparison between the importance of including time and including social roles when modeling social interaction outcomes (i.e., relationship and interaction quality).
Results
Due to space restrictions, we only report descriptives and analyses directly relevant to our main research questions. Additional descriptives, visualization, and explorations of the data, as well as all modeling steps, can be found on our OSF repository. We further refrain from in-depth interpretation of the effects of control variables.
Descriptive statistics
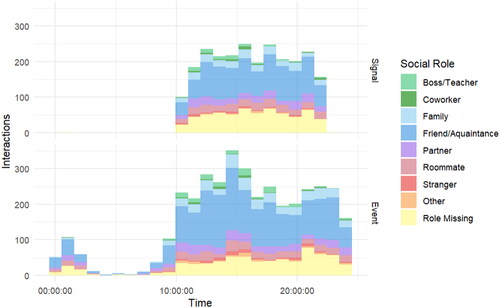
Participants reported on average 23.24 (SD = 12.95) social interactions over the seven days of the study, with an average of 12.49 (SD = 6.39) different interaction partners. displays the timing of interactions over the course of the day split by condition and split by social role. As anticipated given the design, participants in the signal-contingent condition mainly reported interactions between 10 am and 10 pm Participants in the event-contingent condition also reported interactions during the late evening and night, despite being instructed to also constrain reporting to 10 am to 10 pm These nighttime interactions—only captured by the event-contingent design—take place mainly with friends, partners, and roommates.
Figure 3. Timing of interactions split by condition and social role of the interaction partner.
Do the conditions differ in the number of unique interaction partners? (RQ1)
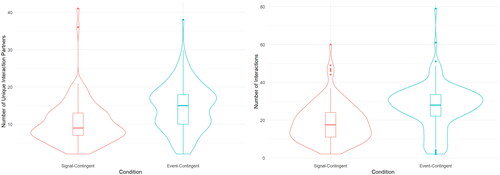
Based on visual exploration, more social interactions, and more unique interaction partners were captured in the event-contingent condition (see ). A t-test on the raw number of unique interaction partners shows that indeed significantly more interaction partners were captured in the event-contingent condition [Signal Contingent M = 10.32, Event-Contingent M = 14.53; t(df) = −5.73 (266.62), p < 0.001]. However, when adjusting the number of interaction partners for the number of reported interactions a participant had, the two conditions are not significantly different [Signal Contingent M = 0.60, Event-Contingent M = 0.58; t(df) = 1.11 (257.86), p = 0.27]. Thus, the reporting rate of unique interaction partners does not seem not to differ between conditions.
Figure 4. Number of interactions and number of unique interaction partners split by condition.
Do the conditions differ in the reporting rates of social roles of interaction partners? (RQ2a)
displays the counts of unique interaction partners of a certain social role split by condition. Students reported most interactions with friends/acquaintances, followed by family members. A large portion of social roles is missing due to the earlier described data loss. Given that participants in the event-contingent condition reported more social interactions, the counts for almost all social roles are higher in the event-contingent condition. However, the differences are not equally large for each role (e.g., the difference in counts of partners is very small while the difference in count of friends is larger). This indicates that there may be a difference in which kinds of interaction partners are captured with the two sampling designs. The table further shows the mean rate of interactions with a certain social role. These mean rates were computed across participants from the subsample with complete social role data split by condition. Thereby, the rate is the count of unique interactions partners of a given role divided by the total number of interactions a participant had. It thus presents a measure that corrects for the larger number of opportunities to encounter interaction partners (i.e., the larger number of captured social interactions) in the event-contingent condition and allows for a fairer comparison of the two conditions. Based on these “corrected counts” the differences between the two designs become smaller for some social roles (e.g., bosses/teachers and friends), meaning that the two designs capture these roles at a similar rate.
Table 1. Descriptive statistics of count and rate of unique interaction partners of a certain social role split by condition.
The results of the two-level negative binomial models of the reporting rates are shown in . This model tests the differences in social role reporting rates between the two sampling designs. Given that the model contains no intercept, the main effects of the social roles indicate the expected rate for the respective social role on the log scale. The estimated average rate of interaction partners per reported social interaction of the category friend/acquaintance for participants in the signal-contingent condition for instance is = 0.33. The rate is highest for friends and lowest for partners, meaning that friends are the most prevalent social role reported and partners the least. To answer our research question, we need to consider the interaction effects of social roles and conditions, as these indicate whether the two conditions differ in the reporting rate of a certain interaction partner role. The two largest interaction effects we find are between condition and coworker (
= 0.54) as well as condition and roommate (
= 0.66). Both indicate that the event-contingent condition has a significantly lower reporting rate of coworkers and roommates than the signal-contingent condition. For the other social roles, however, there were only small and non-significant differences in the reporting rates between the event and signal condition.
Table 2. Negative binomial random-intercept models with social roles nested in participants.
Do the conditions differ in the quality of relationships with captured interaction partners? (RQ2b)
shows descriptive statistics of the relationship quality ratings split by condition and social role of the interaction partner. Social roles differ in their relationship quality ratings as one would expect (e.g., participants rated family, partner, and friends as the highest quality relationships). Particularly the Closeness & Emotional Security ratings are different between the social roles. Differences between the two sampling designs are less clear: Some social roles (bosses/teachers, coworkers, family members, partners) are rated higher in the event-contingent condition than the signal-contingent condition, while for other role categories (friends/acquaintances, roommates, strangers, others, missing) the opposite is the case.
Table 3. Means (standard deviations) of outcome variables split by condition and social role.
The results of the final three-level models with the three relationship quality ratings as outcomes are presented in .Footnote5 The main effects of the condition show that there are no significant differences between the event- and signal-contingent conditions in relationship quality for the reference category (i.e., friends). The significant main effects of social roles indicate differences between the role in question and the reference category (i.e., friends) in the signal-contingent condition: Bosses/teachers, coworkers, strangers, and others were rated significantly lower than friends/acquaintances, confirming the general definitions of these social roles as being less close than friends. Family members and partners were rated significantly higher than friends.
Table 4. Final three-level random-intercept models for relationship quality ratings.
When looking more closely at the interactions between condition and social roles, some differences between the sampling designs can be observed: The significant interaction between the category boss/teacher and condition for “Feeling Respected” indicates, for example, that the “Feeling Respected” ratings of bosses/teachers are lower compared to friends in the event-contingent condition, while in the signal-contingent condition bosses/teachers are rated higher than friends. The same pattern holds for coworkers. The positive interaction parameter estimates between family and condition—that are significant for all relationship quality ratings—imply that the higher ratings of family members (compared to friends) in the signal-contingent condition are amplified in the event-contingent condition. The interaction between stranger and condition highlights the significantly lower “Closeness & Emotional Security” ratings of strangers vs. friends in the event-contingent condition, compared to the already lower ratings in the signal contingent condition. A similar, but less extreme pattern holds for the interaction between condition and stranger with regards to “Feeling Respected.” Thus, the two sampling schemes differ in the quality of captured relationships for interaction partners of specific social roles (i.e., bosses, family members, and strangers).
Do the conditions differ in the quality of momentary social interactions? (RQ3)
shows descriptive statistics of the interaction quality ratings split by condition and social role of the interaction partner. No clear patterns differentiating the two conditions can be observed.
The three-level random-intercept models with social interactions on Level 1, interaction partners on Level 2, and participants on Level 3 can be found in (for dominance/submission and warmth/cold) and (for affect).Footnote6 To answer our third research question, we examine the main and interaction effects of the condition. There is no significant main effect of the condition for any of the outcomes. The results show several large, significant main effects of the social role of the interaction partner, all in a direction as one would expect (e.g., social interactions with romantic partners were rated significantly warmer from both sides than interactions with friends).
Table 5. Three-level random-intercept models for interaction quality.
Table 6. Final three-level random-intercept models for affect.
Whereas the main effects for self- and other-ratings are in the same direction (i.e., either positive or negative) for the warm/cold interaction quality dimension, for the dominance/submission dimension they are in the opposite direction for almost all social roles (compared to friends). For both dimensions, the accompanying interaction effects are mostly in the same direction, pointing to larger differences between the social roles (compared to friends) in the event-contingent condition (compared to the signal-contingent condition). The largest—negative—difference between the signal-contingent and the event-contingent condition is found for the dominance/submission self-rating with strangers. There are a few other significant interactions between condition and social role. For example, in the event-contingent condition, the difference between the warmth ratings of family members and friends is approximately twice as large as in the signal-contingent condition. Thus, the two sampling schemes differ in the quality of captured momentary social interactions for interaction partners of specific social roles, particularly strangers.
Exploratory analyses: How important is modeling “with whom”?
Intraclass correlation coefficients relationship quality (RQ2b) and interaction quality (RQ3)
shows the intraclass correlation coefficients (ICCs) for the empty models with a three-level structure (Level 1: social interactions, Level 2: unique interaction partners, Level 3: participants) and each relationship and social interaction quality rating as an outcome (Snijders & Bosker, Citation2011). The ICCs provide evidence for the dependence of relationship quality ratings with the same interaction partner, reported by the same participant which underscores the importance of a three-level modeling approach, including the level of unique interaction partners (Level 2 ICC between 0.7 and 0.82). Moreover, the ICCs indicate the relative importance of the unique interaction partner level when compared with the participant level (Level 3 ICC between 0.16 and 0.37). Note that “Feeling Respected” shows a less extreme pattern in the ICC compared to the other two relationship quality ratings, with a much higher correlation on the participant level than the others. This indicates that “Feeling Respected” differs more between respondents than the other two relationship quality ratings.
Table 7. Intra class correlation coefficients for the empty 3-level models of relationship quality and interaction quality.
The ICCs of the empty models for the five interaction quality measures indicate that for the interaction quality ratings in contrast to the relationship quality ratings there is more dependence attributed to the participant level (Level 3 ICC between 0.51 and 0.87). This is especially the case for negative affect ratings. There is, however, still considerable dependence on the quality of interactions within a unique interaction partner (Level 2 ICC between 0.37 and 0.52).
Variance explained by time and social role
shows the proportion of explained variance in the relationship and interaction quality variables (outcomes RQ2b and RQ3) that can be attributed to either variables modeling time or modeling social role. Social role explains a considerable portion of the variance in the three relationship quality ratings (between 7.6 and 20.5%), which suggests that social role is an important predictor when studying relationship quality. With regards to the interaction quality ratings, less variance is explained by social role (between 2.1 and 4.0%). In general, it appears that social role variables were more important predictors than the time variables (explaining between 0.0 and 0.2% of the outcome variance) when modeling the social interaction data.
Table 8. Proportion of explained variance by time blocks and social roles.
Discussion
We used previously collected data on daily social interactions in a student sample (Himmelstein et al., Citation2019) to investigate differences between signal- and event-contingent sampling designs of experience sampling data in (1) the number of interaction partners that are captured, (2) the kinds of captured interaction partners (i.e., social role and relationship quality), and (3) the quality of interactions (i.e., warmth, dominance, negative affect, positive affect) taking into account that they take place with a specific interaction partner. Furthermore, we quantified the importance of modeling with whom a social interaction took place by examining the intraclass correlations (ICCs) attributed to the interaction partner level as well as the variance explained by the social role of an interaction partner.
As expected, event-contingent sampling captured more social interactions and thereby also more unique interaction partners (i.e., a larger absolute data quantity). The numbers of captured social interactions and unique interaction partners are, however, in proportion to each other, so that the reporting rate (i.e., the relative data quantity) of unique interaction partners is similar between the two conditions (RQ1). When examining what kinds of interaction partners are captured with the two sampling designs, we found that also here the relative data quantity is similar. For most social roles the reporting rate, so the number of captured interactions with a specific role relative to the total number of captured interactions, is similar. However, in event-contingent condition, the rate at which we captured coworkers and roommates, is lower than in the signal-contingent condition (RQ2a). Regarding relationship quality (RQ2b) and the quality of social interactions (RQ3), a pattern emerged when considering the interaction effects of condition and social role: The large and significant interactions indicate differences between the conditions in how specific social roles, such as family members or strangers, are rated in terms of relationship and interaction quality. While in many regards the two sampling schemes appear to be comparable, there seem to be differences in how they capture emotionally close or self-selected interaction partners (friends) in contrast to more distant or routine interaction partners (coworkers, roommates, strangers). These effects are impacting broader relationship quality ratings more so than quality ratings of momentary social interactions.
Leertouwer et al. (Citation2021) suggest that the assessments with the two sampling designs differ in the extent to which they represent the remembering self (i.e., a biased summary of past experiences) vs. the experiencing self (i.e., the current moment) of participants. A signal-contingent design that asks to report on a limited number of interactions since the last beep is by definition closer to the remembering self and may lead participants toward providing a biased default quality rating especially for more routinely encountered (i.e., less memorable) social roles, such as coworkers or strangers. In the present dataset, the by far most prevalent social role was friends/acquaintances. All other social roles could be considered “rare” in this case. An event-contingent sampling design requires participants to self-monitor their behavior more closely as they need to initiate assessments themselves. Thereby it leads to capturing more social interactions in absolute numbers (i.e., counts), including more instances of social interactions with distant social roles. Thus, despite fewer reports of rare social roles in relative terms (i.e., lower rates or proportions), event-contingent sampling may provide a more fine-grained assessment of interactions with these social roles. The observed subtle differences between the two sampling schemes for specific social roles may be rooted in the fact that fewer instances are captured when sampling in a signal-contingent manner and that participants’ recollections of these interactions may be somewhat biased.
Most importantly, our analyses highlight that it is insightful to use three-level models including the interaction partner level to account for the dependence between interactions within unique interaction partners. Our results show that when modeling social interactions, the social interactions of a participant that take place with the same interaction partner are more similar to each other than social interactions with different interaction partners (i.e., there is considerable dependence between interactions with the same partner).
Moreover, our analyses showed that including the social role of interaction partners when analyzing social interactions is important. The social role of the interaction partner was a robust predictor in all our analyses explaining between 7.6 − 20.5% of the total variance. These findings are in line with previous research highlighting the association between interaction partner characteristics, such as social role and participants’ interpersonal behaviors (Moskowitz et al., Citation1994; Suh et al., Citation2004).
Interestingly, modeling the timing of social interaction observations (with dummies that represent 3-h time blocks of the day) did not improve our models significantly in terms of explained variance. This suggests that the effect of social roles might dominate the differences observed across various timings. Thus, when wanting to examine the quality of social interactions it matters more whether one interacted with a family member or a coworker as opposed to whether it was morning or afternoon when this interaction took place.
Besides highlighting the importance of information about an interaction partner, our results add nuance to the conclusion made by Himmelstein et al. (Citation2019) that event- and signal-contingent experience sampling may be used interchangeably to capture the quality of social interactions. In terms of relative numbers (i.e., the reporting rates of social interactions with different social roles) the two sampling schemes deliver mostly similar data. The data, however, differs not only in the absolute quantity of captured interactions (and unique interaction partners) but in the granularity of relationship and interaction quality ratings of less frequently encountered social roles. The event-contingent design captures more interactions and thereby also more interactions with distant social roles providing a more fine-grained picture of these interaction instances. Since signal-contingent sampling captures fewer social interactions, differences between the frequency and ratings of the interactions with more distant interaction partners may not be captured to the same extent as with event-contingent sampling.
Commonly used signal-contingent sampling designs capture not only fewer interactions but also specifically do not capture social interactions late in the evening or at night, which may shift the representation of social interaction with interaction partners of a given social role. This may not have severe effects on data quality in a student sample where a less clear day structure is present (i.e., often no regular 9 to 5 working hours) and social life is generally structured differently than in later life phases (Litwin & Stoeckel, Citation2013). There may, however, be different patterns in other populations, such as a general population with more regular working hours.Footnote7
Thus, when considering the choice for either signal- or event-contingent experience sampling, the research question and the population of interest is important. If a researcher aims to capture all social interactions and the full social life of a participant or is specifically interested in interactions with less frequently encountered social roles, then event-contingent sampling may be most appropriate. Signal-contingent sampling schemes tailored to the day structure of each participant, or a combination of the two sampling designs, may be feasible alternatives as well but need further investigation. When a researcher is only interested in overall interaction quality or in interactions with frequently encountered social roles, such as friends, then a common signal-contingent design (e.g., six prompts between 10 am and 10 pm) is sufficient.
Limitations and future directions
The current analyses come with several limitations: As mentioned above, our data was collected in a student sample, which has a specific day structure and organization of social life that influences the results. While the effects we found seem to not be strong in student samples, they may be more impactful when being interested in the general population which, as mentioned, needs further investigation.
Furthermore, collecting the initials of the interaction partner did not always allow for straightforward matching of social interactions with the same interaction partner. The variable needed some manual correction and some observations needed to be excluded due to ambiguity. Additionally, there are unique interaction partners with the same initials that could only be distinguished based on social role in this sample. Still, it is likely that there are also interaction partners with the same social role and the same initials (e.g., two friends with the initials MS).
Despite some ambiguities in defining unique interaction partners, our analyses highlight the importance of considering the interaction partner level when analyzing social interaction data. To include the interaction partner level or at least the social role of the interaction partners in future analyses, information on this level should be collected. Assessing the initials of interaction partners has shown some important disadvantages: Two interaction partners may have the same initial and participants often switch answering styles. Future studies should consider assessing full names, nicknames, or the first name and the initial of the last name, as this would allow for clearer matching. However, asking participants to type a name or initials and assessing conceptually rather stable relationship quality ratings at every social interaction creates an unnecessary burden for the participant. An even better option may be to assess a personal network (Perry et al., Citation2018; Stadel et al., Citation2022) before an experience sampling study and then let participants pick their interaction partner from the list of network members or add new ones. This topic, however, warrants further research regarding its practical implementation and feasibility, which is currently in progress (see Stadel & Stulp, Citation2022).
Lastly, to date, there is only one dataset specifically contrasting social interactions captured with event-contingent vs. signal-contingent sampling (Himmelstein et al., Citation2019). Replication of the present results in different samples and with different signal-contingent schemes (e.g., a larger sampling window or more prompts per day) is warranted. Similarly, within-subject studies exploring both sampling designs are needed.
Conclusion
Our analyses highlight that distinguishing between unique interaction partners, or at least between interaction partners of different social roles, is important when collecting and analyzing social interaction data. We showed and discussed different ways in which this can be done. Further, we observed subtle differences between event- and signal-contingent sampling of social interactions in daily life: (1) Event-contingent sampling captures more social interactions and interaction partners in absolute numbers. However, in terms of relative numbers, the two sampling schemes deliver very similar data for most social roles. (2) Quality ratings of relationships and momentary social interactions with infrequently encountered social roles are impacted by the sampling design. This may be due to the fact that event-contingent sampling simply provides a larger absolute data quantity and thereby a more fine-grained picture of rare events.
Article information
Conflict of interest disclosures: Each author signed a form for disclosure of potential conflicts of interest. No authors reported any financial or other conflicts of interest in relation to the work described.
Ethical principles: The authors affirm having followed professional ethical guidelines in preparing this work. These guidelines include obtaining informed consent from human participants, maintaining ethical treatment and respect for the rights of human or animal participants, and ensuring the privacy of participants and their data, such as ensuring that individual participants cannot be identified in reported results or from publicly available original or archival data.
Funding: This work was supported by Grant PZ00P1_208742 from the Swiss National Science Foundation (SNSF).
Role of the funders/sponsors: None of the funders or sponsors of this research had any role in the design and conduct of the study; collection, management, analysis, and interpretation of data; preparation, review, or approval of the manuscript; or decision to submit the manuscript for publication.
Acknowledgments: The authors would like to thank Gert Stulp for his comments on prior versions of this manuscript. The ideas and opinions expressed herein are those of the authors alone, and endorsement by the authors’ institutions or the funding agency is not intended and should not be inferred.
Open Scholarship
![]()
This article has earned the Center for Open Science badges for Preregistered. The materials are openly accessible at https://osf.io/yr563.
Supplemental Material
Download Zip (2.2 MB)Data availability statement
Data can be requested from Aidan G. C. Wright.
Notes
1 Data access can be requested by contacting A. G. C. Wright.
2 All four modelling approaches (Poisson, zero-inflated Poisson, negative binomial and zero-inflated negative binomial) lead to the same main conclusions. All analyses and results can be found in our analysis script on OSF.
3 Control variables (i.e., sex and age) as well as interactions with control variables were only retained in the final model if they significantly improved deviance.
4 Modeling the missing category versus all the other social roles as well as the interaction with this category and condition for each dependent variable confirmed this assumption as there were no significant effects (see supplementary materials on our OSF repository).
5 Note that no parameters for time (block) are included in the final model. This is because the relationship quality ratings are relatively stable over time, as is also indicated by the relatively low residual variance at level 1 in the three analyses.
6 Interestingly, adding variables capturing the timing of interactions (modeled as dummies for three-hour time blocks) did not improve deviance significantly and none of the time blocks was a significant predictor in any of the fully specified models, thus our final models do not explicitly model time.
7 For further sample evaluation and constraints on generality please refer to Himmelstein et al. (Citation2019).
References
- Achterhof, R., Kirtley, O. J., Schneider, M., Hagemann, N., Hermans, K. S. F. M., Hiekkaranta, A. P., Lecei, A., Decoster, J., Derom, C., De Hert, M., Gülöksüz, S., Jacobs, N., Menne-Lothmann, C., Rutten, B. P. F., Thiery, E., van Os, J., van Winkel, R., Wichers, M., & Myin-Germeys, I. (2022). General psychopathology and its social correlates in the daily lives of youth. Journal of Affective Disorders, 309, 428–436. https://doi.org/10.1016/j.jad.2022.04.147
- Akker, O. v d., Weston, S. J., Campbell, L., Chopik, W. J., Damian, R. I., Davis-Kean, P., Hall, A., Kosie, J., Kruse, E., Olsen, J., Ritchie, S. J., Valentine, K. D., Veer, A. v’., & Bakker, M. (2019). Preregistration of secondary data analysis: A template and tutorial. PsyArXiv. https://doi.org/10.31234/osf.io/hvfmr
- Brown, L. H., Strauman, T., Barrantes-Vidal, N., Silvia, P. J., & Kwapil, T. R. (2011). An experience-sampling study of depressive symptoms and their social context. The Journal of Nervous and Mental Disease, 199(6), 403–409. https://doi.org/10.1097/NMD.0b013e31821cd24b
- Cutrona, C. E., & Russell, D. W. (1987). The provisions of social relationships and adaptation to stress. Advances in Personal Relationships, 1(1), 37–67.
- Dawood, S., Hallquist, M. N., Pincus, A. L., Ram, N., Newman, M. G., Wilson, S. J., & Levy, K. N. (2020). Comparing signal-contingent and event-contingent experience sampling ratings of affect in a sample of psychotherapy outpatients. Journal of Psychopathology and Behavioral Assessment, 42(1), 13–24. https://doi.org/10.1007/s10862-019-09766-7
- Dimotakis, N., Scott, B. A., & Koopman, J. (2011). An experience sampling investigation of workplace interactions, affective states, and employee well-being. Journal of Organizational Behavior, 32(4), 572–588. https://doi.org/10.1002/job.722
- Elmer, T., Geschwind, N., Peeters, F., Wichers, M., & Bringmann, L. (2020). Getting stuck in social isolation: Solitude inertia and depressive symptoms. Journal of Abnormal Psychology, 129(7), 713–723. https://doi.org/10.1037/abn0000588
- Gelman, A., & Hill, J. (2006). Data analysis using regression and multilevel/hierarchical models. Cambridge University Press.
- Hilbe, J. M. (2011). Negative binomial regression. Cambridge University Press. https://doi.org/10.1017/CBO9780511973420
- Himmelstein, P. H., Woods, W. C., & Wright, A. G. C. (2019). A comparison of signal- and event-contingent ambulatory assessment of interpersonal behavior and affect in social situations. Psychological Assessment, 31(7), 952–960. https://doi.org/10.1037/pas0000718
- Kaurin, A., Pilkonis, P. A., & Wright, A. G. (2022). Attachment manifestations in daily interpersonal interactions. Affective Science, 3(3), 546–558. https://doi.org/10.1007/s42761-022-00117-6
- Kopala-Sibley, D. C., Zuroff, D. C., Russell, J. J., Moskowitz, D. S., & Paris, J. (2012). Understanding heterogeneity in borderline personality disorder: Differences in affective reactivity explained by the traits of dependency and self-criticism. Journal of Abnormal Psychology, 121(3), 680–691. https://doi.org/10.1037/a0028513
- Leertouwer, I., Cramer, A. O. J., Vermunt, J. K., & Schuurman, N. K. (2021). A review of explicit and implicit assumptions when providing personalized feedback based on self-report EMA data. Frontiers in Psychology, 12, 764526. https://doi.org/10.3389/fpsyg.2021.764526
- Litwin, H., & Stoeckel, K. J. (2013). Social networks and subjective wellbeing among older Europeans: Does age make a difference? Ageing and Society, 33(7), 1263–1281. https://doi.org/10.1017/S0144686X12000645
- Metricwire Inc. | Real-World Data | Real-Life Impact (2022). Metricwire Inc. Retrieved October 6, 2022, from https://metricwire.com/
- Moskowitz, D. S., Suh, E. J., & Desaulniers, J. (1994). Situational influences on gender differences in agency and communion. Journal of Personality and Social Psychology, 66(4), 753–761. https://doi.org/10.1037/0022-3514.66.4.753
- Myin-Germeys, I., & Kuppens, P. (2021). The open handbook of experience sampling methodology: A step-by-step guide to designing, conducting, and analyzing ESM studies. Center for Research on Experience Sampling and Ambulatory Methods.
- Othman, S. A. (2014). Comparison between models with and without intercept. General Mathematics Notes, 21, 118–127.
- Perry, B. L., Pescosolido, B. A., & Borgatti, S. P. (2018). Egocentric network analysis: Foundations, methods, and models. Cambridge University Press. https://doi.org/10.1017/9781316443255
- Silva, P. J., & Cotter, K. N. (2021). Researching daily life (1st ed.). American Psychological Association; JSTOR. http://www.jstor.org.proxy-ub.rug.nl/stable/j.ctv1jbzccb
- Snijders, T. A. B., & Bosker, R. J. (2011). Multilevel analysis: An introduction to basic and advanced multilevel modeling. SAGE.
- Stadel, M., & Stulp, G. (2022). Balancing bias and burden in personal network studies. Social Networks, 70, 16–24. https://doi.org/10.1016/j.socnet.2021.10.007
- Stadel, M., Langener, A., Elmer, T., Bringmann, L., & Stulp, G. (2022). Testing methods to capture social context. https://osf.io/jqdr9/
- Stadel, M., Stulp, G., Langener, A. M., Elmer, T., van Duijn, M. A. J., & Bringmann, L. F. (2023). Feedback about a person’s social context—Personal networks and daily social interactions. Administration and Policy in Mental Health Services Research. https://doi.org/10.1007/s10488-023-01293-8
- Suh, E. J., Moskowitz, D. S., Fournier, M. A., & Zuroff, D. C. (2004). Gender and relationships: Influences on agentic and communal behaviors. Personal Relationships, 11(1), 41–60. https://doi.org/10.1111/j.1475-6811.2004.00070.x
- Watson, D., & Clark, L. A. (1994). The PANAS-X: Manual for the positive and negative affect schedule-expanded form. The University of Iowa. https://doi.org/10.17077/48vt-m4t2
- Weston, S. J., Ritchie, S. J., Rohrer, J. M., & Przybylski, A. K. (2019). Recommendations for increasing the transparency of analysis of preexisting data sets. Advances in Methods and Practices in Psychological Science, 2(3), 214–227. https://doi.org/10.1177/2515245919848684
- Woods, W. C., Edershile, E. A., Sharpe, B. M., Ringwald, W. R., Himmelstein, P. H., Newman, M. G., Wilson, S. J., Ellison, W. D., Levy, K. N., Pincus, A. L., Creswell, J. D., & Wright, A. G. C. (2022). Psychometric evaluation of a visual interpersonal analogue scale. PsyArXiv. https://doi.org/10.31234/osf.io/h9bmy