
ABSTRACT
Many efforts have been made to select and isolate naturally occurring animal-friendly Epichloë strains for later reinfection into elite cultivars. Often this process involves large-scale screening of Epichloë-infected wild grass populations where strains are characterized and alkaloids measured. Here, we describe for the first time the use of genotyping-by-sequencing (GBS) on a collection of 217 Epichloë-infected grasses (7 S. arundinaceum, 4 L. perenne, and 206 S. pratensis). This genotyping strategy is cheaper than complete genome sequencing, is suitable for a large number of individuals, and, when applied to endophyte-infected grasses, conveniently genotypes both organisms. In total, 6273 single nucleotide polymorphisms (SNPs) in the endophyte data set and 38 323 SNPs in the host data set were obtained. Our findings reveal a composite structure with three distinct endophyte clusters unrelated to the three main S. pratensis gene pools that have most likely spread from different glacial refugia in Eurasia. All three gene pools can establish symbiosis with E. uncinata. A comparison of the endophyte clusters with microsatellite-based fingerprinting of the same samples allows a quick test to discriminate between these clusters using two simple sequence repeats (SSRs). Concentrations of loline alkaloids and mycelial biomass are correlated and differ significantly among the plant and endophyte subpopulations; one endophyte strain has higher levels of lolines than others, and one specific host genotype is particularly suitable to host E. uncinata. These findings pave the way for targeted artificial inoculations of specific host-endophyte combinations to boost loline production in the symbiota and for genome association studies with the aim of isolating genes involved in the compatibility between meadow fescue and E. uncinata.
INTRODUCTION
Many species of the subfamily Pooideae (family Poaceae), including turf and forage grasses such as perennial ryegrass (Lolium perenne), tall fescue (Schedonorus arundinaceus = Lolium arundinaceum, previously Festuca arundinacea), and meadow fescue (Schedonorus pratensis = Lolium pratense, previously Festuca pratensis), form symbiotic associations with endophytic fungi of the genus Epichloë (Schardl et al. Citation2004). However, understanding the population structure of these endophytes can be challenging, with past studies largely limited to the resolution allowed by microsatellites. Here, for the first time, we apply genotyping-by-sequencing (GBS), a screening strategy that is cheaper than complete genome sequencing, can be extended to large sample sizes, and, when used on endophyte-infected grasses, conveniently genotypes both the endophyte and its grass host. GBS enables deep characterization of population structure, and its versatile marker catalog can be used to investigate the endophytes, their hosts, and their interactions.
The Epichloë endophytes themselves can be classified according to their transmission strategy: strictly asexual strains, which are vertically seed-transmitted from infected hosts; asexual strains, which are both vertically and horizontally transmitted; strictly sexual strains, which are only horizontally transmitted from one host to another; and sexual strains, which are both vertically and horizontally transmitted (Tadych et al. Citation2007, Citation2014). The majority of asexual Epichloë species studied to date have an allopolyploid genome resulting from the hybridization of two or more parental strains through vegetative hyphal fusion (Schardl et al. Citation1994). Epichloë spp. lack a vegetative incompatibility response that is usually triggered when hyphal fusion occurs between hyphae from two different species; therefore, the fused cell may survive and the nuclei eventually merge to form an allopolyploid. Vegetative hyphal fusion may occur either when sexual Epichloë are horizontally transferred to an already infected host or by coinfection of a novel host by two parental strains, which seems the most likely scenario (Shoji et al. Citation2015). The prevalence of hybrids among asexual species suggests a selective advantage, perhaps related to the interdependent fitness of the host and the endophyte when endophyte transmission is strictly vertical (Moon et al. Citation2004). Several Epichloë spp. have indeed been reported to increase plant persistence (Hill et al. Citation1991; West et al. Citation1993; Popay and Hume Citation2011). These endophytes also synthesize secondary metabolites that have been found to be toxic or deterrent against insects or mammalian herbivores. In this respect, hybridization can provide the endophyte with different combinations of alkaloid biosynthesis pathways, which can increase the level and types of secondary metabolites in the host. This, in turn, can improve the fitness of the host and consequently the fitness of the endophyte as well (Selosse and Schardl Citation2007). There are four main classes of secondary metabolites: loline alkaloids, indole diterpene alkaloids (lolitrems), ergot alkaloids, and peramine. Loline alkaloids and peramine have insecticidal and insect-deterrent properties, but no known effects on livestock, whereas indole diterpene alkaloids and ergot alkaloids have been found to be toxic against mammals, causing so called “ryegrass staggers” and “fescue toxicosis,” respectively (Panaccione et al. Citation2014).
Perennial ryegrass and tall fescue endophyte-infected (E+) cultivars have been used in agriculture for the last 20 years in areas with high pest pressure, such as New Zealand, Australia, and USA (Johnson et al. Citation2013). Nonallopolyploid Epichloë festucae var. lolii strains that naturally infect ryegrass usually produce peramine, ergot alkaloids, and indole diterpene alkaloids, whereas allopolyploid Epichloë coenophiala, isolated from tall fescue, produces peramine, lolines, and ergot alkaloids (Clay and Schardl Citation2002). Therefore, many efforts have been made to select and isolate naturally occurring livestock-friendly strains for later reinfection into elite varieties of grass hosts (Le Cocq et al. Citation2017). The use of Epichloë selected strains in non-native hosts is also a possibility when there are no compatibility issues (Leuchtmann Citation1992). Particularly interesting, in this respect, is Epichloë uncinata, an endophyte naturally occurring in S. pratensis, which only produces high levels of lolines in different forms: N-formylloline (NFL), N-acetylnorloline (NANL), and N-methylloline (NML) (Schardl et al. Citation2007). Interestingly, the synthesis of one form of loline, N-acetylloline (NAL), is host dependent. NAL is synthesized by acetylation of loline, an intermediate in the pathway from NANL to NFL, only in those plants that carry the necessary host-encoded acetyltransferase (Pan et al. Citation2014). Epichloë-infected S. pratensis does contain NAL, but when E. uncinata is inoculated into perennial ryegrass, the resulting symbiota lack NAL (Ball and Tapper Citation1999). E. uncinata is currently used in Festulolium cultivars, where it has shown to boost resistance against insects not only in the aerial parts of the plant but also in below ground tissues (Patchett et al. Citation2008; Barker et al. Citation2015a, Citation2015b).
To date, a large majority of studies investigating Epichloë phylogenies and genetic diversity have been based on isozymes (Leuchtmann Citation1994), amplified fragment length polymorphism (AFLP) (Tredway et al. Citation1999), microsatellite analysis (Moon et al. Citation1999; Cagnano et al. Citation2019), and informative gene sequences (Moon et al. Citation2007; Shi et al. Citation2017). Housekeeping genes such as the β-tubulin gene (tubB), the translation elongation factor gene (tefA), and the actin gene (actA) are commonly used for phylogenetic classification, whereas alkaloid genes are usually targeted to predict the alkaloid profile of an isolate (Kutil et al. Citation2007; Ekanayake et al. Citation2013; Takach and Young Citation2014). With the latest advances in next-generation sequencing technologies and their relatively low costs due to the small genome size of most Epichloë species (typically around 30–40 Mb for haploid species and 53 Mb for the E. uncinata hybrid studied here), whole genome sequences of several species have been published (Schardl et al. Citation2013) and used to address ecological and evolutionary questions (Schirrmann et al. Citation2018). Recently, the first complete genome assembly of an Epichloë species (Epichloë festucae Fl1) was finally obtained (Winter et al. Citation2018).
For this study, where many individuals are involved, complete genome sequence data are unnecessarily and prohibitively expensive. New methods that combine the advantages of high-throughput sequencing with the reduction of genome complexity through enzyme fragmentation, such as restriction site–associated DNA sequencing (RAD-seq) and related approaches, have been developed (Baird et al. Citation2008; Davey et al. Citation2011). Genotyping-by-sequencing (GBS), described by Elshire et al. (Citation2011), allows representative genetic variants such as single nucleotide polymorphisms (SNPs) to be discovered across the genome and, at the same time, to genotype many individuals at those loci. The approach sequences the same set of unbiased and untargeted regions in all samples. Since only a reduced representation of the genome is sequenced, cost and the computational demand of analysis is strongly reduced while a sufficient amount of the genome is captured to allow robust population genetic analysis. This method has been used for ecology and population genetic studies on animals, plants, and fungi (Deschamps et al. Citation2012; Corander et al. Citation2013; Jones et al. Citation2013; Narum et al. Citation2013; Sawler et al. Citation2015; Rafiei et al. Citation2018; Pina‐Martins et al. Citation2019) but has never been applied to Epichloë species.
In this study, we tested the power and the efficacy of GBS in investigating the genetic structure of Epichloë-infected grasses and explored the effect of host and endophyte population structures on observed concentrations of loline alkaloids and mycelium biomass.
MATERIALS AND METHODS
Plant and endophyte material
The samples for this study were a selection of 217 plants infected with Epichloë endophytes previously identified and characterized by Cagnano et al. (Citation2019) using an immunoblot assay to identify infection combined with seven microsatellites to identify the species. The data set included seven S. arundinaceum, four L. perenne, and 206 S. pratensis samples. Some of these plants were collected in wild and semiwild meadows; the remaining plants were accessions requested from the United States Department of Agriculture (USDA) and the Nordic Genetic Resource Centre (NordGen). A detailed summary of the plant material, the hosted endophytes, and the location of collections are provided in SUPPLEMENTARY TABLE 1. Biological replicates used as standards were also included to detect biases in the filtering process and the subsequent analysis.
Table 1. Reads sequenced and mapped for Epichloë-infected grasses genotyped by GBS.
DNA extraction and library preparation
Plant and endophyte genomic DNA was extracted from infected pseudostems on a Quadra 96 model 320 robotic system (Tomtec, Hamden, Connecticut) using the method described previously by Brazauskas et al. (Citation2011), normalized and digested with ApeKI (5-bp recognition site) and PstI (6-bp recognition site) restriction enzymes. In silico digestion with this combination of enzymes was tested on both the reference genomes beforehand with the R package SimRAD 0.96 (Lepais et al. Citation2014). Library preparation followed the protocol described by Elshire et al. (Citation2011) and Poland et al. (2012), with minor modifications. Libraries containing endophyte and host DNA were sequenced on the Illumina Hiseq4000 platform with SE100 reads by Beijing Genomics Institute (BGI Tech Solutions, Hongkong, China).
Draft assembly of the Schedonorus pratensis genome
The E. uncinata genome (Schardl et al. Citation2013; http://www.endophyte.uky.edu/; strain CBS 102646) was chosen as the endophyte reference genome. Because there is no published reference for S. pratensis, a draft genome was assembled to separate the endophyte and host reads for downstream analysis. High‐quality genomic DNA was isolated from leaves from a single genotype from endophyte-free S. pratensis cv Laura using cetyltrimethylammonium bromide (CTAB) extraction and passed through a DNeasy plant spin column (Qiagen, https://www.qiagen.com/) to remove contaminants.
Shotgun libraries with average insert sizes of 300 and 800 bp were prepared using the Illumina TruSeq PCR free library preparation kit (San Diego, California). Each library was sequenced in a single lane of an Illumina HiSeq 2500 as 100-bp PE reads. FastQC 0.11.5 was used to check for overall quality of the data (Andrews Citation2016), and Trimmomatic 0.32 was used to trim adaptors using default parameters (Bolger et al. Citation2014). ABySS 1.3.5 was used to assemble the draft genome (k-mer size 55) (Simpson et al. Citation2009).
Raw reads quality filtering and SNP calling
Raw Illumina DNA sequence reads from the 217 plants were first trimmed to remove adaptors using scythe 0.981 (https://github.com/vsbuffalo/scythe), then trimmed with sickle 1.33 (Joshi and Fass Citation2011) with the option “quality” set to 20. Reads shorter than 40 bp were discarded, and the remaining reads were demultiplexed using sabre 1.00 (https://github.com/najoshi/sabre), allowing no mismatches within the barcode. Finally, barcodes were trimmed off and the reads where shortened to give high-quality sequences of 90 bp with fastx_trimmer 0.7 (http://hannonlab.cshl.edu/fastx_toolkit/index.html).
Demultiplexed reads were mapped to the Epichloë uncinata and S. pratensis reference genomes using BWA 0.7.5 (Li and Durbin 2009). Variants were called using HaplotypeCaller, and SelectVariants was subsequently used to filter for biallelic sites and MQ30; both tools are part of GATK 3.2.2 (McKenna et al. Citation2010). Extensive exploratory tests of filtering parameters and inspection of preliminary results with principal component analysis (PCA) were made to empirically choose the best combination of parameters (minimum number of reads per locus, minimum percentage of individuals sharing a locus, minor allele frequencies) to preserve a consistent number of SNPs and a reliable and reproducible population structure. Loci present in at least 50% of the individuals with a minimum depth of coverage of 6 reads were selected using VCFtools 0.1.14 (Danecek et al. Citation2011). The plant host variants were also filtered with a minimum 5% minor allele frequency cutoff.
Loline alkaloids and mycelial biomass measurement
In March 2018, 182 of the genotyped endophyte-infected S. pratensis plants were cloned and propagated in pots (35 × 30 cm) with standard peat (En brown 06 W 30P; Kekkilä Group, Vantaa, Finland) and grown in a greenhouse with 16 light hours at approximately 15–24 C. In June 2018, samples from the basal part of the tiller were harvested and freeze-dried the same day and subsequently powdered in a laboratory mill. About 50 mg of each sample was sent in duplicate to AgResearch Grasslands (Palmerston North, New Zealand). Loline alkaloids N-formylloline (NFL), N-acetylloline (NAL), and N-acetylnorloline (NANL) were measured in all 182 samples using a gas chromatographic method described by Baldauf et al. (Citation2011). These plants have been described in Cagnano et al. (Citation2019).
The mycelial mass was additionally measured in 100 samples using an enzyme-linked immunosorbent assay (ELISA)-based analysis as described in Faville et al. (Citation2015).
Population differentiation
The software fastSTRUCTURE 1.0 (Raj et al. Citation2014) was used to estimate broad-scale population structure and admixture within the host SNP data set. The appropriate number of subpopulations was chosen by testing with default parameter K values ranging from 1 to 15 and subsequently running the algorithm chooseK. The fastSTRUCTURE program could not be used on the endophyte SNP data set because the assumption of random mating within populations was violated; we therefore used the algorithm find.clusters, part of the package adegenet 2.1.1 (Jombart et al. Citation2010) in the statistical software R 3.5.2 to determine the optimal number of clusters (K) based on the lowest Bayesian information criterion (BIC). Discriminant analysis of principal components (DAPC) was performed to determine and visualize groups of genetically related endophyte isolates. Guidelines provided by Jombart et al. (Citation2010) were followed to determine the optimal number of principal components (PCs) to be used in the analysis, using the function xvalDapc with 1000 replicates on a training set of 90% of the data. To confirm the allocation of individuals to clusters by DAPC analysis, results were also compared with principal coordinate analysis (PCoA) based on a genetic distance matrix calculated with the function bitwise.dist, designed to handle SNP data sets. Pairwise FST of all subpopulations was estimated with the R package StAMPP 1.5.1 (Pembleton et al. Citation2013), which allows for the computation of FST 95% confidence intervals (CIs) (10 000 bootstraps), since all FST values were associated with a probability value = 0, which expressed the probability of getting an FST value more extreme than the one observed. Since the bootstrap was set to 10 000, the P-value can be expressed as P < 0.0001.
Data analysis
The plant and endophyte SNP profiles were converted to FASTA format using the software SNPhylo 20141127 (Lee et al. Citation2014). Maximum likelihood (ML) phylogenetic trees were generated using the software MEGA X (Kumar et al. Citation2018) with default parameters and 1000 bootstrap replicates and edited in FigTree 1.4.4 (Rambaut 2009). To visualize host-endophyte associations, a tanglegram was generated in R from ML trees with the package dendextend 1.12.0 (Galili Citation2015). The quality of the alignment was then improved with the function untangle method “step2side,” which rotates the branches of the two trees until it finds the combination with the lowest entanglement value, a number used to quantify the degree of congruence between two trees. Values range from 0, when the labels perfectly match, to 1, when one tree is the complete reverse of the other tree. This value was measured with the function entanglement.
The number of endophyte and host mapped reads, the amount of loline alkaloids, and the amount of endophyte biomass did not satisfy assumptions of normal distribution; thus, nonparametric methods such as the Kruskal-Wallis one-way analysis of variance and Wilcoxon rank-sum tests were used to compare subpopulations, and Kendall’s rank correlation coefficient (τ) was used to estimate a rank-based measure of association.
Patterns of isolation by distance (IBD) and isolation by environment (IBE) were analyzed as described by Blanco‐Pastor et al. (Citation2019). The 19 environmental layers of biologically meaningful climate variables (BIO1–BIO19) were downloaded from WorldClim database version 2 (http://www.worldclim.org). Nei’s genetic distance was computed with the package StAMPP 1.5.1.
RESULTS
38000+ plant SNPs and 6000+ endophyte SNPs identified in infected plants
The mean number of quality-filtered sequence reads obtained per sample ranged between 1 570 456 and 24 790 897, with an average of 7 773 379 (95% CI: ±441 473; SD = 3 299 483; n = 217). DNA extraction was performed on stems with confirmed infection; therefore, reads for each sample included both plant and endophyte sequences. Reads were separated by mapping all samples against the S. pratensis and E. uncinata reference genomes; this choice was driven by the fact that 95% of the samples were S. pratensis infected with E. uncinata, and the remainder samples other Epichloë-infected grass species. On average, 52% of the total reads mapped successfully against the combined reference genomes, with unmapped reads reflecting missing genome reference data, particularly in the S. pratensis host.
As expected, there was disproportionate mapping between the endophyte and the plant reads: on average, 1.5% (95% CI: ±0.1%; SD = 0.9%; n = 217) of the total reads mapped against the endophyte reference, with values ranging from 0.1% to 5.4%, whereas 50.5% (95% CI: ±1.2%; SD = 9.3%; n = 217) mapped against the plant reference, with values ranging from 13.1% to 65.1%. The percentage of reads mapping to the grass references was slightly higher in infected S. pratensis samples, whereas for other plant species it was lower and fell into species-specific ranges that could be used as additional evidence of correct species assignment (). For the endophyte, the percentage of mapping reads was not found to vary significantly among Epichloë species due to the relatively low number of reads and the high variability in the total number of reads per sample.
The raw number of SNPs in the endophyte catalog, before any filter was applied, was 41 528. SNPs were filtered for coverage depth greater than 6 reads, keeping loci that occurred in at least 50% of the individuals, which led to the retention of 6273 SNPs, with an average of 3697 SNPs per sample (95% CI: ±173; SD = 1297; n = 217) and ranging from 1096 to 6240 SNPs. Filtering for minor allele frequency did not affect the population structure, but it strongly reduced the number of SNPs retained; therefore, it was not applied to this catalog. The number of retained SNPs drastically dropped down to 2159 when increasing the percentage of shared genotypes to 60%, to 505 SNPs at 70%, to 144 SNPs at 80%, and only 19 SNPs at 90%. Expectedly, the number of loci present in at least 50% of the individuals increased to 6654 when subsetting the E. uncinata–infected samples, with an average of 3948 SNPs per sample (95% CI: ±189; SD = 1373; n = 206) and ranging from 1307 to 6618 SNPs.
The plant catalog had 988 084 SNPs, of which 379 013 were retained after filtering for coverage depth greater than 6 reads and keeping variants that occurred in at least 50% of the individuals. SNPs were also filtered for a minimum minor allele frequency of 5%, which reduced the number of variants to 38 323. The average number of variants per sample was 30 824 (95% CI ± 534; SD = 3991; n = 217), ranging from 13 985 to 35 228, and decreased to 37 319 (95% CI: ±395; SD = 2876; n = 206) when subsetting the S. pratensis samples. These final SNP catalogs were used for all subsequent analysis.
E. uncinata genotypes divided into three distinct subpopulations
E. uncinata isolates (n = 206) were assigned using K-means clustering to three clusters (K = 3), on the basis of the lowest BIC value given by the function find.clusters. DAPC retained eight principal components (constituting 25.9% of the variance) and one discriminant function with 100% of successful reassignment of individuals to their clusters. Membership coefficients of the genotypes to each group ranged between 0.831 and 1, confirming that the population was structured with low rates of admixture. Individual-based principal component analysis (PCA) implemented in the R package adegenet (Jombart Citation2008) supported the K = 3 structure, grouping the samples into three clearly separated clusters (), with these clusters matching the earlier DAPC cluster assignment.
Figure 1. Geographic distribution of genetic clusters of 206 E. uncinata isolates. Colors reflect the clusters assigned by the Bayesian information criterion. Individuals were clearly assigned to one of the three clusters, and only a few individuals showed a low signal of admixture. Individual-based principal component analysis was obtained from 6654 genotyped SNPs. The first principal component axis (PC1) accounts for most of the intrapopulation variety (15.6%), the second principal component axis (PC2; 6.5%) allows a good separation of three clusters, named Eu_P1 (aquamarine), Eu_P2 (orange), and Eu_P3 (purple), and the third principal component axis (PC3; 2%) allows good isolation of Eu_P3 from the other clusters.
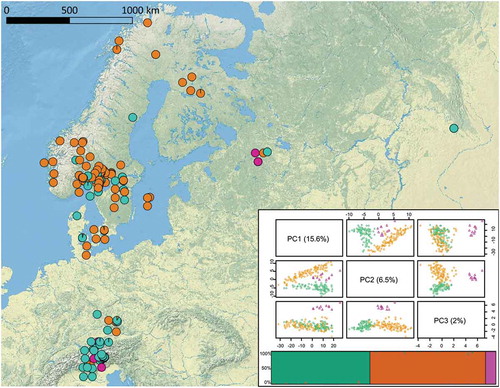
The purple cluster (Eu_P3) was the smallest of the three clusters with only 11 samples, six of them collected in Russia and the remaining five on the northern side of the Alps. Curiously, Eu_P3 was collected in seven locations, where at least one of the two other haplotypes was present, but it did not show any admixture with them. The orange cluster (Eu_P2) was the largest, with 105 isolates, 92% of which were collected in northern countries such as Denmark, Sweden, Norway, Finland, Russia, and northern Germany. Among the geographic outliers, five samples were collected in the area around Deggendorf (Germany), two were collected on the southern side of the Alps, in Italy, and the last was the United States Department of Agriculture (USDA) accession PI665564, described as collected in Kyrgyzstan. In contrast, the green cluster (Eu_P1) did not show a clear geographic pattern, since it was composed of isolates collected on the Italian and Austrian Alps, isolates collected in southern Germany, Denmark, Sweden, Norway, and Russia, and one accession from Kyrgyzstan. The multiple regression on distance matrices (MRM) analysis () revealed that both IBD and IBE did not play a significant role in differentiation of the E. uncinata (IBD model: r2 = 0.001, P = 0.46; IBE model: r2 = 0.0002, P = 0.62).
Pairwise FST of the three clusters was estimated with StAMPP and showed substantial differentiation among subpopulations, meaning that the allele frequencies of SNPs are quite different in each of them. Genetic distances among clusters were similar, although the distance was slightly lower for Eu_P1/Eu_P2 (0.172) compared with the differentiation with the third cluster: Eu_P1/Eu_P3 = 0.189, Eu_P2/Eu_P3 = 0.200.
To test whether there was any difference in the sequencing outcome between subpopulations, a Wilcoxon rank-sum test was performed. The number of reads mapped to the endophyte reference was higher in Eu_P1 than in Eu_P2 (P = 2 × 10⁻⁸), but the opposite trend was seen when considering the number of reads mapped to the plant reference (P = 2 × 10⁻³). Differences between Eu_P3 and the other two subpopulations were not significant ().
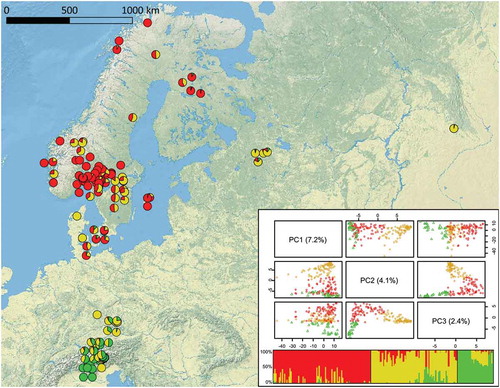
Figure 2. Geographic distribution of genetic clusters of 206 S. pratensis samples. Colors reflect the clusters found by the fastSTRUCTURE analysis. Individual-based principal component analysis obtained from 37 319 genotyped SNPs. Although the first principal component axis (PC1; 7.2%) does not allow a good discrimination of groups, plotting isolates using the second (PC2; 4.1%) and the third (PC3; 2.4%) axes groups them into three clusters, named Sp_P1 (red), Sp_P2 (yellow), and Sp_P3 (green).
Discrimination of GBS-defined subpopulations by multilocus microsatellite markers
Among the 206 E. uncinata isolates analyzed in this study through GBS, 170 were previously characterized by microsatellite genotyping (Cagnano et al. Citation2019), thus allowing the association of each subpopulation to a microsatellite profile.
Locus B10, extensively used in previous studies (Moon et al. Citation1999; Clayton et al. Citation2017), discriminated between the Eu_P1 isolates, which gave amplicons of 176/196 bp, and between Eu_P2 and Eu_P3 isolates, which had amplicons of 164/200 bp. Only three isolates included in Eu_P2 gave amplicons of 176/196 bp, and these outliers may be due to incorrect microsatellite scoring. Conversely, Eu_P2 isolates could be distinguished from the two other subpopulations through loci E_33 (326/335 bp) and E_39 (426/426 bp) because amplicons in Eu_P1 and Eu_P3 had different lengths (326/333 bp at E_33 and 421/426 bp at E_39).
Population structure in the grass host S. pratensis does not follow the same structure as associated endophytes
The population structure of S. pratensis was investigated using fastSTRUCTURE. The output showed that both the model complexity maximizing the marginal likelihood and the model components used to explain the structure in the data had an optimal K = 3. Different from the endophyte data set, there was no clear separation between subpopulations in the PCoA plot, rather a continuity of individuals. Samples falling between clusters also showed admixture in the bar plot. Individuals were assigned to a cluster when the membership coefficient at that cluster was greater than the others. The red cluster, Sp_P1, included 93 individuals collected in Fennoscandia. The gray cluster, Sp_P2, with 79 individuals, included samples with no geographic isolation collected in Italy, Austria, Scandinavia, and Russia. The green cluster, Sp_P3, was the smallest, with 34 plants collected in the Alps area across the border between Italy and Austria.
The pie charts on the map () show a gradient of genetic composition, from pure Sp_P3 individuals in Italy to increasing admixture percentages with Sp_P2 in Austria and southern Germany. In Scandinavia, the gradient was tilted from northwest, characterized by generally higher percentages of Sp_P1, to southeast, with increasing percentages of Sp_P2 admixtures.
Population structure was verified using the DAPC method and the function find.cluster. However, the lowest BIC value (1622.971) found using K-means clustering was at K = 2, although it was only slightly different than at K = 3 (1622.986) (). DAPC cross-validation resulted in four PCs and one discriminant axis (DAs) being retained. A comparison of the results of the two methods showed high matching for Sp_P1, with just five individuals (5.1%) assigned differently. These individuals showed admixture proportion of the two genotypes almost close to 0.5. Individuals assigned to Sp_P3 by fastSTRUCTURE were all assigned to cluster 2 in DAPC. This is consistent with the FST values, since Sp_P2 had analogous values compared with Sp_P1 (0.050) and Sp_P3 (0.053), regardless of whether Sp_P1 and Sp_P3 were more differentiated (FST = 0.096). Based on these results from PCoA, we decided to use the model K = 3. The MRM analysis () revealed that IBD played only a moderate role (r2 = 0.146, P = 0.01) in genetic differentiation of S. pratensis but with IBE playing no meaningful role at all (r2 = 0.003, P = 0.04).
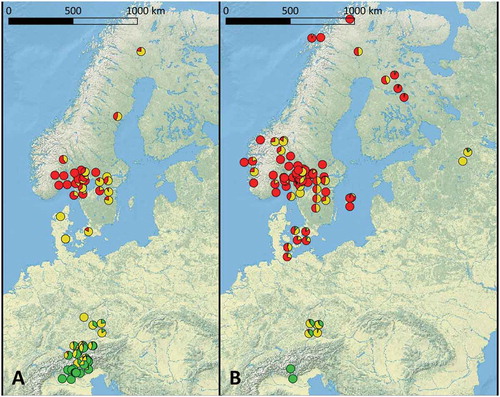
Figure 3. Geographic distribution of E. uncinata clusters. A. Eu_P1. B. Eu_P2. Pie charts show the level of admixture of the hosts according to the same colors shown in FIG. 2.
Endophyte subpopulation distribution more related to geography than host genetics
Considering the frequencies at which each subpopulation of E. uncinata occurs in each cluster of S. pratensis (), 78% of Sp_P1 individuals hosted Eu_P2 and the remaining hosted Eu_P1 but no Eu_P3, Sp_P2 showed a more balanced distribution of the hosted endophyte subpopulations, and 91.2% of the Sp_P3 individuals hosted Eu_P1. The maps () show how the occurrence of E. uncinata strains in S. pratensis subpopulations seem to follow a geographic trend rather than genetic cospeciation with a specific host genotype.
Table 2. Occurrence of endophyte strains in each S. pratensis subpopulation and total number of samples assigned to each subpopulation.
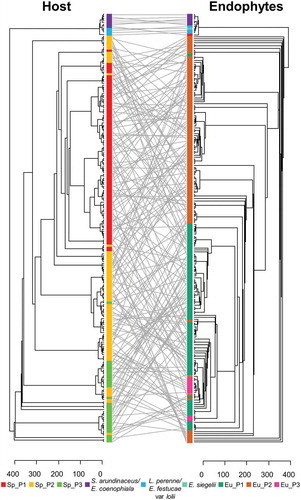
Phylogenetic relationships between the 217 plants and their Epichloë endophytes were analyzed by a maximum likelihood method (). Biological replicates used as standards were correctly grouped together in both cladograms. Labels of the two trees were connected using the function tanglegram, and branches were rotated with the function untangle, an algorithm that aims to reduce the entanglement factor to its minimum possible value (here, from 0.697 to 0.208). For S. pratensis and E. uncinata, there was overall good separation of the subpopulations, with limited discrepancies mostly due to the rearrangement of clades and to the different methods used to estimate genetic diversity. The tanglegram did not show any particular pattern of cospeciation between S. pratensis and E. uncinata, supporting the observation mentioned above. This result was confirmed by the MRM analysis performed on E. uncinata and S. pratensis (), showing no significant correlation between their genetic distances (r2 = 0.0003, P = 0.38).
Figure 4. Tanglegram of the maximum likelihood phylogenies of Epichloë endophytes and their grass hosts. Trees were obtained with the software MEGA X and edited with FigTree. Labels were connected using the function tanglegram from the package dendextend. Straight lines, showing endophyte and host grass matches in the phylogenies, connect S. arundinaceum and L. perenne individuals to their respective endophytes, i.e., E. coenophiala, E. festucae, and E. siegelii, which were infecting an elite perennial ryegrass cultivar. E. uncinata strains and S. pratensis subpopulations are marked with the same colors used in FIG. 1 and FIG. 2, respectively.
Significant differences in loline production related to endophyte subpopulations
In a previous study, we found (i) significant differences in the level of loline alkaloids expressed by different haplotypes and (ii) significant differences in the proportions of NAL, NANL, and NFL with the increase of total lolines (Cagnano et al. Citation2019). Given the association between haplotypes detected with microsatellites and subpopulations detected with GBS, we retested these findings using the GBS clusters. Levels of NAL, NANL, and NFL were measured in 182 genotyped samples (81 Eu_P1, 92 Eu_P2, 9 Eu_P3). Eu_P3 was the subpopulation with the higher average expression of lolines (mean = 2776 μg/g; 95% CI: ±668 μg/g; SE = 289 μg/g) compared with Eu_P1 (mean = 2184 μg/g; 95% CI: ±193 μg/g; SE = 95 μg/g; P = 0.028) and Eu_P2 (mean = 1211 μg/g; 95% CI: ±201 μg/g; SE = 101 μg/g; P = 1.8 × 10⁻⁴). Differences between Eu_P1 and Eu_P2 were also highly significant with P < 9 × 10⁻¹° ().
Figure 5. Variation of loline alkaloids in the three subpopulations of E. uncinata. The box plots are provided with pairwise comparisons between subpopulations using the Wilcoxon rank-sum test adjusted with the Bonferroni correction for multiple testing.
Increasing levels of total lolines were driven by increasing levels of NFL and minor contributions from NAL and NANL. In Eu_P1 and Eu_P3, the amount of loline alkaloids was NFL > NANL > NAL at any level of alkaloid concentration, but in Eu_P2, at low concentrations of total lolines, the NAL percentage was higher (16%) than the NANL percentage (12%). At increasing levels of lolines, the NAL percentage gradually reduced to 8%, but on the contrary, the NANL percentage slightly increased to 14%. The nonparametric Kendall’s tau rank test was used to test the correlation between data; τ-values are shown in .
Figure 6. Plots on the left show the amount of NAL, NANL, and NFL in E+ S. pratensis as a function of total lolines: NFL is the main compound responsible for increasing levels of lolines. Plots on the right side show the relative percentage of each compound. In Eu_P2, at increasing levels of total lolines, the percentage of NANL increases, whereas the percentage of NAL decreases. Points lying on the same vertical line belong to the same sample. *Probability value of Kendall’s rank correlation test <10−4.
When the plant subpopulations were considered, levels of loline alkaloids were not different in Sp_P2 and Sp_P3 in any of the comparisons made, but there were differences between them and Sp_P1. All comparisons had lower P-values than that seen when grouping the data according to the endophyte clusters ().
The total amount of lolines was positively correlated (Kendall’s tau rank test; τ = 0.32; P = 6 × 10⁻¹⁶) with the percentage of endophyte mapped reads but not correlated (Kendall’s tau rank test; P = 0.69) with the percentage of plant mapped reads ().
Figure 7. A, B. Scatterplots showing the correlations between the total amount of lolines and the percentage of reads mapped to the endophyte reference (A) but not to the plant reference (B). C, D. Scatterplots showing the correlations between the mycelial biomass and the total amount of lolines (C) and the percentage of reads mapped to the endophyte reference (D). The 95% confidence intervals (CIs) are shaded in gray. Kendall’s rank correlation coefficient (τ) values and respective P-values are shown.
Endophyte biomass correlated with total loline content and was significantly different among host genotypes
Fungal concentration was measured from the same plant material used for loline quantification. Values ranged from 0.1 to 3.97 mg/g, with an average of 1.45 mg/g (95% CI: ±0.19 μg/g; SE = 0.1 μg/g; n = 100). Association between plant/endophyte subpopulations and mycelial biomass was tested with the Kruskal-Wallis test. Sp_P1 was associated with significantly less endophyte biomass than Sp_P2 and Sp_P3 (P = 0.028 in both pairwise comparisons), whereas among the endophyte subpopulations, Eu_P3 was found with significantly higher mycelial biomass than Eu_P1 (P = 3.6 × 10⁻⁴) and Eu_P2 (P = 0.007), but no differences were found between these two ().
Figure 8. Variation in biomass in the three subpopulations of E. uncinata and S. pratensis. The box plots are provided with pairwise comparisons between subpopulations using the Wilcoxon rank-sum test adjusted with the Bonferroni correction for multiple testing.
Biomass was also found to be correlated with the total amount of lolines (τ = 0.48; P = 2.5 × 10⁻¹°), and with the percentage of endophyte mapped reads (τ = 0.27; P = 3.6 × 10⁻⁴) ().
DISCUSSION
The present genotyping-by-sequencing (GBS) analysis of a large number of infected grass associations collected at various sites across Europe allowed us to study host and endophyte genetic structures, and their interaction, at unparalleled depth. Our findings suggest the presence of three main S. pratensis gene pools that may have spread in Eurasia from different glacial refugia. All three gene pools have been found infected with E. uncinata. Asexual Epichloë spp. are usually seen as just clonally propagated organisms, but our results show the presence of three clearly distinct E. uncinata subpopulations, which, in retrospect, can also be easily distinguished with two microsatellites. Endophyte and host genetic distances were not correlated, meaning that the distribution of the endophyte follows a natural or human-mediated dispersion, independent from the genetic background of the host. The endophyte apparently does not require a specific host genotype to survive, allowing it to persist even at high levels of host admixture. But strong endophyte- and host-mediated effects on both alkaloid levels and fungal mycelial biomass were found. Knowing that a specific endophyte strain produces more lolines than the others and that a specific host genotype is associated with higher mycelial biomass may have important implications in targeted artificial inoculations to boost loline production in the symbiota.
E. uncinata subpopulations
Our data show a clear separation of E. uncinata into three subpopulations, a phenomenon that might be explained assuming three independent hybridization events among different strains of the same ancestor species. A similar scenario was described by Charlton et al. (Citation2012) when they investigated different E. canadensis morphotypes. According to Shoji et al. (Citation2015), interspecific hybrids are very likely the result of vegetative hyphal fusion (or anastomosis) rather than sexual hybridization, especially as species ancestral to several hybrids exhibit little or no interfertility with each other (Leuchtmann et al. Citation1994; Leuchtmann and Schardl Citation1998). Anastomosis events do not necessarily lead to nuclear fusion and the consequent formation of allodiploid hybrids. Moreover, the chances of successful colony establishment following anastomosis are very low (Shoji et al. Citation2015), and the prevalence of hybrids relative to nonhybrid asexual endophytes (Moon et al. Citation2004) only suggests an overall positive selection for these hybrid species. Considering the relatively low probabilities for two strains to encounter each other on the same host (Chung and Schardl 1997), the formation of interspecific hybrids in Epichloë can happen, but it is not as common as it may initially seem. However, there are several lines of evidence supporting our hypothesis. Moon et al. (Citation1999) described two strains of E. uncinata, isolated from Fp1 and Fp4, with allozyme profiles unA and unB associated with amplicons of different size at B10. Clayton et al. (Citation2017) detected four different E. uncinata ecotypes from the comparison of B10 sequences, associating them with three different geographic origins (Norway, Bulgaria, and Germany). Our previous study (Cagnano et al. Citation2019) showed higher genetic diversity among E. uncinata haplotypes than expected, which was also associated with different loline profiles. Here, we confirm that different subpopulations have different gene pools showing no admixture, different average levels of loline alkaloids, and slightly different levels of mycelial biomass.
S. pratensis subpopulations
S. pratensis is an outbreeding species with a gametophytic self-incompatibility system (Lundqvist Citation2009). Fjellheim et al. (Citation2006) suggested that the species may have gone through a genetic bottleneck during the Eemian period due to a lack of suitable habitats. Nevertheless, from an analysis of chloroplast DNA (cpDNA), they were able to describe three distinct haplotypes that survived in different glacial refugia and subsequently spread through Eurasia. Our results support this three-subpopulation structure, and the distribution model described by Fjellheim et al. (Citation2006) in part fits with our observations: a western haplotype, which expanded from an Iberian refugium to the Fennoscandia area, seems to match with Sp_P1; an eastern hapolotype, which survived in an unknown southeast location and expanded until it met the western haplotype in Scandinavia, matches with Sp_P2; the “rare” eastern haplotype may be Sp_P3, and its glacial refugium may have been situated in Italy. The presence of contact zones among haplotypes is supported by the fact that, in our analysis, individuals were not grouped into isolated clusters but rather showed a gradient of genetic diversity; the transitions from one cluster to another were related to individuals with increasing levels of admixture. Differences among ecotypes from the same area (Fjellheim et al. Citation2009) were probably covered by greater differences of three genetic pools from different glacial refugia.
Host-endophyte compatibility
The complete absence of correlations between endophyte genetic diversity and (i) geographic distance, (ii) environmental distance, and (iii) host genetic distance suggests a certain plasticity of E. uncinata in colonizing different genotypes of S. pratensis and that the anastomosis events very likely predate the recent host bottleneck. Therefore, the distribution of E. uncinata strains does not follow a specific host genotype but is rather bound to the natural or human-mediated distribution of the host. Endophyte infection is not lost in seeds arising from an intercross of plants from two different populations; the plant genotype changes over generations through recombination with other genotypes, whereas the endophyte genotype remains the same. As stated by Saikkonen et al. (Citation2010), this could lead to genetic mismatches between the endophyte and host, with consequences including imperfect vertical transmission (Gagic et al. Citation2018). Another possible scenario is that E. uncinata might rarely transmit horizontally, although this phenomenon has never been observed.
Our results suggest that E. uncinata is able to grow and produce loline alkaloids in different host genotypes but with different efficiency, since the number of endophyte reads, level of loline alkaloids, and level of mycelial biomass are higher in Sp_P2 and Sp_P3 than in Sp_P1. These results are reminiscent of those of Agee and Hill (Citation1994), Roylance et al. (Citation1994), and Hill et al. (Citation2002) who studied the role of the host genotypes in ergovaline levels and the possibility of breeding the host for increasing and decreasing concentration of the alkaloids. Loline alkaloids are correlated with biomass, as already described by Freitas (Citation2017); thus, performing screening to isolate high loline alkaloid producer strains in their natural host, such as S. pratensis, does not ensure that the same strains will produce the same amount of alkaloids once inoculated into a S. pratensis cultivar or, even less clearly, into another host species such as perennial ryegrass (Freitas Citation2017). NAL is the only loline alkaloid that originates from an endophyte-synthesized precursor through acetylation mediated by a host-encoded enzyme (Pan et al. Citation2014). Levels of NAL among host subpopulations showed the same trend as those of the other endophyte-synthesized lolines. This suggests that NAL levels are mostly driven by endophyte precursor concentrations rather than the host genotype. A key future research focus may be to isolate the host genes that are involved in boosting compatibility with the endophyte and test whether these genes are shared with other grass species or whether they are endophyte species specific.
Is it worth using GBS on Epichloë-infected grasses?
In this study, we performed the first application of genome-by-sequencing (GBS) to Epichloë-infected grasses, which allowed us to use dense genome-wide SNPs to describe both host and endophyte population structures. The average number of reads obtained per sample (), which is highly affected by the combination of enzymes used for complexity reduction, was comparable to that of other GBS studies (Catchen et al. Citation2013; Peterson et al. Citation2014; Ashraf et al. Citation2016). However, the biggest limitation was the disproportionately lower number of endophyte to plant reads, as fungal biomass was much lower than plant biomass. Since our analysis show that the number of reads is correlated with endophyte biomass in the host, it may be suggested that similar GBS approaches only use healthy plants with high green biomass grown at optimal temperature for colonization or carefully select the tissue of the sample according to plant developmental stage. It may also be valuable to test different combinations of restriction enzymes.
The choice of the reference genomes affected both the number of mapping reads and the number of SNPs retrieved. The references used in this study were draft fragmented genomes, which explains the relatively low percentage of mapping reads. A limitation with GBS in this regard was the high number of missing genotype values, which, combined with fragmented reference genomes, limited stringent quality filtering. Filtering parameters strongly depend on the organism being studied, and it is hard to define general guidelines. We used internal duplicate standards to increase the reliability of the analysis and to detect biases in the filtering process. The average number of filtered SNPs per sample was 3697 in the endophyte catalog and 30 824 in the plant catalog, similar to previous studies (Siadjeu et al. Citation2018; Pina‐Martins et al. Citation2019) and was sufficient to describe the population structure of both organisms. Although the number of SNPs in E. uncinata may initially appear low, there are several reasons why they still provide sufficient resolution for a proper population analysis: (i) the endophyte genome size is itself relatively small; (ii) the asexual mode of reproduction decreases genetic variation; and (iii) earlier comparative data studies successfully relied on just a few dozen microsatellites (Ekanayake et al. Citation2012).
Filtering for minor allele frequency (MAF) affects the population structure of the host when investigated with fastSTRUCTURE, but it did not change the endophyte clusters detected by DAPC. This phenomenon does not have a biological basis but should be seen as an effect of how the model (fastSTRUCTURE) and nonmodel (PCA, DAPC) clustering methods operated, as demonstrated by Linck and Battey (Citation2017). We tested how population structure reacted to different filtering parameters, and we cross-validated the host population structure obtained from model-based methods with nonparametric methods. For the endophyte data set, we cross-validated population structure, comparing it with microsatellite data. As expected, there was a clear-cut match between some SSR profiles and the clusters identified in this study. Moreover, the haplotype unweighted pair group method with arithmetic mean (UPGMA) clustering by Cagnano et al. (Citation2019) grouped the E. uncinata haplotypes into three subclades, which supports the K = 3 structure found in this study. Length variation of the amplicons detected at loci B11 and E_36 seems to occur randomly in the subpopulations, probably because of errors during the replication process due, for instance, to DNA polymerase slippage. This highlights the limitations of SSRs and the increased power of SNP data sets. But polymorphisms at loci B10, E_33, and E_39 associated with different clusters demonstrate that fast discrimination between groups can now be obtained by simple SSR marker analysis. Overall, using SSRs still remains the fastest and cheapest option for routine detection and identification tests, but for population studies involving hundreds of isolates, GBS allows deeper characterization and a more versatile marker catalog that can be used to investigate the endophytes, their hosts, and their interactions.
Supplemental Material
Download Zip (11.9 MB)ACKNOWLEDGMENTS
We thank A. Stuart, K. Vangsgaard, D. S. Nielsen, E. W. Larsen, and I. Nagy for methodological advice and scientific discussions. We also thank R. Elshire for his advice on GBS analysis.
Supplemental Material
Supplemental data for this article can be accessed on the here.
Additional information
Funding
LITERATURE CITED
- Agee CS, Hill NS. 1994. Ergovaline variability in Acremonium-infected tall fescue due to environment and plant genotype. Crop Science 34:221–226, doi:10.2135/cropsci1994.0011183X003400010040x
- Andrews S. 2016. FASTQC. A quality control tool for high throughput sequence data. http://www.bioinformatics.babraham.ac.uk/projects/fastqc/
- Ashraf BH, Byrne S, Fé D, Czaban A, Asp T, Pedersen MG, Lenk I, Roulund N, Didion T, Jensen CS, Jensen J, Janss LL. 2016. Estimating genomic heritabilities at the level of family-pool samples of perennial ryegrass using genotyping-by-sequencing. Theoretical and Applied Genetics 129:45–52, doi:10.1007/s00122-015-2607-9
- Baird NA, Etter PD, Atwood TS, Currey MC, Shiver AL, Lewis ZA, Selker EU, Cresko WA, Johnson EA. 2008. Rapid SNP discovery and genetic mapping using sequenced RAD markers. PLoS ONE 3:e3376, doi:10.1371/journal.pone.0003376
- Baldauf MW, Mace WJ, Richmond DS. 2011. Endophyte-mediated resistance to black cutworm as a function of plant cultivar and endophyte strain in tall fescue. Environmental Entomology 40:639–647, doi:10.1603/EN09227
- Ball OJP, Tapper BA. 1999. The production of loline alkaloids in artificial and natural grass/endophyte association. In: O’Callaghan M, ed. Proceedings of the NZ Plant Protection Conference, Auckland, New Zealand, August 9–12, 1999. The New Zealand Plant Protection Society. p. 52:264–269.
- Barker GM, Patchett BJ, Cameron NE. 2015a. Epichloë uncinata infection and loline content protect Festulolium grasses from crickets (Orthoptera: Gryllidae). Journal of Economic Entomology 108:789–797, doi:10.1093/jee/tou058
- Barker GM, Patchett BJ, Gillanders TJ, Brown GS, Montel SJY, Cameron NE. 2015b. Feeding and oviposition by Argentine stem weevil on Epichloë uncinata-infected, loline-containing Festulolium. New Zealand Plant Protection 68:212–217.
- Blanco‐Pastor JL, Manel S, Barre P, Roschanski AM, Willner E, Dehmer KJ, Hegarty M, Muylle H, Ruttink T, Roldán‐Ruiz I, Ledauphin T, Escobar‐Gutiérrez A, Sampoux J. 2019. Pleistocene climate changes, and not agricultural spread, accounts for range expansion and admixture in the dominant grassland species Lolium perenne L. Journal of Biogeography 46:1451–1465, doi:10.1111/jbi.13587
- Bolger AM, Lohse M, Usadel B. 2014. Trimmomatic: a flexible trimmer for illumina sequence data. Bioinformatics 30:2114–2120.
- Brazauskas G, Lenk I, Greve Pedersen M, Studer B, Lübberstedt T. 2011. Genetic variation, population structure, and linkage disequilibrium in European elite germplasm of perennial ryegrass. Plant Science 181:412–420.
- Cagnano G, Roulund N, Jensen CS, Forte FP, Asp T, Leuchtmann A. 2019. Large scale screening of Epichloë endophytes infecting Schedonorus pratensis and other forage grasses reveals a relation between microsatellite-based haplotypes and loline alkaloid levels. Frontiers in Plant Science 10:765, doi:10.3389/fpls.2019.00765
- Catchen J, Bassham S, Wilson T, Currey M, O’Brien C, Yeates Q, Cresko WA. 2013. The population structure and recent colonization history of Oregon threespine stickleback determined using restriction-site associated DNA-sequencing. Molecular Ecology 22:2864–2883, doi:10.1111/mec.12330
- Charlton ND, Craven KD, Mittal S, Hopkins AA, Young CA. 2012. Epichloë canadensis, a new interspecific epichloid hybrid symbiotic with Canada wildrye (Elymus canadensis). Mycologia 104:1187–1199, doi:10.3852/11-403
- Clay K, Schardl C. 2002. Evolutionary origins and ecological consequences of endophyte symbiosis with grasses. American Naturalist 160:99–127, doi:10.1086/342161
- Clayton W, Eaton CJ, Dupont P-Y, Gillanders T, Cameron N, Saikia S, Scott B. 2017. Analysis of simple sequence repeat (SSR) structure and sequence within Epichloë endophyte genomes reveals impacts on gene structure and insights into ancestral hybridization events. PLoS ONE 12:e0183748, doi:10.1371/journal.pone.0183748
- Corander J, Majander KK, Cheng L, Merilä J. 2013. High degree of cryptic population differentiation in the Baltic Sea herring Clupea harengus. Molecular Ecology 22:2931–2940, doi:10.1111/mec.12174
- Danecek P, Auton A, Abecasis G, Albers CA, Banks E, DePristo MA, Handsaker RE, Lunter G, Marth GT, Sherry ST, McVean G, Durbin R, 1000 Genomes Project Analysis Group 1000. 2011. The variant call format and VCFtools. Bioinformatics 27: 2156–2158, doi:10.1093/bioinformatics/btr330
- Davey JW, Hohenlohe PA, Etter PD, Boone JQ, Catchen JM, Blaxter ML. 2011. Genome-wide genetic marker discovery and genotyping using next-generation sequencing. Nature Reviews Genetics 12:499–510, doi:10.1038/nrg3012
- Deschamps S, Llaca V, May GD. 2012. Genotyping-by-sequencing in plants. Biology 1:460–483, doi:10.3390/biology1030460
- Ekanayake PN, Hand ML, Spangenberg GC, Forster JW, Guthridge KM. 2012. Genetic diversity and host specificity of fungal endophyte taxa in fescue pasture grasses. Crop Science 52:2243–2252, doi:10.2135/cropsci2011.12.0664
- Ekanayake PN, Rabinovich M, Guthridge KM, Spangenberg GC, Forster JW, Sawbridge TI. 2013. Phylogenomics of fescue grass-derived fungal endophytes based on selected nuclear genes and the mitochondrial gene complement. BMC Evolutionary Biology 13:270, doi:10.1186/1471-2148-13-270
- Elshire RJ, Glaubitz JC, Sun Q, Poland JA, Kawamoto K, Buckler ES, Mitchell SE. 2011. A robust, simple genotyping-by-sequencing (GBS) approach for high diversity species. PLoS ONE 6:e19379, doi:10.1371/journal.pone.0019379
- Faville MJ, Briggs L, Cao M, Koulman A, Jahufer MZZ, Koolaard J, Hume DE. 2015. A QTL analysis of host plant effects on fungal endophyte biomass and alkaloid expression in perennial ryegrass. Molecular Breeding 35:161, doi:10.1007/s11032-015-0350-1
- Fjellheim S, Pašakinskiené I, Grønnerød S, Paplauskiené V, Rognli OA. 2009. Genetic structure of local populations and cultivars of meadow fescue from the Nordic and Baltic regions. Crop Science 49:200–210, doi:10.2135/cropsci2007.08.0422
- Fjellheim S, Rognli OA, Fosnes K, Brochmann C. 2006. Phylogeographical history of the widespread meadow fescue (Festuca pratensis Huds.) inferred from chloroplast DNA sequences. Journal of Biogeography 33:1470–1478, doi:10.1111/j.1365-2699.2006.01521.x
- Freitas P. 2017. Crossing the species barrier: investigating vertical transmission of a fungal endophyte from tall fescue within a novel ryegrass association [PhD dissertation]. Lincoln, UK: University of Lincoln. 27–33.
- Gagic M, Faville MJ, Zhang W, Forester NT, Rolston MP, Johnson RD, Ganesh S, Koolaard JP, Easton HS, Hudson D, Johnson LJ, Moon CD, Voisey CR. 2018. Seed transmission of Epichloë endophytes in Lolium perenne is heavily influenced by host genetics. Frontiers in Plant Science 9:1580, doi:10.3389/fpls.2018.01580
- Galili T. 2015. dendextend: an R package for visualizing, adjusting and comparing trees of hierarchical clustering. Bioinformatics 31:3718–3720, doi:10.1093/bioinformatics/btv428
- Hill NS, Belesky DP, Stringer WC. 1991. Competitiveness of tall fescue as influenced by Acremonium coenophialum. Crop Science 31:185–190, doi:10.2135/cropsci1991.0011183X003100010042x
- Hill NS, Bouton JH, Thompson FN, Hawkins L, Hoveland CS, McCann MA. 2002. Performance of tall fescue germplasms bred for high- and low-ergot alkaloids. Crop Science 42:518–523, doi:10.2135/cropsci2002.0518
- Johnson LJ, Bonth ACM De, Briggs LR, Caradus JR, Finch SC, Fleetwood DJ, Fletcher LR, Hume DE, Johnson RD, Popay AJ, Tapper BA, Simpson WR, Voisey CR, Card SD. 2013. The exploitation of Epichloë endophytes for agricultural benefit. Fungal Diversity 60:171–188, doi:10.1007/s13225-013-0239-4
- Jombart T. 2008. adegenet: a R package for the multivariate analysis of genetic markers. Bioinformatics 24:1403–1405, doi:10.1093/bioinformatics/btn129
- Jombart T, Devillard S, Balloux F. 2010. Discriminant analysis of principal components: a new method for the analysis of genetically structured populations. BMC Genetics 11:94, doi:10.1186/1471-2156-11-94
- Jones JC, Fan S, Franchini P, Schartl M, Meyer A. 2013. The evolutionary history of Xiphophorus fish and their sexually selected sword: a genome-wide approach using restriction site-associated DNA sequencing. Molecular Ecology 22:2986–3001, doi:10.1111/mec.12269
- Joshi NA, Fass JN. 2011. Sickle: a sliding-window, adaptive, quality-based trimming tool for FastQ files (Version 1.33). https://github.com/najoshi/sickle
- Kumar S, Stecher G, Li M, Knyaz C, Tamura K. 2018. MEGA X: Molecular Evolutionary Genetics Analysis across Computing Platforms. Molecular Biology and Evolution 35:1547–1549, doi:10.1093/molbev/msy096
- Kutil BL, Greenwald C, Liu G, Spiering MJ, Schardl CL, Wilkinson HH. 2007. Comparison of loline alkaloid gene clusters across fungal endophytes: predicting the co-regulatory sequence motifs and the evolutionary history. Fungal Genetics and Biology 44:1002–1010, doi:10.1016/j.fgb.2007.04.003
- Le Cocq K, Gurr SJ, Hirsch PR, Mauchline TH. 2017. Exploitation of endophytes for sustainable agricultural intensification. Molecular Plant Pathology 18:469–473, doi:10.1111/mpp.12483
- Lee T-H, Guo H, Wang X, Kim C, Paterson AH. 2014. SNPhylo: a pipeline to construct a phylogenetic tree from huge SNP data. BMC Genomics 15:162, doi:10.1186/1471-2164-15-162
- Lepais O, Weir JT. 2014. SimRAD: an R package for simulation-based prediction of the number of loci expected in RADseq and similar genotyping by sequencing approaches. Molecular Ecology Resources 14:1314–1321, doi:10.1111/1755-0998.12273
- Leuchtmann A. 1992. Systematics, distribution, and host specificity of grass endophytes. Natural Toxins 1:150–162, doi:10.1002/nt.2620010303
- Leuchtmann A. 1994. Isozyme relationships of Acremonium endophytes from twelve Festuca species. Mycological Research 98:25–33, doi:10.1016/S0953-7562(09)80331-6
- Leuchtmann A, Schardl CL. 1998. Mating compatibility and phylogenetic relationships among two new species of Epichloë and other congeneric European species. Mycological Research 102:1169–1182, doi:10.1017/S0953756298006236
- Leuchtmann A, Schardl CL, Siegel MR. 1994. Sexual compatibility and taxonomy of a new species of Epichloë symbiotic with fine fescue grasses. Mycologia 86:802–812, doi:10.1080/00275514.1994.12026487
- Linck E, Battey CJ. 2017. Minor allele frequency thresholds dramatically affect population structure inference with genomic datasets. Biorxiv, doi:https://doi.org/10.1101/188623
- Lundqvist A. 2009. The nature of the two-loci incompatibility system in grasses. Hereditas 48:169–181, doi:10.1111/j.1601-5223.1962.tb01805.x
- McKenna A, Hanna M, Banks E, Sivachenko A, Cibulskis K, Kernytsky A, Garimella K, Altshuler D, Gabriel S, Daly M, DePristo MA. 2010. The genome analysis toolkit: a mapreduce framework for analyzing next-generation DNA sequencing data. Genome Research 20:1297–1303, doi:10.1101/gr.107524.110
- Moon CD, Craven KD, Leuchtmann A, Clement SL, Schardl CL. 2004. Prevalence of interspecific hybrids amongst asexual fungal endophytes of grasses. Molecular Ecology 13:1455–1467, doi:10.1111/j.1365-294X.2004.02138.x
- Moon CD, Guillaumin J-J, Ravel C, Li C, Craven KD, Schardl CL. 2007. New Neotyphodium endophyte species from the grass tribes Stipeae and Meliceae. Mycologia 99:895–905, doi:10.1080/15572536.2007.11832521
- Moon CD, Tapper B, Scott B. 1999. Identification of Epichloë endophytes in planta by a microsatellite-based PCR fingerprinting assay with automated analysis. Applied and Environmental Microbiology 65:1268–1279.
- Narum SR, Buerkle CA, Davey JW, Miller MR, Hohenlohe PA. 2013. Genotyping-by-sequencing in ecological and conservation genomics. Molecular Ecology 22:2841–2847, doi:10.1111/mec.12350
- Pan J, Bhardwaj M, Nagabhyru P, Grossman RB, Schardl CL. 2014. Enzymes from fungal and plant origin required for chemical diversification of insecticidal loline alkaloids in grass-Epichloë symbiota. PLoS ONE 9:e115590, doi:10.1371/journal.pone.0115590
- Panaccione DG, Beaulieu WT, Cook D. 2014. Bioactive alkaloids in vertically transmitted fungal endophytes. Functional Ecology 28:299–314, doi:10.1111/1365-2435.12076
- Patchett BJ, Chapman RB, Fletcher LR, Gooneratne SR. 2008. Root loline concentration in endophyte-infected meadow fescue (Festuca pratensis) is increased by grass grub (Costelytra zealandica) attack. New Zealand Plant Protection 61:210–214.
- Pembleton LW, Cogan NOI, Forster JW. 2013. StAMPP: an R package for calculation of genetic differentiation and structure of mixed-ploidy level populations. Molecular Ecology Resources 13:946–952, doi:10.1111/1755-0998.12129
- Peterson G, Dong Y, Horbach C, Fu Y-B. 2014. Genotyping-by-sequencing for plant genetic diversity analysis: a lab guide for SNP genotyping. Diversity 6:665–680, doi:10.3390/d6040665
- Pina‐Martins F, Baptista J, Pappas G, Paulo OS. 2019. New insights into adaptation and population structure of cork oak using genotyping by sequencing. Global Change Biology 25:337–350, doi:10.1111/gcb.14497
- Popay AJ, Hume DE. 2011. Endophytes improve ryegrass persistence by controlling insects. Pasture Persistence—Grassland Research and Practice Series 15:149–156.
- Rafiei V, Banihashemi Z, Jiménez-Díaz RM, Navas-Cortés JA, Landa BB, Jiménez-Gasco MM, Turgeon BG, Milgroom MG. 2018. Comparison of genotyping by sequencing and microsatellite markers for unravelling population structure in the clonal fungus Verticillium dahliae. Plant Pathology 67:76–86, doi:10.1111/ppa.12713
- Raj A, Stephens M, Pritchard JK. 2014. fastSTRUCTURE: variational inference of population structure in large SNP data sets. Genetics 197:573–589, doi:10.1534/genetics.114.164350
- Roylance JT, Hill NS, Agee CS. 1994. Ergovaline and peramine production in endophyte-infected tall fescue: independent regulation and effects of plant and endophyte genotype. Journal of Chemical Ecology 20:2171–2183, doi:10.1007/BF02033195
- Saikkonen K, Wäli PR, Helander M. 2010. Genetic compatibility determines endophyte-grass combinations. PLoS ONE 5:e11395, doi:10.1371/journal.pone.0011395
- Sawler J, Stout JM, Gardner KM, Hudson D, Vidmar J, Butler L, Page JE, Myles S. 2015. The genetic structure of marijuana and hemp. PLoS ONE 10:e0133292, doi:10.1371/journal.pone.0133292
- Schardl CL, Grossman RB, Nagabhyru P, Faulkner JR, Mallik UP. 2007. Loline alkaloids: currencies of mutualism. Phytochemistry 68:980–996, doi:10.1016/j.phytochem.2007.01.010
- Schardl CL, Leuchtmann A, Spiering MJ. 2004. Symbioses of grasses with seedborne fungal endophytes. Annual Review of Plant Biology 55:315–340, doi:10.1146/annurev.arplant.55.031903.141735
- Schardl CL, Leuchtmann A, Tsai HF, Collett MA, Watt DM, Scott DB. 1994. Origin of a fungal symbiont of perennial ryegrass by interspecific hybridization of a mutualist with the ryegrass choke pathogen, Epichloë typhina. Genetics 136:1307–1317.
- Schardl CL, Young CA, Hesse U, Amyotte SG, Andreeva K, Calie PJ, Fleetwood DJ, Haws DC, Moore N, Oeser B, Panaccione DG, Schweri KK, Voisey CR, Farman ML, Jaromczyk JJW, Roe BA, O’Sullivan DM, Scott B, Tudzynski P, An Z, Arnaoudova EG, Bullock CT, Charlton ND, Chen L, Cox M, Dinkins RD, Florea S, Glenn AE, Gordon A, Güldener U, Harris DR, Hollin W, Jaromczyk J, Johnson RD, Khan AK,Leistner E, Leuchtmann A, Li C, Liu J, Liu J, Liu M, Mace W, Machado C, Nagabhyru P, Pan J, Schmid J, Sugawara K, Steiner U, Takach JE, Tanaka E, Webb JS, Wilson EV, Wiseman JL, Yoshida R, Zeng Z. 2013. Plant-symbiotic fungi as chemical engineers: multi-genome analysis of the Clavicipitaceae reveals dynamics of alkaloid loci. PLoS Genetics 9:e1003323, doi:10.1371/journal.pgen.1003323
- Schirrmann MK, Zoller S, Croll D, Stukenbrock EH, Leuchtmann A, Fior S. 2018. Genomewide signatures of selection in Epichloë reveal candidate genes for host specialization. Molecular Ecology 27:3070–3086, doi:10.1111/mec.14585
- Selosse M-A, Schardl CL. 2007. Fungal endophytes of grasses: hybrids rescued by vertical transmission? An evolutionary perspective. New Phytologist 173:452–458, doi:10.1111/j.1469-8137.2007.01978.x
- Shi C, An S, Yao Z, Young CA, Panaccione DG, Lee ST, Schardl CL, Li C. 2017. Toxin-producing Epichloë bromicola strains symbiotic with the forage grass Elymus dahuricus in China. Mycologia 109:847–859, doi:10.1080/00275514.2018.1426941
- Shoji JY, Charlton ND, Yi M, Young CA, Craven KD. 2015. Vegetative hyphal fusion and subsequent nuclear behavior in Epichloë grass endophytes. PLoS ONE 10:e0121875, doi:10.1371/journal.pone.0121875
- Siadjeu C, Mayland-Quellhorst E, Albach DC. 2018. Genetic diversity and population structure of trifoliate yam (Dioscorea dumetorum Kunth) in Cameroon revealed by genotyping-by-sequencing (GBS). BMC Plant Biology 18:359, doi:10.1186/s12870-018-1593-x
- Simpson JT, Wong K, Jackman SD, Schein JE, Jones SJBirol I. 2009. ABySS: a parallel assembler for short read sequence data. Genome Research 19:1117–1123.
- Tadych M, Bergen M, Dugan FM, White JF. 2007. Evaluation of the potential role of water in spread of conidia of the Neotyphodium endophyte of Poa ampla. Mycological Research 111:466–472, doi:10.1016/j.mycres.2007.02.002
- Tadych M, Bergen MS, White JF. 2014. Epichloë spp. associated with grasses: new insights on life cycles, dissemination and evolution. Mycologia 106:181–201, doi:10.3852/106.2.181
- Takach JE, Young CA. 2014. Alkaloid genotype diversity of tall fescue endophytes. Crop Science 54:667–678, doi:10.2135/cropsci2013.06.0423
- Tredway LP, White JF, Gaut BS, Reddy PV, Richardson MD, Clarke BB. 1999. Phylogenetic relationships within and between Epichloë and Neotyphodium endophytes as estimated by AFLP markers and rDNA sequences. Mycological Research 103:1593–1603, doi:10.1017/S0953756299008874
- West CP, Izekor E, Turner KE, Elmi AA. 1993. Endophyte effects on growth and persistence of tall fescue along a water-supply gradient. Agronomy Journal 85:264–270, doi:10.2134/agronj1993.00021962008500020019x
- Winter DJ, Ganley ARD, Young CA, Liachko I, Schardl CL, Dupont P-Y, Berry D, Ram A, Scott B, Cox MP. 2018. Repeat elements organise 3D genome structure and mediate transcription in the filamentous fungus Epichloë festucae. PLoS Genetics 14:e1007467, doi:10.1371/journal.pgen.1007467