
ABSTRACT
Bipolaris gigantea (= Drechslera gigantea) causes Bipolaris leaf spot (BLS), a devastating and widespread disease on industrial hemp (Cannabis sativa). An investigation of relationships of isolates from hemp and other plants indicated variation in ploidy that has not previously been reported for Bipolaris. Isolates were obtained from BLS lesions on hemp and nearby weeds in 11 Kentucky counties and were similar to each other in morphology and growth characteristics. In total, 23 isolates were analyzed by multilocus phylogenetics, of which seven were also chosen for whole genome shotgun sequencing. Genes for RNA polymerase II subunit 2 (RPB2), translation elongation factor 1-α (TEF1), and mating type (MAT1) indicated that 13 of the isolates were haploid with only a single allele each of RPB2 and TEF1 and either the MAT1-1 or MAT1-2 idiomorph, whereas 10 were apparently “heteroploid” with two alleles each of RPB2 and TEF1 and both MAT1 idiomorphs. Haploids all had identical RPB2 alleles except for a 1-bp difference in two isolates, identical TEF1 alleles, and (if present) identical MAT1-2 alleles. Those alleles were also present in each heteroploid along with either of two related but distinct alleles for each gene. In contrast, haploids and heteroploids shared allelic variation of MAT1-1. In total, four haploid and two heteroploid genotypes were identified. Genome sequence data assembled to 30–32 Mb for each of four haploid isolates, but 10–31 Mb larger sizes for each of three heteroploids depending on sequencing platform and assembly program. The haploids and heteroploids caused similar disease on hemp.
INTRODUCTION
In 2014, a widespread disease characterized by leaf lesions on hemp (Cannabis sativa) was first reported in Kentucky, coinciding with the legalization and reestablishment of industrial hemp production. The causal agent of this “Bipolaris leaf spot” (BLS) was identified as Bipolaris gigantea (Szarka et al. Citation2020), known previously only as a minor pathogen of more than 60 species of grass (Poaceae) and a few other monocots (Drechsler Citation1923, Citation1928, Citation1929; Meredith Citation1963a; Meredith and Campbell Citation1962). The fungus was originally described as Helminthosporium giganteum and later reclassified as Drechslera gigantea (Heald and Wolf Citation1911; Ito Citation1930). Based on molecular sequence analysis as well as reassessment of morphological relationships, the species has been reclassified as Bipolaris gigantea (Lane et al. Citation2020). Recent reports of B. gigantea in the United States have been on barley (Isakeit et al. Citation2017), the invasive grass Microstegium vimineum (Lane et al. Citation2020), and native grasses Leersia virginica and Eragrostis sp. where it is has been referred to as “Bipolaris taxon megaspore” (Stricker et al. Citation2016). For over a century since its original description, the pathogen was of little economic interest and not reported from dicots. However, soon after hemp was reintroduced as a legal crop in the United States, B. gigantea was identified as the cause of devastating outbreaks of BLS on that plant (Szarka et al. Citation2020), and we have so far confirmed it from hemp crops in 15 states (D. Szarka and N. A. Gauthier, unpublished data).
To date, phylogenetic analyses have been reported only for B. gigantea isolates from grasses (Lane et al. Citation2020; Stricker et al. Citation2016), and the genetic diversity of this species in association with its broader host range has not been assessed. Furthermore, the question of whether this species is genetically typical of other fungi in its genus or higher taxonomic levels has not been addressed. In many species of Bipolaris (teleomorph Cochliobolus), sexual development is controlled by a single mating-type locus with two idiomorphs, MAT1-1 and MAT1-2 (Yoder et al. Citation1986). Members of the genus are predominantly heterothallic, requiring two strains with opposite idiomorphs for sexual reproduction. In homothallic species, the idiomorphs may either be separate or in tandem in a single open reading frame (Yun et al. Citation2000). Despite the presence of both mating types in a population, many Bipolaris species are not known to undergo sexual reproduction in the field. Ascospores of Bipolaris species are produced in perithecia, but possible protoperithecia devoid of ascospores have also been reported (Shoemaker Citation1955).
The sexual life cycles of both Ascomycota and Basidiomycota exhibit dikaryophases but largely differ in their timing and duration. Whereas most Basidiomycota grow primarily as dikaryons, members of Ascomycota subphylum Pezizomycotina propagate predominantly as haploids, and their dikaryophase is relatively brief and restricted to ascogenous (sexually reproductive) hyphae. Typically, in both groups, the diplophase is transient because karyogamy leads directly to meiosis. However, exceptions have been identified among several Pezizomycotina. Verticillium longisporum is a naturally occurring stable diploid resulting from hybridization (Inderbitzin et al. Citation2011; Ingram Citation1968). Similarly, persistent diploidy in some Metarhizium species is thought to have arisen from failed mating events (Kepler et al. Citation2016). Also notable are many Epichloë species that are asexual allopolyploids (diploids or triploids), each resulting from the fusion of a nucleus from one ancestor with a haploid nucleus of another ancestor, probably during vegetative growth (Kuldau et al. Citation1999; Moon et al. Citation2004; Schardl et al. Citation1994; Tsai et al. Citation1994). Deviations from the haploid state can be detected by the presence of multiple alleles at a single locus, large genome size, and occurrence of irregular mating-type combinations (Shymanovich et al. Citation2017). Variation of ploidy within Ascomycota is perhaps more diverse than generally appreciated, and additional exceptions are likely to be identified with the increased use of molecular genetic and genomic techniques.
In this study, we investigate phylogenetic and genomic variation of B. gigantea from infected hemp and other diseased plant species, finding frequent occurrence both of typical haploids that possess a single genome with a single mating-type idiomorph and of “heteroploids” that possess two genomes and both idiomorphs.
MATERIALS AND METHODS
Sampling and isolation.—
Leaves of hemp and other plants with lesions characteristic of BLS were collected from 11 counties in Kentucky between 2015 and 2019. Leaves were stored in the refrigerator (4 C) in individual plastic zipper bags for up to 2 d until fungal isolation. Whole leaves were surface disinfested with 1.25% NaClO (10% commercial bleach) and then incubated in a moist chamber (clear plastic box lined with moist paper towels, 98% relative humidity) at room temperature (23–25 C) and ambient room light to induce sporulation. Single macroconidia were visualized with the aid of a dissecting microscope and isolated with a sterile needle. Single-spored cultures were maintained on quarter-strength potato dextrose agar (25% PDA) consisting of 14 g/L Difco Bacto agar, 10 g/L Difco potato dextrose agar (Beckton Dickinson and Company, Sparks, Maryland) and grown on the benchtop under ambient light. Isolates 15JK003, 17CL005, and 17MA004 were deposited in multiple herbaria, and cultures were deposited in the Canadian Collection of Fungal Cultures ().
Table 1. Voucher information for three Bipolaris gigantea isolates included in this study.
Pathogenicity tests.—
Eight isolates (15JK003, 17MA004, 18NL004, 17CL005, 17RW001, 17LC008, 18FY001, and 18BB004; SUPPLEMENTARY TABLE 1) were tested for pathogenicity on whole plants of seed-grown cultivar ‘Cherry Cherry’ or a proprietary hemp line. Leaves were inoculated with 5-mm-diam mycelial plugs taken from the edges of 14-d-old colonies. In the greenhouse, plugs were placed onto fully developed leaves of 6-wk-old plants. Plugs were removed after 2 d, and inoculated plants were maintained under greenhouse conditions until symptoms developed (2–8 d). Each isolate was tested twice, with 10 replicate plant inoculations for each test.
All other isolates in this study were tested for pathogenicity on detached hemp leaves that were prepared in 200-mm Petri dishes with petioles inserted into water agar. Mycelial plugs were placed onto adaxial sides of leaves and left in place until symptoms developed (2–8 d). Plugs of water agar were used as negative controls. Detached leaf assays were maintained on the benchtop at 23 C in ambient light.
Morphology.—
Morphological characteristics of eight isolates were compared using structures produced on inoculated hemp leaves (SUPPLEMENTARY TABLE 1). These isolates were selected for geographic breadth, each from a different county in Kentucky, and based on results described herein, it was later determined that three of the isolates (15JK003, 17MA004, and 18NL004) were inferred haploids and five (17CL005, 17LC008, 17RW001, 18BB004, and 18FY001) were inferred heteroploids. Leaves from 3–5-wk-old hemp plants (proprietary cultivars) were collected from greenhouse-grown plants, surfaces were disinfected with 1.25% NaClO for 30 s, and petioles were inserted into water agar (15 g/L agar slanted in 200-mm Petri dishes). Leaves were inoculated with 5-mm-diam mycelial plugs taken from the edges of 7-d-old colonies that were grown on PDA. Plugs were left in place for 2–8 d until symptoms were apparent, since infection time varied between isolates. Leaves were pressed to dry at room temperature (23–25 C) for 1 wk and stored in paper envelopes until use. Leaves were rehydrated to induce sporulation by incubating for 2–5 d in moist chambers as described above and maintained under 12 h ultraviolet (UV) light and 12 h dark. Newly emerging conidia and conidiophores were examined using a DM1000 compound microscope (Leica Microsystems, Wetzlar, Germany), captured using Moticam 5.0 MP camera (Motic Microscopy, Hong Kong, China), and measured using Motic Images plus 2.0 software (Motic Microscopy).
DNA extraction.—
Isolates were grown for 3 d at room temperature under ambient light on cellophane overlaid on PDA. DNA was extracted from 50–100 mg of mycelium by using Quick-DNA Fungal/Bacterial Miniprep Kit (Zymo Research, Irvine, California) according to the manufacturer’s protocol, except nuclease-free water was used in place of the supplied elution buffer.
PCR and sequencing.—
For phylogenetic analysis, we chose two regions of rDNA commonly used in such studies and two protein coding genes for which substantial data sets are available for Bipolaris and related genera. The nuc rDNA regions ITS1-5.8S-ITS2 (internal transcribed spacer [ITS]) and 28S D1–D2 domains (28S) and portions (including introns) of genes for RNA polymerase II subunit 2 (RPB2) and translation elongation factor 1-α (TEF1) were polymerase chain reaction (PCR)-amplified using primers that are listed along with source information in . PCR amplification was performed with a Bio-Rad T100 thermal cycler (Hercules, California). Each 25-µL reaction contained 1 µL of DNA template (10 ng/µL), 100 nM each primer, 100 µM each dNTP (Applied Biosystems GeneAmp dNTP Blend; Thermo Fisher Scientific, Waltham, Massachusetts), Titanium Taq PCR buffer (TaKaRa Bio USA, Mountain View, California), and 0.25 µL per reaction of 50× Titanium Taq DNA Polymerase (TaKaRa Bio USA). PCR of ITS with primers ITS1/ITS4 (White et al. Citation1990) or 28S with primers LROR/LR5 (Schoch et al. Citation2009) was conducted with an initial denaturation temperature of 95 C for 3 min, followed by 34 cycles of 95 C for 30 s, 60 C for 30 s, and 72 C for 1 min, and a final extension at 72 C for 5 min. The TEF1 segment was PCR-amplified with primers EF983F/EF2218R (Schoch et al. Citation2009), with an annealing temperature of 56 C and extension time of 90 s. The RPB2 segment was PCR-amplified with primers 7cR (O’Donnell et al. Citation2007) and Rpr2, with an annealing temperature of 65 C and extension time of 60 s. Mating type was determined using the same PCR conditions and primers MAT111F1/MAT111R2 for MAT1-1 and MAT121F1/MAT121R2 for MAT1-2. A total of 23 isolates were analyzed, of which the majority originated from C. sativa but two were from other dicots (Acalypha ostryifolia and Acalypha virginica) and two were from grasses (Eleusine indica and Microstegium vimineum) ().
Table 2. PCR targets and primers in this study.
Table 3. Sequence accessions and genotypes for the isolates used in this study.a
PCR products were purified by using ExoSAP-IT (Thermo Fisher Scientific) according to the manufacturer’s protocol. Samples were submitted to Eurofins Genomics (Louisville, Kentucky) for Applied Biosystems (Thermo Fisher Scientific) Sanger sequencing with dye terminators, using the individual PCR primers () as sequencing primers. Raw complementary sequences were aligned and edited in Geneious 6.0.6 (Biomatters, Auckland, New Zealand). BLAST searches for consensus sequences for each isolate and target region were performed in the National Center for Bioinformation Technology (NCBI) against the GenBank nr database.
Because the two Lincoln County isolates had RPB2 and TEF1 alleles not seen elsewhere, those sequences were also checked in clones of PCR products from isolate 17LC008. The amplified RPB2 and TEF1 segments were purified using ExoSAP-IT and cloned with pGEM-T EASY Vector System I (Promega, Madison, Wisconsin). Adjustments were made to the manufacturer’s transformation instructions. The ligation reaction was diluted with 5 µL Tris-EDTA (pH 8), and 0.5 µL dilution was added to 40 µL EPI300 electrocompetent Escherichia coli cells (Lucigen, Middleton, Wisconsin) in 0.5-mL microcentrifuge tubes on ice. Cells were transformed by electroporation using a Gene Pulser (Bio-Rad) with a 1-mm cuvette at 2 V. Cells were transferred into a 1.5-mL tube with 500 µL S.O.C. medium (Invitrogen, Thermo Fisher Scientific) and incubated for 1 h at 37 C with rotary shaking at 200 rpm. Cells were plated onto Luria broth (LB) agar plates with 100 µg/mL ampicillin and 40 µg/mL X-gal (5-bromo-4-chloro-3-indolyl-β-d-galactoside; Gold Biotechnology, St. Louis, Missouri). Plates were incubated overnight at 37 C. Screened colonies were incubated overnight in liquid LB medium at 37 C, and plasmids were extracted using Zippy Plasmid Miniprep Kit (Zymo Research, Irvine, California). The plasmid DNAs were submitted to Eurofins Genomics for Sanger sequencing using each PCR primer ().
Whole genome sequencing.—
Isolates chosen for whole genome sequencing represented inferred haploids and heteroploids from hemp and other dicotyledonous hosts. Genomic DNAs from isolates 15JK003, 17CL005, 17CL014, and 17MA018 were sequenced using Ilumina NextSeq 500 system (San Diego, California) using mid-throughput configuration with paired-ends at 150 bp each end. Isolates 17LC008, 17MA004, and 18NL004 were sequenced using Illumina MiSeq system with paired-end reads at 300 cycles each end. The genomes were assembled using the MaSuRCA (Zimin et al. Citation2013) and SPAdes (Bankevich et al. Citation2012) genome assemblers. Genome completeness was assessed using Benchmarking Universal Single-Copy Orthologs (BUSCO) 5.4.7 with the ascomycota_odb10 data set consisting of 1706 conserved genes (Manni et al. Citation2021).
Phylogenetic analysis.—
Sequence alignment and maximum likelihood phylogenetic inference were performed online at NGphylogeny.fr (http://www.ngphylogeny.fr/) (Lemoine et al. Citation2019) using the “One Click” mode with the default settings. Sequences were aligned using MUSCLE (Edgar Citation2004) without Gblocks curation. TreeDyn (Chevenet et al. Citation2006) was used for rendering trees. Branch support values were set to display maximum likelihood and estimated using the approximate likelihood-ratio test (aLRT) with the “SH-like” (Shimodaira-Hasegawa–like) option (Anisimova and Gascuel Citation2006). Bayesian inference was conducted with MrBayes (Ronquist et al. Citation2012) implemented on the NGPhylogeny.fr site with default parameters: 4by4 GTR model (lset nst = 6), one run of four chains (heat settings = 0.77, 0.83, 0.91, and 1.00), 100 000 generations, 25% burn-in, then saving one out of every 500 trees.
Test for stability of heteroploidy.—
DNA was extracted from cultures grown from single conidia isolated from inoculated leaves as previously described. Detached hemp leaves were inoculated as described above using isolates 17MA004 (MAT1-2), 18NL004 (MAT1-1), and 17CL005 and 18FY001 (heteroploids with both MAT1-2 and MAT1-1 idiomorphs). Sporulation was induced as described above. For each isolate, 10 single macroconidia were isolated from inoculated leaves and transferred to individual 25% PDA plates. For DNA isolation, colonies were grown from single macroconidia on PDA then suspended in sterile water and spread on PDA plates overlaid with cellophane. After 3 d growth, DNA was extracted using the cetyltrimethylammonium bromide (CTAB) method (Li et al. Citation2008). PCR was performed to amplify MAT1 sequences using primers specific for MAT1-1 and MAT1-2 idiomorphs (). Alignments and phylogenetic trees are available from TreeBASE as study S30380.
Mating experiments.—
Isolates representing each mating type, 17MA004 (MAT1-2) and 18NL004 (MAT1-1), were grown separately and together to test for formation of microsclerotia or (proto)perithecia. Isolate 17CL005 (MAT1-1/MAT1-2), previously observed to produce these structures, was used as a positive control. Fragments of autoclaved and air-dried hemp leaves (approx. 250 mg) were sprinkled onto the surfaces of 10% PDA and Sach’s agar (SACH) medium (Wyss et al. Citation2001) plates, which were then inoculated with 4-mm-diam mycelial plugs (taken from 1-wk-old cultures on 25% PCA). Two plugs were plated 2 cm apart from each other. Plates had either two plugs from a single isolate or one plug each from two different isolates. There were 20 plates for each combination (10 on PDA and 10 on SACH medium). Plugs were removed after 1 wk and the plates were observed over a 3-wk period.
Nuclear condition.—
Macroconidia, microconidia, and mycelia were stained with DAPI (4ʹ,6-diamidino-2-phenylindole; Sigma, St. Louis, Missouri). Isolate 17MA004 was examined as a representative of haploid isolates, and 17CL005 was examined as a representative of heteroploid isolates. DAPI stock solution was made by dissolving 1 mg DAPI into 1 mL purified water with heat. Spores were stained using 0.7 µL/mL DAPI in Tris-buffered saline (TBS) consisting of 200 mM NaCl and 10 mM Tris-HCl pH 7.5. Nuclei were isolated by the method of Collins et al. (Citation1981).
RESULTS
Pathogenicity.—
Inoculated hemp plants developed symptoms within 5 d of inoculation, and characteristic macroconidia were isolated from resulting lesions. Conidia emerged within 21 d after inoculation. Controls with water agar plugs showed no symptoms. All isolates used in this study were confirmed to infect hemp, all producing similar lesions and sporulating on the infected plants.
Morphology.—
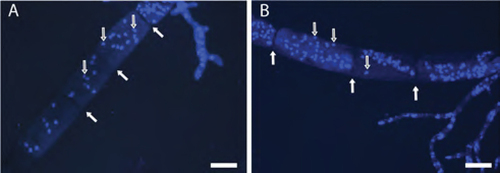
All isolates produced morphologically similar conidiophores, macroconidia, and microconidia with no significant differences in size or shape (SUPPLEMENTARY TABLE 1) and consistent with previous reports (Drechsler Citation1928; Isakeit et al. Citation2017; Lane et al. Citation2020). Specifically, conidiophores () were dark brown and multiseptate with a bulbus end and were produced on both the adaxial and abaxial sides of leaves. Conidiophores typically arose singularly but occasionally in pairs, with most producing a single macroconidium and occasionally two or three macroconidia developed from different attachment points on the same conidiophore. Macroconidia () were hyaline, distoseptate, and cylindrical with rounded ends and a slightly protuberant hilum. When exposed to water, macroconidia germinated within 20 min, typically producing multiple germ tubes from both the basal and apical ends and occasionally from any or multiple intercalary cells (). Macroconidia frequently germinated while still attached to conidiophores. Microconidia () were hyaline and formed in multiple chains, often from the tips of mature macroconidia or conidiophores. Microconidia germinated within 4–12 h to produce a single germ tube. Culture appearance varied as shown in .
Figure 1. Conidiophores (A–D) and ungerminated (E–F) and germinated (G–H) macroconidia of Bipolaris gigantea. Structures were taken from taken from plug-inoculated hemp leaves (A, B, C, E, G, and H) or the type specimen (D, F). A and B. Conidiophores with bulbus basal ends (arrows). C. Conidiophore with a second conidiophore (arrow) arising from the same basal cell. D. Conidiophore from herbarium specimen. E and F. Macroconidia with distosepta (black arrows) and slightly protrudent hila (white arrows). G. Macroconidium with bipolar germination (indicated by arrow at each end). H. Macroconidium germinating from each cell (arrows). Bars = 20 µm.
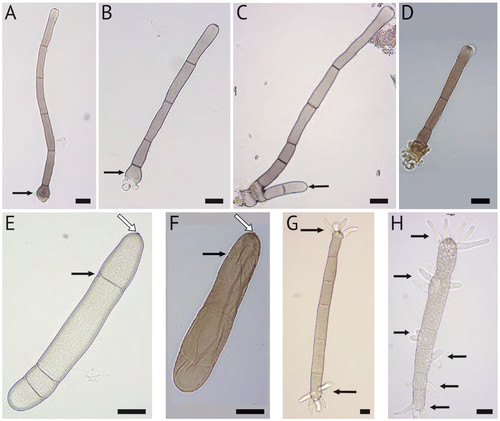
Figure 2. Microconidia of B. gigantea taken from plug-inoculated hemp leaves. A. Microconidia developing at the tip of a macroconidium. B. Size comparisons of microconidium (arrow) to macroconidium. C. Chains of microconidia with septa and visible branching pattern. Bars = 20 µm.
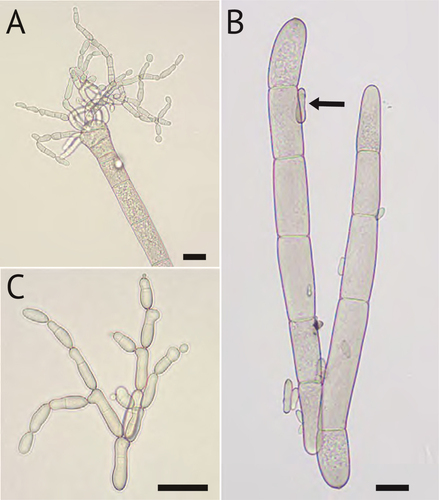
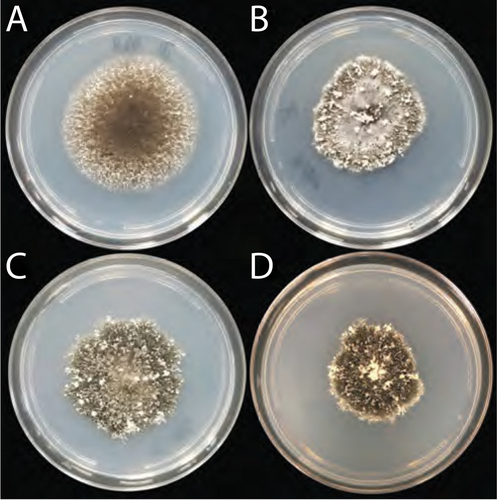
Figure 3. Colonies grown from a single macroconidia of each of four B. gigantea isolates. A. Haploid isolate 17MA004. B. Haploid isolate 18NL004. C. Heteroploid isolate 17CL005. D. Heteroploid isolate 18FY001. Cultures were grown on 88-mm 25% PDA plates for 14 d.
Fungal structures from the holotype were examined on a sample of the type specimen acquired from the New York Botanical Garden (NY barcode: 00946009, as Helminthosporium giganteum), which had been collected in Texas in 1909 and consisted of leaf lesions on blades of Bermuda grass (Cynodon dactylon) (Heald and Wolf Citation1911). Similar to conidiophores from the isolates (), those from the type specimen had a bulbus base and a saucer-shaped scar (). Also, like macroconidia of the isolates (), those from the type specimen had multiple septa and a slightly protruding hilum ().
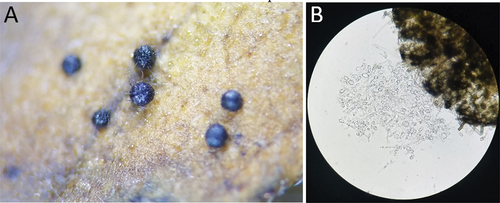
A novel observation for this species was that some isolates produced dark, spheroid structures resembling microsclerotia or protoperithecia either immersed within leaf tissue or on the leaf surface (). These structures contained no identifiable ascospores, and the contents resembled somewhat fragmented hyaline hyphae ().
Figure 4. Microsclerotia produced by B. gigantea isolates. A. Dark, spheroid structures formed on leaf tissue. These structures ranged from 240 to 375 µm diam. B. Inner contents of a microsclerotium, apparently lacking ascospores.
Sequences and alleles.—
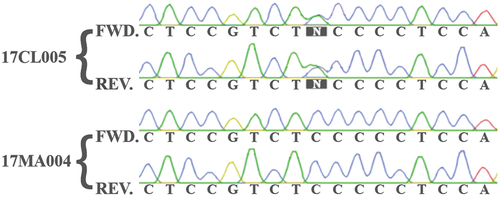
Single-gene sequences for RPB2 and TEF1, as well as ITS and 28S sequences, were determined from PCR products and submitted to GenBank (). For some isolates, the Sanger sequencing traces for RPB2 and TEF1 were unambiguous, whereas for other isolates the traces exhibited polymorphisms as co-migrating peaks, which were all confirmed on both strands (). For such isolates, the polymorphisms were observed at several positions within the sequences of both genes and each such position indicated two possible bases. Of the 23 isolates analyzed, 10 contained these nucleotide polymorphisms and were therefore inferred to possess two alleles each of RPB2 and TEF1. In the remaining 13 isolates, there were no apparent allelic polymorphisms for these genes.
Figure 5. Excerpt of aligned Sanger sequence traces from the TEF1 PCR product of an isolate (17CL005) containing polymorphisms compared with an isolate (17MA004) that had no polymorphisms.
The Whole Genome Shotgun projects for seven isolates have been deposited at DNA DataBank of Japan (DDBJ)//European Nucleotide Archive (ENA)/GenBank with accession numbers JALPSE000000000 (for isolate 15JK003), JANFPA000000000 (for 18NL004), JANFPC000000000 (for 17MA018), JANFPD000000000 (for 17MA004), JANFPE000000000 (for 17LC008), JANFPF000000000 (for 17CL014), and JANFPG000000000 (for 17CL005). Genome assemblies using MaSuRCA gave sizes of 30–31.9 Mb for four isolates (15JK003, 17MA004, 17MA018, and 18NL004) (). In contrast, the other three isolates gave much larger MaSuRCA assemblies of 41.4–46.6 Mb. The SPAdes assemblies gave similar sizes of approximately 30 Mb for inferred haploids 15JK003 and 17MA018, but close to twice that size for inferred heteroploids 17CL005 and 17CL014. BUSCO analysis indicated between 95.8% and 97.7% completeness for all MaSuRCA assemblies ().
Table 4. Whole genome sequence and assembly data for B. gigantea isolates.a
Table 5. Results of BUSCO genome assembly completeness analysis for Bipolaris gigantea isolates.a
Investigation of RPB2 and TEF1 sequences in the genome assemblies revealed a single allele of each in each of the four isolates 15JK003, 17MA004, 17MA018, and 18NL004, and two sets of alleles for both genes in each of the three isolates 17CL005, 17CL014, and 17LC008. Each of the former four isolates contained only one mating-type idiomorph, either MAT1-1 or MAT1-2, whereas each of the latter three isolates contained both MAT1-1 and MAT1-2. In the case of TEF1, all seven isolates shared an identical allele designated TEF1-a, but each isolate that had both MAT1 idiomorphs also had a second TEF1 allele. Two (17CL005, 17CL014) had TEF1-a and TEF1-b, and the third (17LC008) had TEF1-a and TEF1-c. Similarly, isolates 15JK003, 17MA004, 17MA018, and 18NL004, each with only one mating-type idiomorph, had only RPB2-a, and those with both mating types had two RPB2 alleles. Isolates 17CL005 and 17CL014 had the alleles designated RPB2-a and RPB2-b, and isolate 17LC008 had RPB2-a and RPB2-c.
RPB2 and TEF1 sequences from the genome assembly for isolate 17CL005 were used to assign the conflicting base calls of PCR-product sequences for other isolates to the respective alleles (). Other isolates with PCR-product sequences identical to those from the genome assemblies were given the same designation for each allele identified, a, b, or c. Two isolates had an RPB2 allele designated a1, which differed from RPB2-a by only 1 bp. In summary, for both RPB2 and TEF1, the isolates inferred to be haploids contained only allele a or a1, whereas those inferred to be heteroploids contained allele a plus either allele b or allele c.
Phylogenetic relationships.—
ITS and 28S sequences of PCR products were identical or nearly identical for all isolates listed in . These sequences were aligned with representatives of their most closely related species based on BLASTn matches (). Inferred maximum likelihood phylogenies grouped the isolates into a single distinct clade within the genus Bipolaris (). Phylogenetic analysis of ITS grouped sequences with four GenBank accessions, KM507761.1, MN902179, MK477544.1, and AY004774.1, annotated as Bipolaris sp., and accession KY784633.1 (Isakeit et al. Citation2017), annotated as being from Drechslera gigantea (). Accessions KM507761 and MN902179.1 were also determined to be from B. gigantea (Lane et al. Citation2020). Attempts to amplify the ITS region from the 112-year-old holotype material using multiple methods and primer sets were unsuccessful.
Table 6. GenBank accession numbers for close relatives of Bipolaris gigantea identified by BLASTn of the GenBank nr database.
Figure 6. Maximum likelihood trees inferred from aligned sequences of ITS (A) and partial 28S (B) rDNA. Sequences from isolates identified in this study as Bipolaris gigantea or previously identified as Drechslera gigantea grouped together in a clade within Bipolaris. A. Phylogeny inferred from ITS sequences (SUPPLEMENTARY FILE 2). B. Phylogeny inferred from 28S D1–D2 domain sequences (SUPPLEMENTARY FILE 3). Isolates of B. gigantea are listed in red, green, or blue text as they are in . Numbers on branches indicate aLRT support, and heavy lines indicate >98% Bayesian posterior probability. Scale bars are estimated substitutions/site.
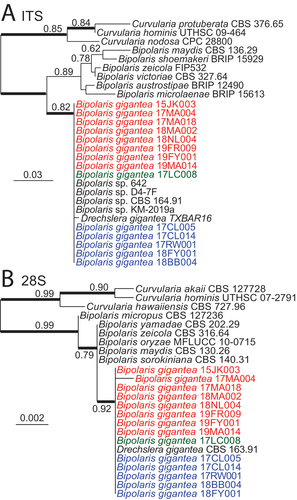
The 28S sequences of all B. gigantea isolates were identical except for that of isolate 17MA004, which had a single nucleotide difference from the others (). Included within this clade was sequence accession MH873929.1, annotated as being from D. gigantea.
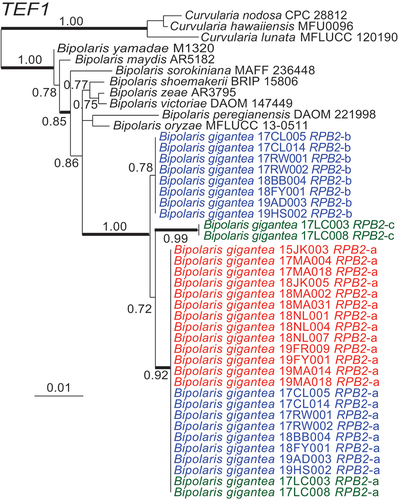
Phylogenetic analyses for each of RPB2 () and TEF1 () grouped the alleles from B. gigantea isolates into three related clades with high aLRT support.
Figure 7. Maximum likelihood phylogeny inferred from RPB2 sequences grouped isolates into three distinct but closely related clades within Bipolaris. Haploid alleles grouped with allele a or a1 from heteroploids. Remaining alleles from heteroploids grouped into two clades. Blue text denotes alleles from heteroploid isolates with allele b. Green text represents heteroploid isolates with allele c. Red text represents haploid isolates. Branch support values at nodes are given by aLRT, and heavy lines indicate >98% Bayesian posterior probability. Scale bars are estimated substitutions/site. The partial RPB2 sequence alignment is provided in SUPPLEMENTARY FILE 4.
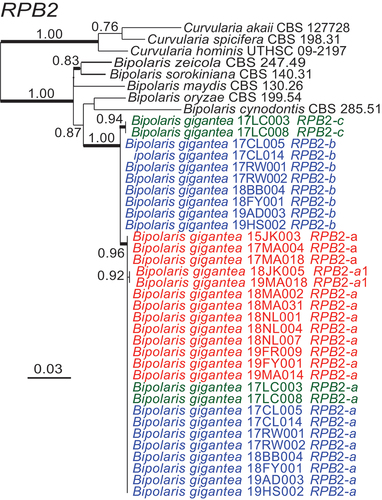
Figure 8. Maximum likelihood phylogeny inferred from TEF1 sequences grouped isolates into three distinct but closely related clades within Bipolaris. Haploid alleles grouped with allele a from heteroploids. Remaining alleles from heteroploids grouped into two clades. Blue text denotes alleles from heteroploid isolates with allele b. Green text represents heteroploid isolates with allele c. Red text represents haploid isolates. Branch support values at nodes are given by aLRT, and heavy lines indicate >98% Bayesian posterior probability. Scale bars are estimated substitutions/site. The partial TEF1 sequence alignment is provided in SUPPLEMENTARY FILE 5.
Mating types.—
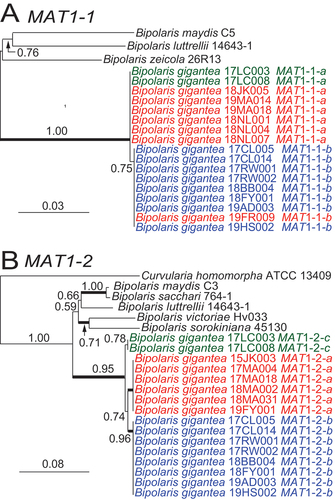
MAT1 PCR tests separated the 23 isolates into three groups: seven isolates with only MAT1-1, six with only MAT1-2, and 10 with both mating-type idiomorphs (). Inferred phylogenetic trees grouped MAT1-1 sequences into two separate but related clades (). MAT1-2 phylogeny grouped the isolates into three related clades (). In both trees, most MAT1 sequences grouped together according to haploid or heteroploid status. Specifically, the apparent haploids with a single allele each of RPB2 and TEF1 grouped into one clade, and the apparent heteroploids with two alleles each of RPB2 and TEF1 grouped in another clade. Of the isolates from hosts other than hemp, three (17MA018, 19FY001, and 19MA014) were haploids and one (17CL014) was a heteroploid, and all grouped similarly to the respective haploids and heteroploids from hemp. There were three exceptions. First, although isolates 17LC003 and 17LC008 were heteroploids, they grouped with haploids in the MAT1-1 phylogeny but in a separate clade in the MAT1-2 phylogeny (). Also, isolate 19FR009, a haploid with only one MAT1 idiomorph, grouped with the heteroploids in the MAT1-1 phylogeny.
Figure 9. Maximum likelihood phylogenies inferred for mating-type idiomorphs of Bipolaris gigantea isolates and representatives of related species. A. Phylogeny inferred from partial MAT1-1 sequence alignment (SUPPLEMENTARY FILE 6). B. Phylogeny inferred from partial MAT1-2 alignment (SUPPLEMENTARY FILE 7). Branch support values at nodes are given by aLRT, and heavy lines indicate >98% Bayesian posterior probability. Scale bars are estimated substitutions/site. Text colors are as in .
Stability of the heteroploids was assessed by PCR analysis of MAT1 idiomorphs for 10 single-spore isolates from each of four heteroploids, and in each case the progeny retained both idiomorphs.
Mating experiments.—
Cultures on sterilized hemp leaves consisting of inferred haploids 17MA004 (MAT1-2) and 18NL004 (MAT1-1) grown together or each separately, as well as cultures of inferred heteroploid 17CL005 (MAT1-1/MAT1-2), all produced the microsclerotia (protoperithecia-like) structures similar to those sometimes observed on leaves of infected plants. When the structures were crushed and observed microscopically, no asci or ascospores were evident.
Nuclear condition.—
Macroconidia, microconidia, and hyphae of B. gigantea isolates had multiple nuclei per cell (). Efforts to measure and compare sizes or total fluorescence of individual nuclei were not undertaken because clumping of nuclei was very common within the fungal hyphae and spores, as well as in cell-free extracts. Although no obvious differences were observed between the apparent haploids and heteroploids, we considered the results inadequate to determine whether the heteroploids were heterokaryotic or diploid.
Figure 10. Bipolaris gigantea macroconidia stained with DAPI. A. Heteroploid isolate 17CL005 macroconidium with multiple nuclei (gray arrows) per cell (white arrows indicate septa). B. Haploid 17MA004 macroconidium with multiple nuclei (gray arrows) per cell. White arrows indicate septa. Bars = 20 µm.
DISCUSSION
This investigation of the fungus causing Bipolaris leaf spot (BLS) disease on hemp or causing similar symptoms on other dicots revealed both haploid and heteroploid genotypes of Bipolaris gigantea in nearly equal proportions. The conclusion that isolates we call heteroploids were not haploid was based on three lines of evidence: polymorphisms in both RPB2 and TEF1 genes, the presence of both MAT1-1 and MAT1-2 idiomorphs, and larger assembled genome sizes compared with the haploids. All three of those lines of evidence were consistent across all 10 inferred heteroploid isolates, whereas none of those observations applied to any of the 13 inferred haploid isolates. Instead, each haploid had just one RPB2 allele, one TEF1 allele, and either MAT1-1 or MAT1-2, but not both.
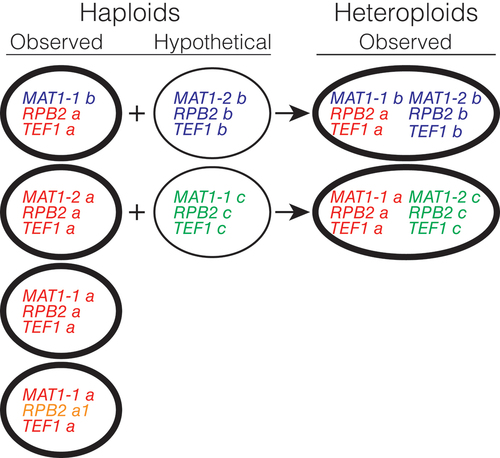
Assembled genome sizes of the heteroploids were up to twice as large (depending on assembly program) that of the 30–32 Mb sequenced haploids, suggesting that each heteroploid may have the equivalent of two haploid genomes. However, whether the heteroploids are diploid or heterokaryotic could not be determined in this study because the heteroploid status appeared to be stable and diploidy could not be ruled out. All told, the 23 isolates analyzed group into six genotypes, of which four are haploid and two are heteroploid (). The heteroploid genotypes suggest a hybrid origin, and the fact that each possesses both MAT1 idiomorphs (MAT1-1 and MAT1-2) suggests that they may have arisen via an incomplete sexual cycle. It is conceivable that the parents of such hybrids were sufficiently divergent to limit their sexual compatibility. Such a scenario is consistent with the observation that all sampled haploids share alleles for TEF1 and (with slight variation) RPB2, and that each heteroploid shares those same alleles plus a second, closely related allele of each gene. Furthermore, none of the observed heteroploids can be explained as hybrids between the observed haploid genotypes because none of the heteroploids is homozygous for the alleles of RPB2 and TEF1 found in the haploids. Instead, all heteroploids exhibit heterozygosity for RPB2 and TEF1, as well as a MAT1-2 allele that also is not found in the haploids. Apparently, each heteroploid is the product of hybridization between an observed haploid genotype and one or the other of two genotypes that are either rare or reside in habitats (such as hosts) yet to be identified ().
Figure 11. Genotypes of Bipolaris gigantea observed (thick ellipses) and hypothetical (thin ellipses), and possible origins of observed heteroploids.
Bipolaris species are primarily known as pathogens of monocotyledonous plants. A single report mentions B. gigantea on a dicot—a Teramnus sp. (Fabaceae)—but with little to no sporulation to provide definitive identification (Meredith Citation1963a). Also, a recent survey of B. gigantea on the grasses Microstegium vimenium and Elymus virginicus has yielded five isolates that, based on TEF1 sequences, are all similar to our haploid BLS pathogens (Lane et al. Citation2020). The fact that heteroploids have not been reported on monocots is not strong evidence of their absence from those hosts, especially considering our observation that the heteroploids are refractory to maintenance in culture. Another difficulty with the heteroploids is that their genome assemblies based on Illumina (short-read shotgun) sequences are consistently poor. So, it seems likely that researchers who are similarly faced with PCR-sequence ambiguities may be unsuccessful in efforts to resolve them even with genome sequences, leading to omission of such data from the reports. For these reasons, it is possible that heteroploids such as those identified in this study are more common in Bipolaris species or other filamentous ascomycetes than generally has been realized.
Haploid and heteroploid isolates were distinguished by the number of alleles present for each gene, the presence of one or both mating-type idiomorphs, and apparent genome size based on whole genome shotgun sequencing. Out of 23 isolates, four haploid genotypes and two heteroploid genotypes were identified. The haploid genotypes differ only in possessing either MAT1-1 or MAT1-2, one isolate possessing the MAT1-1-b allele typical of the heteroploids and two isolates possessing an RPB2 allele (a1) with a single nucleotide substitution difference from allele a. The simplest explanation of the heteroploid genotypes is two independent hybridization events (), each followed by clonal propagation and spread. One hybridization would have been between genotype MAT1-1-b RPB2-a TEF1-a (similar to haploid isolate 19FR009) and the unsampled genotype MAT1-2-b RPB2-b TEF1-b. The other hybridization would have been between genotype MAT1-1-a RPB2-a TEF1-a (similar to most sampled haploids) and the unsampled genotype MAT1-2-c RPB2-c TEF1-c. Considering that at least one apparently uncommon parent contributed to each, these hybridizations may have been rare events. If so, then the abundance of hybrids would suggest that they sometimes have a selective advantage. Currently, the basis for such an advantage would be the subject of conjecture, but a possibility worth further exploration is that the heteroploids are more highly fit on Cannabis and maybe other dicots such as Acalypha virginica and A. ostryifolia than on grasses (monocots) such as Microstegium vimineum and Eleusine indica.
The two mating-type idiomorphs MAT1-1 and MAT1-2 occurred in nearly equal frequencies among the haploid isolates, suggesting that B. gigantea sexually reproduces. Conceivably, the heteroploids may be an intermediate stage in the sexual cycle, but if so, it is difficult to explain the distribution of alleles whereby only a single allele for each of RPB2, TEF1, and MAT1-2 occurred among the haploids and the heteroploids all had an additional allele of RPB2 and TEF1 and an alternative allele of MAT1-2. All isolates that had two alleles for each of RPB2 and TEF1 also had both mating types, supporting the inference that those isolates are heteroploids. The observation that polymorphisms in MAT1-1 were shared (but unevenly distributed) between sampled haploids and heteroploids, whereas the polymorphisms in MAT1-2 were not, suggests very limited recombination between those genomes in natural populations. Apparently, the genomes identified in the haploids do not often recombine with the heteroploid-unique genomes to produce new haploid genotypes.
The absence in our sample of any haploids identified with RPB2 or TEF1 alleles b or c may have any of several intriguing explanations. Perhaps haploids with those alleles are rare, but when they hybridized with the RPB2-a TEF1-a haploids the result was highly competitive heteroploids. However, haploids and heteroploids were isolated in approximately equal numbers from hemp, the major crop host in Kentucky, the lesions they caused on hemp appeared similar, and there was no difference in sporulation apparent on visual inspection, suggesting that the haploids and heteroploids are about equally fit. A second possibility is that RPB2-b TEF1-b haploids and RPB2-c TEF1-c haploids have gone extinct, and their genomes only persist now in heteroploids. A third possibility is that such haploids are present and abundant in nature but not on the plants sampled in this or prior surveys (Lane et al. Citation2020; Stricker et al. Citation2016). Such an explanation would imply that although allele-a haploids and the heteroploids are both broad-host-range pathogens, allele-b or allele-c haploids may be much more restricted in host range.
There are over 50 known hosts of B. gigantea (Drechsler Citation1923, Citation1928, Citation1929; Meredith Citation1963a, Citation1963b; Sato et al. Citation1990; Gamba and Tekauz Citation2003; Isakeit et al. Citation2017; Szarka et al. Citation2020), but the only crop plant on which it has been identified as a pathogen of concern is hemp. Improved strategies for management of BLS on hemp should be facilitated by results of further research into the genetic diversity of B. gigantea as relates to host selectivity, infectivity, and virulence.
Supplemental Material
Download Zip (27 KB)ACKNOWLEDGMENTS
The authors thank Ed Dixon, Jolanta Jaromczyk, and Simona Florea at the University of Kentucky and Gillian Turgeon at Cornell University for their assistance and advice.
DISCLOSURE STATEMENT
No potential conflict of interest was reported by the author(s).
SUPPLEMENTARY MATERIAL
Supplemental data for this article can be accessed online at https://doi.org/10.1080/00275514.2023.2224699
Additional information
Funding
LITERATURE CITED
- Anisimova M, Gascuel O. 2006. Approximate likelihood-ratio test for branches: a fast, accurate, and powerful alternative. Syst Biol. 55(4):539–52. doi: 10.1080/10635150600755453.
- Bankevich A, Nurk S, Antipov D, Gurevich AA, Dvorkin M, Kulikov AS, Lesin VM, Nikolenko SI, Pham S, Prjibelski AD, et al. 2012. SPAdes: a new genome assembly algorithm and its applications to single-cell sequencing. J Comput Biol. 19(5):455–77. doi: 10.1089/cmb.2012.0021.
- Chevenet F, Brun C, Bañuls A-L, Jacq B, Christen R. 2006. TreeDyn: towards dynamic graphics and annotations for analyses of trees. BMC Bioinform. 7(1):439. doi: 10.1186/1471-2105-7-439.
- Collins RA, Stohl LL, Cole MD, Lambowitz AM. 1981. Characterization of a novel plasmid DNA found in mitochondria of N. crassa. Cell. 24(2):443–52. doi: 10.1016/0092-8674(81)90335-4.
- Drechsler C. 1923. Some graminicolons species of Helminthosporium. I. J Agric Res. 24:641–739.
- Drechsler C. 1928. Zonate eyespot of grasses caused by Helminthosporium giganteum. J Agric Res. 37:473–92.
- Drechsler C. 1929. Occurrence of zonate eyespot fungus, Helminthosporium giganteum, on some additional grasses. J Agric Res. 39:129–35.
- Edgar RC. 2004. MUSCLE: multiple sequence alignment with high accuracy and high throughput. Nucleic Acids Res. 32(5):1792–97. doi: 10.1093/nar/gkh340.
- Gamba F, Tekauz A. 2003. First report of a leaf spot of barley caused by Drechslera gigantea in Uruguay. Plant Dis. 87(1):99–99. doi: 10.1094/PDIS.2003.87.1.99B.
- Heald FD, Wolf FA. 1911. New species of Texas fungi. Mycologia. 3(1):5–22. doi: 10.1080/00275514.1911.12017657.
- Inderbitzin P, Davis RM, Bostock RM, Subbarao KV. 2011. The ascomycete Verticillium longisporum is a hybrid and a plant pathogen with an expanded host range. PLoS ONE. 6(3):13. doi: 10.1371/journal.pone.0018260.
- Ingram R. 1968. Verticillium dahliae var. longisporum, a stable diploid. Trans Br Mycol Soc. 51(2):339–41. doi: 10.1016/S0007-1536(68)80073-7.
- Isakeit T, Commer B, Shaw BD, Brown M, Neely C. 2017. First report of leaf spot of barley caused by Drechslera gigantea in the United States. Plant Dis. 101(8):1548–1548. doi: 10.1094/PDIS-03-17-0406-PDN.
- Ito S. 1930. On some new ascigerous stages of the species of Helminthosporium parasitic on cereals. Proc Imp Acad. 6(8):352–55. doi: 10.2183/pjab1912.6.352.
- Kepler RM, Chen Y, Kilcrease J, Shao J, Rehner SA. 2016. Independent origins of diploidy in Metarhizium. Mycologia. 108(6):1091–103. doi: 10.3852/15-270.
- Kuldau GA, Tsai H-F, Schardl CL. 1999. Genome sizes of Epichloë species and anamorphic hybrids. Mycologia. 91(5):776–82. doi: 10.1080/00275514.1999.12061083.
- Lane B, Stricker KB, Adhikari A, Ascunce MS, Clay K, Flory SL, Smith ME, Goss EM, Harmon PF. 2020. Large-spored Drechslera gigantea is a Bipolaris species causing disease on the invasive grass Microstegium vimineum. Mycologia. 112(5):921–31. doi: 10.1080/00275514.2020.1781495.
- Lemoine F, Correia D, Lefort V, Doppelt-Azeroual O, Mareuil F, Cohen-Boulakia S, Gascuel O. 2019. NGPhylogeny.fr: new generation phylogenetic services for non-specialists. Nucleic Acids Res. 47(W1):W260–W265. doi: 10.1093/nar/gkz303.
- Li R, Mock R, Huang Q, Abad J, Hartung J, Kinard G. 2008. A reliable and inexpensive method of nucleic acid extraction for the PCR-based detection of diverse plant pathogens. J Virol Methods. 154(1–2):48–55. doi: 10.1016/j.jviromet.2008.09.008.
- Manni M, Berkeley MR, Seppey M, Simao FA, Zdobnov EM. 2021. BUSCO update: novel and streamlined workflows along with broader and deeper phylogenetic coverage for scoring of eukaryotic, prokaryotic, and viral genomes. Mol Biol Evol. 38(10):4647–54. doi: 10.1093/molbev/msab199.
- Meredith DS. 1963a. ‘Eyespot,’ a foliar disease of bananas caused by Drechslera gigantea (Heald & Wolf) Ito. Ann Appl Biol. 51(1):29–40. doi: 10.1111/j.1744-7348.1963.tb03672.x.
- Meredith DS. 1963b. Further observations on the zonate eyespot fungus, Drechslera gigantea, in Jamaica. Trans Br Mycol Soc. 46(2):201–07. doi: 10.1016/S0007-1536(63)80075-3.
- Meredith D, Campbell F. 1962. Eyespot a new foliar disease of banana caused by Drechslera gigantea. Plant Dis Rep. 46:305.
- Moon CD, Craven KD, Leuchtmann A, Clement SL, Schardl CL. 2004. Prevalence of interspecific hybrids amongst asexual fungal endophytes of grasses. Mol Ecol. 13:1455–67.
- O’Donnell K, Sarver BA, Brandt M, Chang DC, Noble-Wang J, Park BJ, Sutton DA, Benjamin L, Lindsley M, Padhye A, et al. 2007. Phylogenetic diversity and microsphere array-based genotyping of human pathogenic Fusaria, including isolates from the multistate contact lens-associated U.S. keratitis outbreaks of 2005 and 2006. J Clin Microbiol. 45(7):2235–48. doi: 10.1128/JCM.00533-07.
- Ronquist F, Teslenko M, van der Mark P, Ayres DL, Darling A, Hohna S, Larget B, Liu L, Suchard MA, Huelsenbeck JP. 2012. MrBayes 3.2: efficient Bayesian phylogenetic inference and model choice across a large model space. Syst Biol. 61:539–42.
- Sato T, Nishihara N, Ohkubo H, Hamaya E. 1990. Notes on Drechslera gigantea, a graminicolous fungus new to Japan. Rep Tottori Mycol Inst. 28:175–84.
- Schardl CL, Leuchtmann A, Tsai HF, Collett MA, Watt DM, Scott DB. 1994. Origin of a fungal symbiont of perennial ryegrass by interspecific hybridization of a mutualist with the ryegrass choke pathogen, Epichloë typhina. Genetics. 136(4):1307–17. doi: 10.1093/genetics/136.4.1307.
- Schoch CL, Crous PW, Groenewald JZ, Boehm EW, Burgess TI, de Gruyter J, de Hoog GS, Dixon LJ, Grube M, Gueidan C, et al. 2009. A class-wide phylogenetic assessment of Dothideomycetes. Stud Mycol. 64:1–15S10. doi: 10.3114/sim.2009.64.01.
- Shoemaker RA. 1955. Biology, cytology, and taxonomy of Cochliobolus sativus. Can J Bot. 33(6):562–76. doi: 10.1139/b55-045.
- Shymanovich T, Charlton ND, Musso AM, Scheerer J, Cech NB, Faeth SH, Young CA. 2017. Interspecific and intraspecific hybrid Epichloë species symbiotic with the North American native grass Poa alsodes. Mycologia. 109(3):459–74. doi: 10.1080/00275514.2017.1340779.
- Stricker KB, Harmon PF, Goss EM, Clay K, Luke Flory S. 2016. Emergence and accumulation of novel pathogens suppress an invasive species. Ecol Lett. 19(4):469–77. doi: 10.1111/ele.12583.
- Szarka D, Amsden B, Beale J, Dixon E, Schardl CL, Gauthier N. 2020. First report of hemp leaf spot caused by a Bipolaris species on hemp (Cannabis sativa) in Kentucky. Plant Health Prog. 21(2):82–84. doi: 10.1094/PHP-01-20-0004-BR.
- Tsai HF, Liu JS, Staben C, Christensen MJ, Latch G, Siegel MR, Schardl CL. 1994. Evolutionary diversification of fungal endophytes of tall fescue grass by hybridization with Epichloë species. Proc Natl Acad Sci U S A. 91(7):2542–46. doi: 10.1073/pnas.91.7.2542.
- White TJ, Bruns TD, Lee S, Taylor J. 1990. Analysis of phylogenetic relationships by amplification and direct sequencing of ribosomal RNA genes. In: Innis MA, Gelfand DH, Sninsky JJ, White TJ, editors. PCR protocols: a guide to methods and applications. San Diego (California): Academic Press. p. 315–22.
- Wyss GS, Charudattan R, DeValerio JT. 2001. Evaluation of agar and grain media for mass production of conidia of Dactylaria higginsii. Plant Dis. 85(11):1165–70. doi: 10.1094/PDIS.2001.85.11.1165.
- Yoder OC, Valent B, Chumley F. 1986. Genetic nomenclature and practice for plant pathogenic fungi. Phytopathology. 76(4):383–85. doi: 10.1094/Phyto-76-383.
- Yun S-H, Arie T, Kaneko I, Yoder OC, Turgeon BG. 2000. Molecular organization of mating type loci in heterothallic, homothallic, and asexual Gibberella/Fusarium species. Fungal Genet Biol. 31(1):7–20. doi: 10.1006/fgbi.2000.1226.
- Zimin AV, Marçais G, Puiu D, Roberts M, Salzberg SL, Yorke JA. 2013. The MaSuRCA genome assembler. Bioinformatics. 29(21):2669–77. doi: 10.1093/bioinformatics/btt476.