Abstract
The objective of this study was to characterise paddock-to-paddock annual dry matter (DM) yield variability dairy farms in the Waikato region of New Zealand, as a first step towards improving the amount of pasture grown and eaten by dairy cows. Individual paddock herbage yield was determined by calibrated visual assessment for two research farms and by rising plate meter from two commercial farms. Annualised pasture yield for individual paddocks across farms ranged from 9500 to 26100 kg DM/ha/year. Within farms, the greatest herbage yield paddocks produced between 30 and 122% more pasture DM/ha than the worst. There was a poor correlation (R 2 of 0.1 or less) between average paddock yield and yield in the last calendar year for all farms. These data highlight the variability of paddock yield, both spatially within farms and across years.
Introduction
A substantial research effort has been invested in the growth and utilisation of high-quality pasture on New Zealand's dairy farms because of close links with dairy farm profitability (Savage & Lewis Citation2005). Genetic gains have been achieved across a range of temperate forage grass and legume species in New Zealand. Thom et al. (Citation1998) reported an annual yield increase of 0.73% per year, with much of this improvement being associated with better crown rust resistance in newer ryegrass cultivars. Together with these improvements in cultivars, more pasture has been grown (2–3 t dry matter (DM)/ha) and utilised on farms as a result of increased nitrogen application rates (McGrath et al. Citation1998) and stocking rates (Macdonald et al. Citation2008). There is, however, a lack of data on the paddock scale impact on total farm productivity. This is surprising given the high number of paddocks per farm and the wide range of soil types in the Waikato region, a major dairying area of New Zealand (Singleton Citation1991). The aim of the current study was to quantify the variability in pasture yield between individual paddocks over a number of years for two research and two commercial farms in the Waikato region of New Zealand.
Materials and methods
Annual paddock pasture yield was evaluated on two research and two commercial dairy farms in the Waikato region of New Zealand. Farm location, data collection period, number of paddocks and entries, and method by which pasture yield (DM) was determined are reported in . The soil type on the research farms was variable, consisting of either weathered alluvial material containing silt, sand and gravel, or peaty material with some soils having both peaty or humic topsoils. The soil type for commercial farm 1 was predominantly alluvium and for commercial farm 2 predominantly peat.
Table 1 Farm location, date of data entry, number of paddocks (N) and data entries (N collected (year × data per paddock)) and method by which pasture accumulation was determined.
Pasture management
Grazing management was similar between research and commercial farms and paddocks as per the decision rules of Macdonald & Penno (Citation1998), with perennial ryegrass dominant swards grazed at 2500 kg DM/ha in spring, 4000 kg DM/ha in summer and 3000 kg DM/ha in autumn and winter (all DM measurements were to ground level). Post-grazing residual stubble heights were approximately 40 mm in height during winter and spring, and 60 mm during summer and autumn.
Yield measurements
Visual estimates of pasture yield on research farms were assessed as outlined by Macdonald et al. (Citation2008). Compressed pasture height on commercial farms was measured weekly by trained dairy research staff using a rising plate meter (RPM) (360 mm diameter, 315 g plate weight) fitted with an electronic counter (Farmworks, Palmerston North, New Zealand). These values were converted to DM yield using regression equations reported by L'Huillier & Thomson (Citation1988). L'Huillier & Thompson (1988) also compared the accuracy of various methods of assessing pasture yield and showed visual and RPM methods to have a residual standard deviation (RSD) of 395 and 410 kg DM/ha. This large RSD was attributed to cutting equipment operator error, not the estimation method per se (Smeaton & Winn Citation1981). L'Huillier and Thomson (Citation1988) found little difference between RPM calibrations for different users when correct procedures were followed, but there was significant variation for herbage mass estimations due to different operators by visual assessment. As the same operator determined paddock pasture yield across each farm, the differences in pasture yield between paddocks attributed to operator would have been minor.
Pasture yield estimates were calculated as the difference in pasture cover (kg DM/ha to ground level) between consecutive readings. Where grazing occurred between pasture cover assessments, the data were considered missing. In these circumstances, grazing residuals were assumed to equate to the lowest pasture cover in the previous week.
Data and statistical analysis
For some paddocks in the datasets, entire months had no data recorded due to grazing, potentially biasing relative annual yield (). Missing values were estimated by calculating the proportion of annual herbage growth contributed on average by each month each year (i.e. for paddocks with data for those months) and applying these proportions to existing data from paddocks that had incomplete datasets.
The normality of paddock yield distribution was determined by the Shapiro-Wilk test. The relationship between average paddock yield, excluding the last calendar year, with the last calendar year, was determined by linear regression.
Results
Paddock yield data and statistics for the farms are reported in . Within farms, the highest yielding paddocks produced between 30 and 122% more pasture DM (kg DM/ha/year) than the lowest yielding, with pasture accumulation for individual paddocks across farms ranging from 9.5 to 26.1t DM/ha/year.
Table 2 Pasture dry matter accumulation (t DM/ha/year) statistics.
The observed paddock pasture yield (t DM/ha/year) and normal frequency of individual paddock average annual production for research farm 1, commercial farm 1 and commercial farm 2 are given in (a), (b) and (c), respectively. Research farm 2 was omitted from due to the relatively small number of paddocks when split into treatments A–D (see ). The Shapiro–Wilk test indicated normality of paddock yield distribution in all the farms, except research farm 1 (p=0.014)
Fig. 1 The observed paddock pasture yield (t DM/ha/year) (![]()
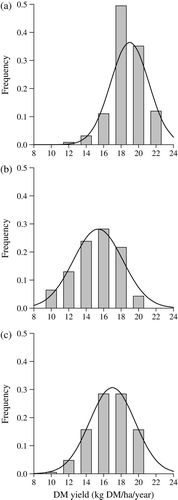
There was a poor correlation between average paddock yield and yield in the last calendar year (Blackmore et al. Citation2003) for research farms 1 (R 2=0.01) and 2 (R 2=0.14).
Discussion
Pasture yield for individual paddocks across farms in the current study ranged from 9.5 to 26.1 t DM/ha/year. There is a paucity of published work with which to compare these results. Trnka et al. (Citation2006) compiled long-term (>20 years) annualised pasture (predominantly perennial ryegrass) yield from three sites in Austria. Mean annual DM yield for pasture cut three times through the season with approximately 30 kg N applied after each cut was 9.4, 8.2 and 7.3 t/ha with minimum and maximum annual DM production in the range 7.4–12.3, 4.7–12.5 and 5.9–8.8 t/ha, respectively for the three sites, equating to a difference of 49–165%, similar to the worst and best producing individual paddocks in the current study. A shorter term study by Xu et al. (Citation2006) showed similar variability of sward DM within a grass silage field over a three-year period, ranging from 3.9–6.7, 2.4–5.2 and 2.2–4.6 t DM/ha for the first, second and third cuts, respectively.
Paddock-scale pasture yields in the current study were highly variable between years, as indicated by the poor correlation between historic mean and last year predicted (i.e. extrapolated) yield. The relationship between historic and extrapolated yield within farms was weak, with coefficients of determination (R 2) of 0.1 or less. Blackmore et al. (Citation2003) analysed spatial and temporal trends in crop yield map data over six years and found that the R 2 between historic and extrapolated future yield was 0.4 at best. The lower correlation between years in the current study as compared with Blackmore et al. (Citation2003) was unexpected. A higher correlation between historic and extrapolated yield was expected for pasture than for crops because carryover yield effects such as compaction and plant density for pasture (i.e. from year to year) can, at least in part, be removed by ploughing and re-seeding crop paddocks. Blackmore et al. (Citation2003) hypothesised that the variability in grain yield between years could be due to variability in the water-holding capacity of the soil. This is supported by a large proportion of crop variability between soil types being explained by soil water holding capacity in the study of Moore & Tyndale-Biscoe (Citation1999) and soil texture within paddocks (Lark et al. Citation1998). Also, Rickard and Radcliffe (Citation1976) showed highly variable dryland pasture growth in New Zealand between years, particularly over summer, with a January and February coefficient of variation of between 82 and 122%, which was reduced to between 12 and 24% with irrigation. Thus, the interaction between soil and environment (weather) within farms should be considered when predicting individual paddock pasture growth and when devising paddock-scale management of inputs and animals. Blackmore et al. (Citation2003) suggest that a spatial and temporal trend map could help in the identification of homogenous management zones for similar management given a defined set of conditions.
The current study showed large variability in individual paddock yield for both commercial and research farms in the Waikato region of New Zealand. This variability presents an opportunity to create homogenous management zones based, for example, on the soil properties of ‘drainage characteristic’ to increase the profitability of New Zealand dairy by enabling ‘zone’-specific management. This site-specific management could maintain or enhance areas of increased pasture growth or help remove causes of growth limitation in areas of low pasture growth.
Acknowledgements
The authors would like to acknowledge DairyNZ for funding this research and the staff of No. 2 Dairy and Scott Farm, specifically Mike Coulter, Jim Lancaster, Julia Lile, Rodger Jensen, Deanne Waugh and DairyNZ's technical staff.
Related Research Data
References
- Blackmore , S , Godwin , RJ and Fountas , S . 2003 . The analysis of spatial and temporal trends in yield map data over six years . Biosystems Engineering , 84 : 455 – 466 .
- Jensen RN , Clark DA , Macdonald KA 2005 . Resource efficient dairing trial: Measurement criteria for farm sysrtms over a range of resource use . Proceedings of the New Zealand Grassland Association 67 : 47 52
- Lark EM Bolan HC Mayr T Bradley RI Burton RGO Dampney PMR The development of cost-effective methods for analysing soil information to define crop management zones London 1998 Home Grown Cereals Authority, Report no. 171
- L'Huillier , PJ and Thomson , NA . 1988 . Estimation of herbage mass in ryegrass/white clover dairy pastures . Proceedings of the New Zealand Grassland Association , 49 : 117 – 122 .
- Macdonald , KA and Penno , JW . 1998 . Management decision rules to optimise milksolids production on dairy farms . Proceedings of the New Zealand Society of Animal Production , 58 : 132 – 135 .
- Macdonald , KA , Penno , JW , Lancaster , JAS and Roche , JR . 2008 . Effect of stocking rate on pasture production, milk production and reproduction of dairy cows in pasture-based systems . Journal of Dairy Science , 91 : 2151 – 2163 .
- McGrath , JM , Penno , JW , Macdonald , KA and Carter , WA . 1998 . Using nitrogen fertiliser to increase dairy farm profitability . Proceedings of the New Zealand Society of Animal Production , 58 : 117 – 120 .
- Moore , GA and Tyndale-Biscoe , JP . 1999 . Estimation of the importance of spatially variable nitrogen application and soil moisture holding capacity to wheat production . Precision Agriculture , 1 : 27 – 38 .
- Rickard , DS and Radcliffe , JE . 1976 . Seasonal distribution of pasture production in New Zealand . New Zealand Journal of Experimental Agriculture , 4 : 329 – 335 .
- Savage , J and Lewis , C . 2005 . Applying science as a tool for dairy farmers . Proceedings of the New Zealand Grassland Association , 67 : 61 – 66 .
- Singleton , PL . 1991 . Soils of Ruakura—a window on the Waikato , Lower Hutt, , New Zealand : DSIR Land Resources .
- Smeaton , DC and Winn , GC . 1981 . Assessment of standing dry matter on hill country by cutting to ground level sources of error . New Zealand Journal of Experimental Agriculture , 9 : 263 – 269 .
- Thom , ER , Waugh , CD and McCabe , RJ . 1998 . Growth and persistence of perennial and hybrid ryegrasses when grazed by dairy cows in the central Waikato region of New Zealand . New Zealand Journal of Agricultural Research , 41 : 477 – 486 .
- Trnka , M , Eitzinger , J , Gruszczynski , G , Buchgraber , K , Resch , R and Schaumberger , A . 2006 . A simple statistical model for predicting herbage production from permanent grassland . Grass and Forage Science , 61 : 253 – 271 .
- Xu , H , Wang , K , Bailey , JS , Jordan , C and Withers , A . 2006 . Temporal stability of sward dry matter and nitrogen yield patterns in temperate grassland . Pedosphere , 16 : 735 – 744 .