Abstract
Excessive amounts of nutrients in rivers promote biological growth of periphyton and macrophytes to nuisance levels. Of most concern, because they are immediately available for growth, are dissolved inorganic forms of nitrogen (N) and phosphorus (P), primarily as nitrate-N and dissolved reactive phosphorus (DRP). To help understand the sources of dissolved nutrients, we estimated and mapped subsurface flow (i.e. leaching) losses of nitrate and DRP. There are large areas of high nitrate leaching in Waikato, Bay of Plenty, Taranaki and Canterbury. The high spatial detail of the maps permits use for planning mitigation at local, regional and national scales. However, they should not be used to infer leaching rates for particular farms as average farming practices are assumed. The nitrate leaching maps were driven primarily by animal numbers, so regional trends of total leached nitrate between 1990 and 2010 were able to be determined from regional statistics of farm animals.
Introduction
Excessive amounts of nutrients in rivers promote biological growth of periphyton and macrophytes to nuisance levels (Davies-Colley & Wilcock Citation2004). This can not only decrease human enjoyment of river environments, but can also degrade aquatic habitats for fish by causing oxygen fluctuation and inducing sedimentation. The nutrients of most concern are dissolved inorganic forms of nitrogen (N) and phosphorus (P) primarily as nitrate-N and dissolved reactive phosphorus (DRP). These N and P forms are immediately available to periphyton and macrophytes for growth (Biggs & Kilroy Citation2004) and in New Zealand they originate primarily from agricultural sources (Elliot & Sorrell Citation2002). While recent research has shown that dissolved organic nitrogen may also contribute to loss of nitrogen from soils (Ghani et al. Citation2010), this form is not immediately available to periphyton and macrophytes. With the intensification of agriculture in certain areas of New Zealand (Ministry for the Environment Citation2007), an associated increase of nutrient concentrations in rivers is likely. Land managers and policymakers would benefit from a national spatial characterization of leached inorganic N and P.
Parfitt et al. (Citation2012) estimated regional average losses of nitrogen for 2010 via subsurface flow, hereafter termed leaching. However, it is also desirable to obtain information at catchment and local scales (i.e. 100-m grid squares) because these are relevant for ecological studies and environmental managers (Heggie & Savage Citation2009). At the farm scale, OVERSEER® (AgResearch Citation2011) is a nutrient budget model that quantifies long-term average N and P inputs and outputs, but the data requirements for model runs usually limit its use to one farm at a time. While OVERSEER® estimates leaching of dissolved N, it estimates P loss as total P. McDowell & Condron (Citation2004) focused on dissolved P by deriving a relationship between the concentration of dissolved P in subsurface flow, or leachate, and the soil properties Olsen P and P retention.
The SPARROW model (Elliot et al. Citation2005) and its successor, CLUES (Woods et al. Citation2006), were developed for estimating nutrient loads of total N and P in rivers at the catchment scale. Neither model estimates dissolved N or DRP, possibly because of the difficulty in estimating attenuation in rivers. Heggie & Savage (Citation2009) also thought that classification of land cover within a sub-catchment to the dominant cover was restrictive. Hence, they developed the Sub-Catchment to Estuary Nitrogen Yield (SCENY) model and applied it to two catchments in the South Island and one in Stewart Island.
Our aim here is to develop a methodology for mapping leaching rates of nitrate and DRP at local scales (100-m grid squares) across New Zealand. This gives us a national perspective, not previously available, on where soils (not other sources) may be impacting most on stream- and river-dissolved N and DRP concentrations. The OVERSEER® model is used to predict nitrate leaching rates per animal for every soil and climate combination in New Zealand. These data are combined with maps of animal numbers to produce a national map of nitrate-N leaching. The temporal trends between 1990 and 2011 for regions are also determined. For DRP, a relationship is derived involving animal numbers and soil properties. This relationship is applied to maps of animal numbers and soil maps to produce a national map of DRP leaching.
Methods
A map of nitrate-N leaching for 2011 was produced by combining a map of animal numbers and estimates of nitrate leaching rates per animal (using ERDAS Imagine software). Animal numbers were estimated by distributing district-level totals (Statistics New Zealand Citation2011) according to land use (AgriBase™: AsureQuality Citation2012) and stock-carrying capacity (Ministry of Works and Development Citation1981a,Citationb). Nitrate leaching under sheep, beef cattle, dairy cattle and deer was considered separately. Nitrate-N leaching rates per animal were estimated for 100 unique soil and climate combinations in New Zealand (i.e. LENZ level II: Leathwick et al. Citation2003) using OVERSEER® (AgResearch Citation2011). Each OVERSEER® run used the most common soil type in the level II land environment, with the stock number being set to the stock-carrying capacity, and with recommended P inputs required to maintain the stock-carrying capacity. In the absence of a more robust method, nitrate leaching on horticultural land was set to twice that estimated for sheep at stock-carrying capacity (Lilburne et al. Citation2010). gives the details of inputs for the OVERSEER® runs and gives examples of estimating nitrate leaching per stock unit for four land environments.
Table 1 Sources of input data for the OVERSEER® model runs (version 5.4) and assumptions for horticulture, shallow soils and irrigated land.
Table 2 Examples of estimating nitrate leaching per stock unit for sheep on four level II land environments.
Temporal trends of total nitrate-N leached for each region between 1990 and 2011 were estimated as follows. Regional average leaching rates per animal were estimated by dividing the total N leached in 2011 by the number of animals in the same year (sheep, beef, dairy animals and deer separately). These regional averages were multiplied by regional animal numbers between 1990 and 2011, as reported by Statistics New Zealand, to obtain the temporal trends for each region. This assumes that leaching rates per animal are independent of stock density and that average farming practices have not changed significantly between 1990 and 2011. OVERSEER® runs under different stocking densities showed that nitrate leaching per animal is indeed insensitive to stocking density. However, we are not in a position to confirm how much average farming practices have changed in the past 20 years with respect to nutrient management.
A phosphorus-leaching map at 2011 was produced by combining a national map of water yield (Dymond et al. Citation2011) with a map of concentration of DRP in subsurface flow. This assumes that most water yield in rivers comes from subsurface rather than overland flow (Davie Citation2004). The map of DRP concentration was produced from an equation relating DRP to the Olsen P and the P retention of the soil through which the water drains (McDowell & Condron Citation2004):
P retention was extracted from the fundamental soil layers (Landcare Research Citation2012). In the absence of a more robust method, the Olsen P required to maintain productivity was estimated as approximately twice the stocking density (stock units. ha−1) minus 7 (Clothier et al. Citation2007; Parfitt et al. Citation2007), and hence inferred from the 2011 map of animal numbers.
Results
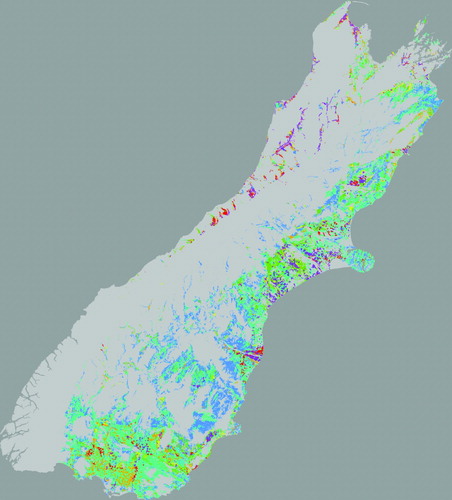
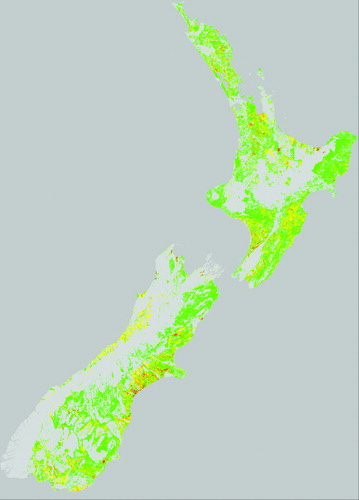
shows the estimated spatial distribution of nitrate-N leaching in the North Island. There are many areas with leaching rates >30 kg N ha−1 yr−1 (shown in purple and red) in the Waikato, Bay of Plenty, Taranaki and along the eastern side of the southern Ruahine and northern Tararua ranges in the Manawatū-Wanganui region. shows the spatial distribution of nitrate-N leaching in the South Island. Leaching rates were generally lower than in the North Island, with the exception of areas in South Canterbury and Southland, which had many areas >30 kg N ha−1 yr−1.
Figure 1 Nitrate leaching (kg nitrate-N ha−1 yr−1) in the North Island: grey (0–2); blue (2–5); teal (5–10); olive green (10–15); yellow (15–20); orange (20–30); red (30–40); purple (>40).
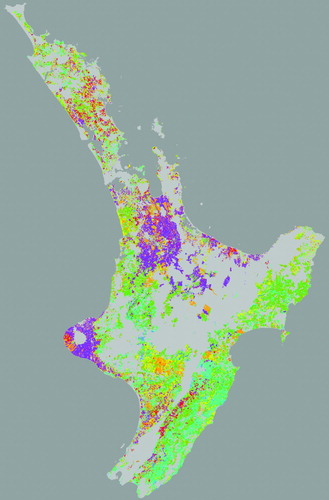
Figure 2 Nitrate leaching (kg nitrate-N ha−1 yr−1) in the South Island: grey (0–2); blue (2–5); teal (5–10); olive green (10–15); yellow (15–20); orange (20–30); red (30–40); purple (>40).
compares the mean nitrate-N concentration of leachate (derived from the estimated nitrate-N leaching maps) with the median concentration of nitrate-N as measured in river water between 1989 and 2007 (Ministry for the Environment Citation2012). The mean nitrate-N concentration of leachate was estimated by dividing the annual nitrate-N leached by the volume of water yield, on a catchment-by-catchment basis (Dymond et al. 2011). With a few exceptions, the median river water concentration was less than the mean leachate concentration. The discrepancy, on average about 50% less, represents the difference between mean and median concentrations in leachate and in the river and the attenuation of nitrate-N between leaching on the land and the downstream site of the river where the water is sampled.
Figure 3 Comparison of the median concentration of nitrate-N (mg L−1) as measured at river site with the catchment mean concentration of nitrate-N (mg L−1) in leachate. The 72 river sites are spread throughout New Zealand. Straight line is y = x.
A–B show total nitrate-N leached per year for each region between 1990 and 2011. The Waikato region exhibited by far the largest loss of N leached—more than 35 million kg N yr−1 since 1994—but this loss has decreased slightly since 2005. Manawatū-Wanganui and Canterbury also have large totals of N leached at approximately 20 million kg N yr−1 in 2010. However, while the annual loss of nitrate-N in Manawatū-Wanganui has remained relatively stable over the past 20 years, annual losses in Canterbury have doubled (due to a 10-fold increase of dairy cattle numbers). Other notable trends are the halving of Auckland's total leaching losses (due to a halving of dairy and beef cattle and a three-quarter reduction of sheep numbers) and the decrease of Bay of Plenty's total leaching loss by 30% (due to a halving of beef cattle and sheep numbers).
Figure 4 Total nitrate-N leached per year between 1990 and 2011. A, North Island regions. B, South Island regions.
shows the estimated spatial distribution of DRP concentration in subsurface flow. The pattern reveals an interaction between stocking density and soil P retention. In the North Island, DRP was predicted to be enriched in coastal Manawatū, southern Hawke's Bay, Wairarapa, central Waikato, and parts of Northland. In the South Island, DRP was estimated to be enriched in Canterbury, Southland and parts of the west coast.
Figure 5 Mean concentration of dissolved reactive phosphorus in subsurface water (mg L−1): grey (0–0.025); green (0.025–0.050); yellow (0.05–0.10); orange (0.1–0.2); and red (>0.2).
compares the median concentration of DRP as measured in river water (Ministry for the Environment Citation2012) with the mean DRP concentration of leachate on a catchment basis. A catchment estimate of DRP in leachate was estimated by combining a national map of water yield (Dymond et al. Citation2011) with the map of concentration of DRP in subsurface flow. Similar to , the median river water concentration is lower than the mean leachate concentration. The discrepancy again represents the difference between the mean and median concentrations in leachate and in the river and the attenuation of DRP between leaching on the land and the downstream site of the river where the water is sampled. Due to the large sorption capacity of most New Zealand soils, the attenuation of DRP is expected to be greater than for nitrate-N (McDowell et al. Citation2004).
Figure 6 Comparison of the median concentration of DRP (mg L−1) as measured at river site with the catchment mean water concentration of DRP (mg L−1). The 72 river sites are spread throughout New Zealand. Straight line is y = x.
Discussion
and give the first national picture of nitrate-N leaching, showing large areas with high leaching rates from the soil. This focuses attention on where mitigation measures need to be targeted. The spatial pattern is mainly driven by mean annual rainfall and stocking density. Regional comparisons show that Waikato, Taranaki, Bay of Plenty and Canterbury all have large areas with high leaching rates and therefore may influence waterways more than other areas.
The temporal trends of nitrate leaching in the regions are mixed. Generally, nitrate leaching in the North Island is trending down because sheep numbers are reducing faster than equivalent dairy cattle numbers are increasing. We would expect to see an associated improvement in water quality. The exception to this is the Waikato region where dairy cattle numbers have increased by a half. Nitrate leaching in the South Island is remaining essentially constant for Tasman and Marlborough. However, for the other South Island regions the trend is upwards due to increasing dairy cattle numbers exceeding the reduction in equivalent sheep numbers. In these regions, we would expect to see an associated decrease in water quality. Canterbury is an extreme case where dairy cattle numbers have increased 10-fold over the past 20 years.
In contrast to the nitrate leaching maps, which show a clear response with agricultural intensity, DRP leaching maps show a complex interaction between agricultural intensity, climate, and soil properties. To avoid complexity, we excluded the effect of climate by considering DRP concentration on its own. The areas with high DRP concentration of leachate tended to have a high stocking density and/or moderate to low soil P retention. For example, Taranaki, with a high stocking density, has low DRP concentrations due to high P retention of soils, while southern Hawke's Bay, with a moderate stocking density, has high DRP concentrations due to low P retention of soils.
The accuracy of the nutrient leaching maps can only be as good as the accuracy of the underlying models. The OVERSEER® model has an accuracy of approximately ±20% (Ledgard & Waller 2001) and the DRP relationship (McDowell & Condron Citation2004) has an accuracy of approximately ±30%. Although the nitrate leaching map may be considered robust, within given caveats, the DRP leaching map should be considered as preliminary only. As McDowell & Condron (Citation2004) noted, the DRP relationship in Equation Equation1 is dependent on a few data points (42) with much leverage. Furthermore, it is only applicable to pasture soils that have not been recently grazed.
In addition to these inherent uncertainties, the mapping method for nitrate leaching groups all the soil and climate variability in New Zealand into one of 100 classes. For example: there may be soil variation within each LENZ II class, but we take the dominant soil; and there may be spatial variation of mean annual rainfall within each LENZ II class, but we take the spatial average in the class for input to OVERSEER®. By comparing OVERSEER® runs at random points using all available soils information with the standard runs in the LENZ II soil-climate classes, we determined that this source of uncertainty is ±10%. Assuming independence, the two sources of uncertainty combine to make approximately ±25% for the nitrate leaching map.
Regional values of nutrient leaching will have much less uncertainty because errors will tend to cancel out over large areas, leaving only systematic errors. The uncertainty of the temporal trend is therefore likely to be much smaller, relating to the uncertainty of animal numbers only (c. 2%). We have not attempted to assign an uncertainty to the assumed no-change in average farmer practices between 1990 and 2011. In the absence of data on management practice for all farms in New Zealand, the nutrient leaching maps assume average farmer practices, which we assume to include effective nutrient and dairy effluent management and avoidance of direct excreta connectivity to waterways (Ledgard & Waller Citation2001). The stocking rates are also assumed to be the average for that particular type of land and land use. For this reason, the maps should not be used to infer leaching for any particular farm. They may be used to predict the general spatial pattern in a district. However, to estimate individual farm losses it is necessary to run OVERSEER® with the actual stocking rates and management practices applied.
Conclusions
A national map of nitrate-N leaching shows that the Waikato, Manawatū-Wanganui and Canterbury regions have the highest totals of nitrate-N leached at approximately 35 million, 20 million and 20 million kg nitrate-N yr−1, respectively. Over the past 20 years, Waikato and Manawatū-Wanganui totals of nitrate leached have remained essentially static, but the Canterbury total has doubled. Other regions have smaller totals and show a mix of decreasing and increasing totals of nitrate leached. The spatial pattern of nitrate-N leaching is mainly driven by mean annual rainfall and stocking density. The DRP leaching maps show a complex interaction between agricultural intensity, climate and soil properties. The high spatial detail of the maps permits use for planning mitigation at local, regional and national scales.
Acknowledgements
The Ministry of Science and Innovation funded this research primarily through the Ecosystem Services for Multiple Outcomes programme (under contract C09X0912), but also through the Clean Water Productive Land programme (under contract C10X1006).
References
- AgResearch 2011 . OVERSEER® http://www.agresearch.co.nz/our-science/land-environment/nutrient-management/Pages/overseer.aspx (accessed 16 October 2012) .
- AsureQuality 2012 . AgriBase™ . http://www.asurequality.com/capturing-information-technology-across-the-supply-chain/agribase-database-for-nz-rural-properties.cfm (accessed 16 October 2012) .
- Biggs , B and Kilroy , C . 2004 . “ Periphyton ” . In Freshwaters of New Zealand , Edited by: Harding , J , Mosley , P , Pearson , C and Sorrel , B . 15.1 – 25 . Christchurch : Caxton Press .
- Clothier B , Mackay A , Carran A , Gray R , Parfitt R , et al. , 2007 . Farm strategies for contaminant management . SLURI Report. http://www.horizons.govt.nz/assets/horizons/Images/one_plan/Farm%20Strategies%20for%20Contaminant%20Management%20June%202007.pdf (accessed 16 October 2012) .
- Davie , T . 2004 . “ Soil water, runoff and streamflow generation ” . In Freshwaters of New Zealand , Edited by: Harding , J , Mosley , P , Pearson , C and Sorrel , B . 4.1 – 4.10 . Christchurch : Caxton Press .
- Davies-Colley , R and Wilcock , B . 2004 . “ Water quality and chemistry in running waters ” . In Freshwaters of New Zealand , Edited by: Harding , J , Mosley , P , Pearson , C and Sorrel , B . 11.1 – 11.17 . Christchurch : Caxton Press .
- Dymond , JR , Ausseil , A-G , Ekanayake , J and Kirschbaum , MUF . 2011 . Tradeoffs between soil, water, and carbon—a national scale analysis from New Zealand . Journal of Environmental Management , 95 : 124 – 131 . doi: 10.1016/j.jenvman.2011.09.019
- Elliot , A , Alexander , R , Schwarz , G , Shankar , U , Sukias , J and McBride , G . 2005 . Estimation of nutrient sources and transport for New Zealand using the bydrid mechanistic-statistical model SPARROW . Journal of Hydrology (New Zealand) , 44 : 1 – 27 .
- Elliot , AH and Sorrell , BK . 2002 . Lake managers' handbook—land water interactions , Wellington : Ministry for the Environment .
- Ghani , A , Muller , K , Dodd , M and Mackay , A . 2010 . Dissolved organic matter leaching in some contrasting New Zealand soils . European Journal of Soil Science , 61 : 525 – 538 . doi: 10.1111/j.1365-2389.2010.01246.x
- Heggie , K and Savage , C . 2009 . Nitrogen yields from New Zealand coastal catchments to receiving estuaries . New Zealand Journal of Marine and Freshwater Research , 43 : 1039 – 1052 . doi: 10.1080/00288330.2009.9626527
- Landcare Research 2012 . Maps of fundamental soil layers . http://soils.landcareresearch.co.nz/contents/SoilData_FSL_Maps.aspx?currentPage=SoilData_FSL_Maps&menuItem=SoilData (accessed 16 October 2012) .
- Leathwick J , Wilson G , Rutledge D , Wardle P , Morgan F , Johnston K , McLeod M , Kirkpatrick R 2003 . Land environments of New Zealand . David Bateman , Auckland . 184 p.
- Ledgard SF , Waller JE 2001 . Precision of estimates of nitrate leaching in OVERSEER® . Report FertResearch . AgResearch , Ruakara . 16 p.
- Lilburne L , Webb T , Ford R , Bidwell V 2010 . Estimating nitrate-nitrogen leaching rates under rural land uses in Canterbury . Report No R10/127 . Environment Canterbury , Christchurch . 37 p.
- McDowell , RW , Biggs , BJF , Sharpley , AN and Nguyen , L . 2004 . Connecting phosphorus loss from land to surface water quality . Chemistry and Ecology (London) , 20 : 1 – 40 . doi: 10.1080/02757540310001626092
- McDowell , RW and Condron , LM . 2004 . Estimating phosphorus loss from New Zealand grassland soils . New Zealand Journal of Agricultural Research , 47 : 137 – 145 . doi: 10.1080/00288233.2004.9513581
- Ministry for the Environment 2007 . Environment New Zealand 2007 . http://www.mfe.govt.nz/publications/ser/enz07-dec07/ (accessed 16 October 2012) .
- Ministry for the Environment 2012 . Water quality trends at National River Water Quality Network sites for 1989–2007 . http://www.mfe.govt.nz/publications/water/water-quality-trends-1989-2007/index.html (accessed 16 October 2012) .
- Ministry of Works and Development 1981a . Stock carrying capacities and fertilizer data for the North Island . Aokautere internal report No. 22 Wellington . Aokautere Science Centre, National Water and Soil Conservation Organisation, Ministry of Works and Development
- Ministry of Works and Development 1981b . Stock carrying capacities and fertilizer data for the South Island . Aokautere internal report No. 23 . Wellington . Aokautere Science Centre, National Water and Soil Conservation Organisation, Ministry of Works and Development
- Parfitt R , Dymond J , Ausseil A-G , Clothier B , Deurer M , Gillingham A , et al. 2007 . Best practice phosphorus losses from agricultural land . Landcare Research Contract Report: LC0708/012. http://www.horizons.govt.nz/assets/horizons/Images/one-plan-tech-reports-public/Best%20Practice%20Phosphorus%20Losses%20from%20Agricultural%20Landsmall.pdf (accessed 16 October 2012) .
- Parfitt RL , Stevenson BA , Dymond JR , Schipper LA , Baisden WT , Ballantine DJ 2012 . Nitrogen inputs and outputs for New Zealand from 1990 to 2010 at national and regional scales . New Zealand Journal of Agricultural Research 55 : 241 – 262 . doi: 10.1080/00288233.2012.676991
- Statistics New Zealand 2011 . Agricultural production statistics 2011 tables . http://www.stats.govt.nz/browse_for_stats/industry_sectors/agriculture-horticulture-forestry/AgriculturalProduction_HOTPJun11prov/Tables.aspx (accessed 16 October 2012) .
- Woods R , Elliott S , Shankar U , Bidwell V , Harris S , Wheeler D , Clothier B , Green S , Hewitt A , Gibb R , Parfitt R 2006 . The CLUES project: predicting the effects of land use on water quality—stage II . National Institute of Water and Atmospheric Research Report prepared for Ministry of Agriculture and Forestry (New Zealand) . http://maxa.maf.govt.nz/mafnet/rural-nz/sustainable-resource-user/clues/stage-2/ (accessed 30 November 2012) .