
Abstract
It has been previously hypothesised that the treading of pastures by grazing animals can increase nitrous oxide (N2O) emissions as the result of reduced plant N uptake. In addition, grazing animals urinate and defecate on to soils which can also increase the N2O emissions. To avoid these additional N inputs, a treading machine was used in two field experiments where the pre-grazing dry matter (DM) was present or removed to test the above hypothesis. The N2O emissions were measured for 47 and 30 days afterwards, respectively. The soil nitrate (NO3−–N) pool was 15N labelled prior to treading in Experiment 2. Treading induced greater N2O emissions and reduced herbage DM yields (by 31%–41%) and soil NO3−–N concentrations when soil gravimetric water contents ranged from 0.45 to 0.63 g water/g soil. A comparison of treading in the presence and absence of pre-grazing DM showed that reduced plant N uptake did not induce greater N2O emissions. Rather, the 15N labelling of the NO3−–N pool indicated this pool contributed to the N2O emissions under treading. In addition, 15N labelling showed other soil–N pools became available as a consequence of either, (1) treading inducing soil perturbation and releasing N from the soil organic matter–N and/or plant root–N pools, or (2) as a result of simulated grazing causing the release of plant root–N. Soil water soluble carbon (C) also increased under treading in the absence of pasture, supporting the theory that organic–N was released from either the soil organic matter (OM) or plant root pools. Further research should investigate the effect of treading on the turnover and contribution of organic–N pools (roots, OM) in pasture soils in order to more fully understand the contributions these make to background N2O emissions and effects on N and C cycling in pasture soils.
Introduction
Anthropogenic emissions of nitrous oxide (N2O) are of environmental concern because N2O is both a precursor to compounds involved in stratospheric ozone depletion (Ravishankara et al. Citation2009) and a greenhouse gas, with a global warming potential of 298 over a 100-year timeframe (Forster et al. Citation2007). Intensively managed grazed pastures emit N2O due to regular anthropogenic nitrogen (N) inputs (fertiliser and biological N fixation), animal excreta and animal-induced soil compaction (Oenema et al. Citation1997). Emissions of N2O are exacerbated under wet and saturated soil conditions due to reduced aeration (Luo et al. Citation2008; Balaine et al. Citation2013). Animal treading can compact soil creating anaerobic soil conditions (Van Groenigen et al. Citation2005). In the presence of animal excreta, which provides abundant carbon (C) and N substrates, animal treading can enhance N2O production due to soil compaction (Van Groenigen et al. Citation2005). Few studies have examined the effects of animal treading on N2O emissions in the absence of N application to soils via animal excreta or fertilisers. In one of these, Menneer et al. (Citation2005a) showed that N2O emissions were three to six times higher 8 d after severe treading compared with no treading. Menneer et al. (Citation2005a) reasoned that the higher emissions were due to: (1) compaction of the soil resulting in reduced soil aeration and enhanced denitrification rates; and (2) treading reducing plant growth and thereby reducing plant N uptake, which provided soil microorganisms with more substrate for N2O production. However, consideration was not given to the possibility that N embodied in the plant tissues was released into the soil as a consequence of leaf burial or root damage during treading, and that such pasture-derived N might have contributed to N2O emissions. Pasture leaf tissues may contribute to N2O emissions. For example, plant material harvested, but not ingested, by dairy cattle falls to the soil surface where up to 1% of the embodied N may be released as N2O (Pal et al. Citation2012, Citation2013). The following study was designed to examine the potential for pasture–N to contribute to N2O emissions following animal treading. It was hypothesised that N embodied in the trodden pasture would contribute to soil inorganic–N pools and the N2O emissions.
Materials and methods
Experimental site and preparation
Two experimental sites were located in two paddocks at the Lincoln University Dairy Farm (43°38.59′S, 172°26.21′E; elevation 13 m). The soil at both sites was a strongly gleyed, Temuka clay loam (Typic Orthic Gley; [Hewitt Citation1998]) with impeded subsoil drainage. The pasture species included perennial ryegrass (Lolium perenne L.) and white clover (Trifolium repens L.) which were regularly grazed by dairy cows as previously described (Pal et al. Citation2012). To avoid the antecedent excreta effects of grazing animals, pasture areas (15 × 20 m) were fenced and animals excluded for six months prior to commencing the experiments. Experiment 1 was performed in paddock 1 beginning in winter (July–October 2010) when soils are wettest and treading effects most likely to be the greatest. This paddock had been sown 3.5 years before the experiment with a mixture of ‘Arrow’ and ‘Alto’ perennial ryegrass cultivars. Experiment 2 was performed in paddock 2 in late autumn (April–May 2011), the paddock having been sown seven years earlier with ‘Bealey’ perennial ryegrass. Otherwise, the two paddocks were identically managed.
Experimental design and treatments
A randomised block design was used in Experiment 1. The four treatments included two levels of herbage (pre-grazing dry matter [DM] present/pre-grazing DM removed subsequently denoted by H1/H0, respectively) and two levels of treading (present/absent denoted by T1/T0, respectively). Each treatment was replicated five times (Fig. S1). Each treatment was imposed on a c. 0.3 m2 area equally split between a soil sampling area for measurement of inorganic–N concentrations and pH and an N2O emissions measurement area (Fig. S1).
For the DM removal (H0) treatment, the herbage was harvested using electric clippers (Oster Shearmaster®, USA) to a height of 1 cm immediately prior to imposing the treading treatments, removed and dried at 65 °C for 48 h to determine kg DM/ha. Removing the DM leaf material to a 1 cm height was performed to reduce the potential for pasture N uptake. Representative subsamples were ground (<200 µm) in preparation for total C and N analyses using standard procedures described by Rowland & Roberts (Citation1994).
For the treading treatment (T1), a mechanical hoof (hoof print area 90 cm2; [Di et al. Citation2001]) was used. This mimicked the hoof of a Friesian cow which weighed 450 kg, and following Di et al. (Citation2001), applied 220 kPa of pressure on the soil surface at a rate of 377 hoofs/m2. The treatment combination H1T0 was undisturbed pasture and hence, the control treatment.
The randomised block design in Experiment 2 had the same treatments as Experiment 1, except the chamber base areas received fertiliser–15N prior to treading (each replicated five times) and there was an additional ‘control’ chamber where no fertiliser or treading were imposed, giving a total of five treatments (Fig. S2). Fertiliser–15N was applied in Experiment 2 to distinguish the contributions of soil inorganic–N and plant-derived inorganic–N to N2O emissions. Thus 15N-enriched 15NH415NO3 (10 atom% 15N) was applied at the rate of 50 kg N/ha in a water solution (300 mL/chamber) immediately prior to imposing the treatments. The control treatment received an equal volume of deionised water.
One month prior to the start of the experiments, pasture was mown to a height of 10 cm and the cut herbage distributed evenly across the soil surface. Before imposing the treatments, on average, paddock 1 had 1584 ± 110 kg DM/ha (n = 10) on offer. At paddock 2, the corresponding value was not significantly different, averaging 1636 ± 335 kg DM/ha (n = 10). This mass of DM simulated the pre-grazing DM on offer at the Lincoln University Dairy Farm during 2010–11 (Pal et al. Citation2012).
Soil, herbage and gas sampling and meteorological measurements
Thirty soil cores (7.5 cm depth × 2.5 cm diameter) were collected from each experimental site, prior to the start of each experiment. These were bulked and submitted for analysis to a commercial laboratory (Hill Laboratories, Hamilton, New Zealand). In both Experiments 1 and 2, further soil cores were taken after treatment applications and analysed for inorganic–N and water soluble C (WSC). This occurred on 11 occasions in both Experiment 1 (days 1, 2, 3, 4, 6, 11, 14, 17, 28, 38 and 47) and Experiment 2 (days 1, 2, 3, 4, 6, 9, 12, 13, 16, 23 and 30).
To examine if treading affected plant–N content and to determine the regrowth of trodden pasture, herbage from all plots in both Experiments 1 and 2 was clipped to a 1 cm height, 90 d after treatment application and analysed for total N and C after drying and grinding (Rowland & Roberts Citation1994). Prior to determining soil inorganic–N, WSC concentrations and inorganic–N 15N enrichment, a subsample of soil was dried at 105 °C for 24 h to determine the gravimetric soil water content (θg). Soil inorganic–N concentrations were determined by shaking the subsampled soil with 2 M KCl in a 1:10 ratio (soil: KCl) on an end-over-end shaker for 1 h followed by centrifugation of the extract at 2000 rev/min (480 g) for 10 min and then filtering (Whatman No. 42). Analyses for ammonium (NH4+–N) and nitrate (NO3−–N) were performed on an Alpkem FS3000 twin channel flow injection analyser (FIA) (Alpkem, College Station, TX, USA) according to Blakemore et al. (Citation1987) using a colorimetric method. For WSC determinations, a subsample of soil was extracted with deionised water in a 1:10 ratio (soil: water) for 30 min on an end-over-end shaker, followed by centrifugation (750 g) of the extractant for 20 min, and filtration (0.45 µm cellulose nitrate membrane filter; [Ghani et al. Citation2003]) prior to analysis for total organic–C on a Shimadzu total organic carbon analyser TOC 5000A (Shimadzu Oceania, Sydney, Australia) fitted with a Shimadzu ASI–5000A autosampler. Surface soil pH was determined on all gas sampling occasions using a Hanna HI 9025C portable pH meter fitted with a soil surface probe (Broadley-James Corporation, Irvine, CA, USA), after moistening the soil surface with a drop of deionised water. In Experiment 2, 15N enrichment of the soil inorganic–N pools was determined using the diffusion technique of Brooks et al. (Citation1989) for days 1 to 4 after treatment application. Concentrations of soil inorganic–N after day 4 were below detectable levels for analysis of inorganic–N 15N enrichment.
Soil bulk densities (five replicates) for all treatments were determined at the end of the experimental period. Soil cores (9 cm diameter × 12 cm deep) were taken from inside the chamber area, θg was determined and bulk density calculated, assuming a soil particle density of 2.65 Mg/m3. Soil bulk densities were calculated for depths of 0–3, 3–6, 6–12 and 0–12 cm. Soil temperature (at 10 cm depth), air temperature and rainfall data were obtained from a meteorological station, 1 km away from the field sites.
For soil N2O emission measurements, headspace chamber bases (45 cm diameter, stainless steel) protruded 12 cm into the soil. These bases contained an annular water-filled trough which provided a gas-tight seal during gas sampling. During gas sampling events, stainless steel chambers (insulated with polystyrene foam; 45 cm diameter, 12 cm high) created a 19.1 L headspace when placed on the bases. For Experiments 1 and 2, soil N2O flux sampling was performed on 17 occasions over 47 and 30 d, respectively, after treatment application. Samples were taken between 1000 and 1200 h to minimise any effect of diurnal variation (Das et al. Citation2013; Van der Weerden et al. Citation2013a).
Gas samples (10 mL) were manually drawn, using glass syringes fitted with three-way taps, and compressed into 6 mL Exetainer® vials (Labco, High Wycombe, UK) at 0, 30 and 60 min, after positioning the headspace cover. Immediately before analysis for N2O, these gas samples were brought to ambient pressure using a double-ended needle and analysed on a gas chromatograph (8610, SRI Instruments, Torrance, CA) linked to an autosampler (Gilson 222XL, Middleton, WI), as described by Clough et al. (Citation2010). Gas flux calculations were performed using the method of Hutchinson & Mosier (Citation1981). For Experiment 2, 15 mL headspace gas samples were also taken after 3 h. These gas samples were placed into 12 mL Exetainer® vials and equilibrated to atmospheric pressure, immediately prior to determining the N2O–15N enrichment, using an automated continuous flow isotope ratio mass spectrometer (CF–IRMS), Sercon, UK (Stevens et al. Citation1993).
Statistical analysis
Gas flux data were tested for normality using the Anderson-Darling test and if the data were skewed, it was loge-transformed (ln[flux+1]) to attain normality (Press et al. Citation1989). The statistical software Minitab version 16.0 (Minitab Citation2006) was used to perform the analysis of variance (ANOVA) on the flux data to determine if treatment means differed significantly with 95% confidence (P < 0.05). Treatment differences were tested using Tukey's test. All data presented here are mean ± SD (standard deviation).
Results
Experiment 1
Soil properties and meteorological data
Soil chemical properties were suitable for high pasture DM production (). During the experiment, the highest rainfall (23 mm) occurred on day 38, followed by days 8 and 21 with 4 and 7 mm, respectively (Fig. S3). The average daily air and soil (10 cm depth) temperatures ranged from 1.2 to 14.7 °C and from 2.4 to 9.3 °C, respectively (Fig. S3). Soil θg ranged from 0.45 to 0.63 g water/g soil (Fig. S3).
Table 1 Chemical properties of the soil used during the study at paddocks 1 and 2.
Dry matter production, C and N contents
Nitrogen and C contents of the herbage prior to treatment application for Experiment 1 were 37 ± 5 mg N/g DM and 388 ± 9 mg C/g DM (n = 10), respectively. Ninety days after treading, the DM yield was lower (P < 0.05; n = 5) than in the non-trodden plots, averaging 1333 ± 273 and 2257 ± 135 kg DM/ha for the H1T1 and H1T0 treatments, respectively. The DM yields for the corresponding nil-herbage treatments averaged 808 ± 144 and 937 ± 202 kg DM/ha for the H0T1 and H0T0 treatments, respectively, with no treading effect occurring.
Soil pH, soil bulk density and soil gravimetric water content
The treatments had no significant effect on soil bulk density which averaged 0.74 ± 0.14, 1.0 ± 0.10, 1.07 ± 0.05 and 0.97 ± 0.07 Mg/m3 (n = 12) in the 0–3, 3–6, 6–12 and 0–12 cm depths, respectively. Daily average soil pH values ranged from 6.4 to 7.2 (n = 20 on each occasion) and were unaffected by treatment. Under treading, soil θg was higher (P < 0.05) with herbage present in the H1T1 treatment (0.56 g water/g dry soil) than in the H0T1 treatment (0.49 g water/g dry soil), while it was 0.52 and 0.66 g water/g soil in the H1T0 and H0T0 (non-trodden) treatments, respectively. Using the mean bulk density of 0.87 Mg/m3, these values translated to soil volumetric water contents of 0.49, 0.43, 0.45 and 0.57 m3 water/m3 soil in the H1T1, H0T1, H1T0 and H0T0 treatments, respectively.
Soil inorganic–N and WSC
On day 1, NH4+–N concentrations were higher (P < 0.05) in the presence of herbage (ranging from 13.5 to 14.8 µg/g dry soil) than in the nil herbage treatments (ranging from 9.8 to 11.4 µg/g dry soil) with no effect of treading. Soil NH4+–N concentrations remained higher (P < 0.05) in the control (H1T0) than the other treatments until day 6 but from day 11 onwards, concentrations did not differ with treatment ().
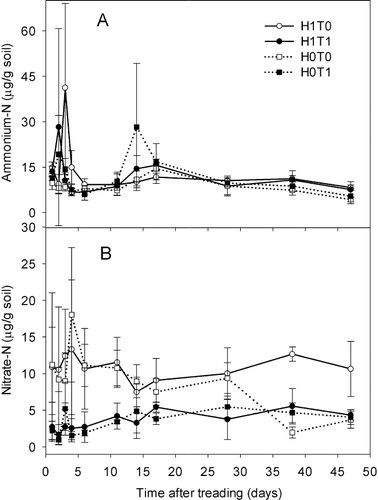
Soil NO3−–N concentrations were higher in the H1T0 treatment during most soil sampling events (). Treading corresponded with decreased (P < 0.001) soil NO3−–N concentrations throughout the experiment irrespective of the presence or absence of pre-grazing DM (). Soil NO3−–N concentrations in the H0T1 and H1T1 treatments averaged 3.5 and 3.5 µg/g soil, respectively, while in the H0T0 and H1T0 treatments, the respective values were 9.2 and 10.0 µg/g soil (). A herbage × treading interaction occurred on days 38 and 47 with higher (P < 0.05) NO3 -N concentrations recorded in the presence of pre-grazing DM without treading (H1T0).
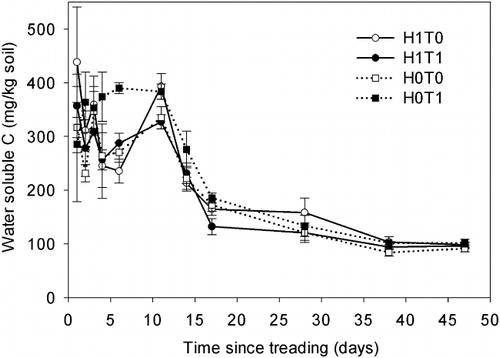
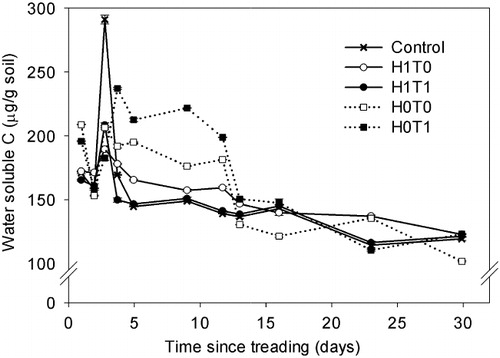
Over the experimental period, mean soil WSC concentrations were 268 ± 32, 247 ± 33, 226 ± 21 and 223 ± 24 µg/g, in the H0T1, H1T0, H1T1 and H0T0 treatments, respectively (). The WSC concentrations were higher (P < 0.001) on days 2, 4, 6 and 14 () in the H0T1. Mean WSC concentrations declined after day 1 until day 6, except in the H0T1 treatment, whereupon an increase occurred until day 11, followed by a decline in all treatments ().
Nitrous oxide emissions
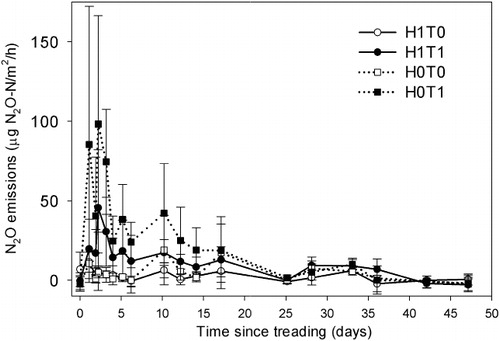
On day 1, none of the treatments had significantly affected the N2O emissions (). However, from days 2 to 14, both treading treatments induced higher N2O emissions (P < 0.05), more so for the H1T1 treatment than the H1T0 treatment (). The highest N2O emissions (P < 0.05) were observed on day 2 and averaged (± SD) 98 ± 68, = 46 ± 37, > 5 ± 3, = 5 ± 12 µg N2O–N/m2/h for the H0T1, H1T1, H0T0 and H1T0 treatments, respectively (). Emissions of N2O under treading treatments were significant (10- to 20-fold higher than control levels; P < 0.05) until day 14 with maximum values on day 2 ranging from 2 to 40 g N2O–N/ha/d. Cumulative N2O emissions in the treading treatments were higher (P < 0.05) and ranged from 9.3 to 16.7 mg N2O–N/m2. In the treading treatments, the bulk of the N2O emissions occurred within the first 14 days, and from days 17 to 47, treatments had no effect on N2O emissions.
Experiment 2
Soil properties and meteorological data
The soil's chemical properties were suitable for high pasture DM production (). The highest rainfall event occurred on day 30 (16 mm), followed by day 9 and day 10 with 7 and 15 mm, respectively (Fig. S4). The average daily air and soil temperatures ranged from 5.3 to 17.6 °C and 7.9 to 14.5 °C, respectively (Fig. S4). Soil θg ranged from 0.50 to 0.59 g water/g soil and fluctuated with rainfall (Fig. S4).
Dry matter production, C and N contents
In Experiment 2, prior to applying treatments, there was 1636 ± 335 kg DM/ha with N and C contents of 33 ± 7 and 402 ± 6 mg/g, respectively, and a 15N enrichment of 0.367 ± 0.02 atom% (n = 10). Ninety days after imposing treading, DM yields were lower due to treading (P < 0.05; n = 5) averaging 1807 ± 379 and 2608 ± 341 kg DM/ha in the H1T1 and H1T0 treatments, respectively. In the H0T1 and H0T0 treatments, the corresponding values were 990 ± 218 and 1080 ± 261 kg DM/ha, respectively, with no effect of treading. Dry matter 15N enrichment in the 15N fertilised plots averaged 1.57 ± 0.25 atom% with no treatment effect, while the 15N enrichment of the control remained at 0.367 ± 0.01 atom%.
Soil pH, soil bulk density and soil gravimetric water content
The treatments had no significant effect on soil pH which ranged from 6.1 to 7.9. Soil bulk density also did not differ with treatment, at any depth, and averaged 0.69 ± 0.23, 0.99 ± 0.11, 1.05 ± 0.07 and 0.91 ± 0.14 Mg/m3 (n = 12) in the 0–3, 3–6, 6–12 and 0–12 cm depths, respectively. In the H1T0 treatment, θg averaged 0.53 g water/g soil (θv = 0.45 m3/m3) and this was higher (P < 0.05) than in the H1T1 treatment (θg = 0.44 g water/g soil; θv = 0.37 m3/m3) on days 2, 9, 12 and 30 due to rainfall. On the remaining days, values did not differ with treatment ranging from 0.54 to 0.60 g water/g soil (θv ranged from 0.45 to 0.50 m3/m3).
Soil inorganic–N and WSC
Soil NH4+–N concentrations were higher (P < 0.05) in the H1T0 treatment than in the H0T0 treatment on most days except days 3 and 4 (). Analysis of 15N enrichment for NH4+ could not be performed as the soil extract concentrations were too low. Soil NO3−–N concentrations were lower in the H0T1 treatment on most days except days 2, 3 and 9, when concentrations did not differ due to treatments (). From day 16 onwards, NO3−–N concentrations were lower (P < 0.05) in the H0T1 treatment than the other treatments, and by day 30, concentrations in the H1T1 treatment were higher (P < 0.05) than in the other treatments. The 15N enrichment of the soil NO3−–N pool was lower (P < 0.001) in the H0T1 treatment on days 1 and 2 () when compared with the remaining treatments. On day 4, the lowest 15NO3−–N enrichment occurred in the H0T1 treatment, with H0T0 and H1T1 having the highest values (). Treading corresponded with increased WSC concentrations in the absence of DM; the H0T1 treatment had higher (P < 0.001) WSC than in the H0T0 treatment from day 4 until day 12 but treatments did not differ after this time ().
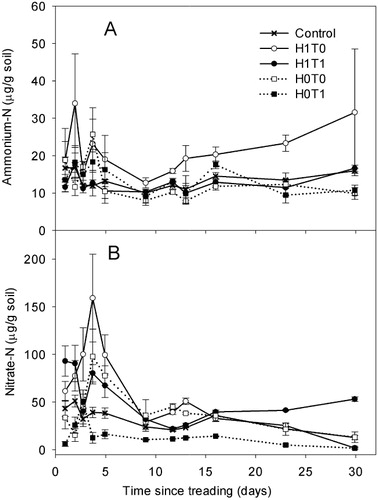
Table 2 Enrichment of 15N in soil NO3− in treatments over time.
Nitrous oxide emissions and 15N enrichment
Emissions of N2O from the control were lower (P < 0.05) than the other treatments throughout the experiment (). Treading corresponded with reduced (P < 0.05) N2O emissions on days 1, 11 and 12, while the only effect of pasture being present was significantly reduced emissions on days 1 and 12 (). Cumulative N2O emissions over 30 d were lower (P < 0.05) in the control treatment while the values from other treatments did not differ significantly from each other averaging 1.9 ± 0.6, 2.0 ± 1.3, 1.6 ± 0.5, 1.6 ± 0.8 and 0.5 ± 0.2 g N2O–N/m2 in the H0T0, H0T1, H1T0, H1T1 and control treatments, respectively.
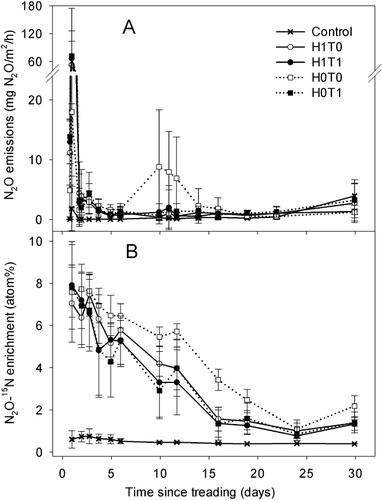
The 15N enrichment of the N2O was lowest in the control treatment, ranging from 0.36 to 0.38 atom%, (). In the H0T0 treatment, the 15N enrichment of the N2O generally remained higher (P < 0.05) between day 5 and 30, averaging 4.2 atom% over this period (). Mean 15N enrichment of N2O in the other treatments declined over time from an initial mean of 7.6 atom% (). Averaged over the experimental period, the 15N enrichments of the N2O equated to 5.3, 4.0, 4.3, 4.0 and 0.37 atom% in the H0T0, H0T1, H1T0, H1T1 and control treatments, respectively.
Discussion
As noted above, animal treading may enhance N2O emissions. In the absence of fertiliser and excreta, Menneer et al. (Citation2005a) observed N2O emissions that were three- to six-fold higher for 21 d after treading, with a maximum of 52 g N2O–N/ha/d on day 8. The effect of simulated treading on N2O emissions in Experiment 1 was comparable.
Reduced DM yields, of 31%–41%, observed under treading in our experiments are in accordance with earlier work showing treading adversely affects shoot and root growth (Cook et al. Citation1996; Nadian et al. Citation1996; Drewry et al. Citation2001; Menneer et al. Citation2005b; Drewry et al. Citation2008). Thus, according to the first hypothesis proposed by Menneer et al. (Citation2005a), the reduced pasture growth under treading, observed in Experiments 1 and 2, should have reduced plant N demand and reduced plant competition for soil NH4+–N and NO3−–N. This should have enhanced substrate supply for the microorganisms responsible for generating N2O emissions. A comparison of the H1T0 and H0T0 treatments allows this hypothesis to be more rigorously assessed, since the latter treatment had pre-grazing DM removed and thus potential ‘plant–N uptake’ was severely reduced. However, in Experiment 1, soil NH4+ concentrations were actually higher when DM was present. Similarly, the soil NO3−–N concentrations in Experiment 1 did not vary between the H1T0 and H0T0 treatments until day 27. In Experiment 2, soil NH4+ concentrations were higher at most sampling times when DM was untrodden. The period of high N2O fluxes, in Experiment 2, also coincided with a trend for soil NO3−–N concentrations to be higher in the presence of DM (H1T0). This indicates that the removal of plant N uptake, as a consequence of damage to antecedent DM via treading, did not significantly enhance the substrate supply to microorganisms that produce N2O emissions.
Under treading, DM yields declined, so plant N uptake must have been lower. Assuming that the leaf N concentrations observed in Experiments 1 and 2 on day 0 remained constant after treading, and multiplying by the reductions in DM yield, suggests that treading reduced plant N uptake by 26–34 kg N/ha. Further assuming a soil bulk density of 1.0 Mg/m3 and a soil depth of 0.1 m, the reduced N uptake ranges from 26–34 µg N/g soil or <1 µg N/g soil/d. Thus, if treading increases N2O emissions, this should not be attributed to reduced N uptake. Based on these arguments, we reject the first hypothesis.
The second hypothesis proposed by Menneer et al. (Citation2005a) attributed higher N2O emissions following treading to soil compaction inducing a higher denitrification rate. As a corollary, treading should also increase the soil's bulk density. This did not happen in Experiments 1 and 2. However, the changes in θg indicate that treading altered the soil's pore size distribution. Most likely, this involved an increased percentage of finer pores which should correspond with reduced soil aeration and increased N2O production, depending on soil moisture content (Balaine et al. Citation2013). In Experiment 1, pasture herbage evidently protected the soil from treading damage since θg was consistently higher when herbage was present under treading. Conversely, in Experiment 2, θg in the H1T1 treatment was lower than in the H1T0 treatment, suggesting the herbage had not protected the soil from treading. The soil moisture contents were sufficient for denitrification to occur (Dalal et al. Citation2003; Van der Weerden et al. Citation2013b). Further supporting the second hypothesis of Menneer et al. (Citation2005a) were the lower soil NO3−–N concentrations observed under the treading treatments (Experiments 1 and 2). Based on these arguments, we cannot reject the second hypothesis.
Finally, Experiment 2 also showed that in the presence of herbage, the N2O–15N enrichment was not affected by treading. However, when herbage was removed, the N2O–15N enrichment was lower with treading than without it. This indicated the 15N-enriched NO3−–N pool supplying the N2O production pathways had been diluted by contribution(s) from an antecedent 14N pool(s). This may have come from soil organic–N or plant root–N, made available as a consequence of treading physically perturbing the soil. Alternatively, plant root–N may have been released in response to cutting of the pasture on day 0 (Macduff & Jackson Citation1992). Interestingly, WSC levels were highest under treading in the absence of pasture (Experiments 1 and 2) which further suggests treading had promoted either the breaking down of plant roots or soil organic matter. This, and dilution of the NO3 –15N pool under treading, also raises a question about how treading influences turnover of organic–N pools (roots, soil organic matter) in pasture soils and the subsequent N transformations.
For dairy cattle grazing, the most susceptible periods when treading damage to soil may occur are autumn, winter and spring, when soil moisture levels are high (Drewry Citation2006). Thus, poorly drained soils in high rainfall areas are most susceptible, especially if stocking rates are high. Natural recovery of soils from treading-induced soil compaction is a cyclical process that may occur over weeks to years (Drewry Citation2006). Thus, given typical grazing rotations on dairy farms are in the order of weeks, the most appropriate way to avoid treading inducing N2O emissions is to prevent it occurring. Luo et al. (Citation2010) suggest the use of a winter stand-off pad could be effective at reducing N2O emissions from a dairy farm. The results of the current study also show that N2O emissions under treading are also dependent on inorganic–N concentrations in the soil. Hence, optimising N supply and demand by appropriately timing fertiliser and dairy effluent applications to the soil, to maximise plant uptake prior to treading, would assist in reducing N2O emissions.
Conclusion
Following simulated animal treading, soil inorganic–N was the main N source for N2O production. Compaction by animal treading changed the soil's water storage capacity and pore size distribution near the soil surface; the reduced aeration evidently contributed to the increased N2O emissions. This study supports previous hypotheses that N2O fluxes following treading are driven by antecedent inorganic–N pools, governed by reduced aeration according to soil wetness. In addition, this study has shown treading induced an N-priming effect with organic matter–N in the soil and/or plant root–N contributing to the N2O flux.
Supplementary files
Supplementary file 1: Figure 1. Field layout of paddock 1 for Experiment 1 showing the position of the gas chambers and soil sampling plots for the treading and herbage treated plots.
Supplementary file 2: Figure 2. Field layout of paddock 2 for Experiment 2 showing the position of the gas chambers and soil sampling plots for the treading and herbage treated plots.
Supplementary file 3: Figure 3. Meteorological data during the experimental period 1 July–17 August 2010 at paddock 1 for Experiment 1. Rainfall, air temperature and soil temperature (10 cm) are daily average values. Gravimetric water content was measured at 0–7.5 cm soil depth.
Supplementary file 4: Figure 4. Meteorological data during the experimental period 8 April–8 May 2011 at paddock 2 for Experiment 2. Rainfall, air temperature and soil temperature (10 cm) are daily average values. Gravimetric water content was measured at 0–7.5 cm soil depth.
Figure S4. Meteorological data during the experimental period 8 April–8 May 2011 at paddock 2 for Experiment 2. Rainfall, air temperature and soil temperature (10 cm) are daily average values.
Download TIFF Image (318.6 KB)Figure S3. Meteorological data during the experimental period 1 July–17 August 2010 at paddock 1 for Experiment 1. Rainfall, air temperature and soil temperature (10 cm) are daily average values.
Download TIFF Image (282.3 KB)Figure S2. Field layout of paddock 2 for Experiment 2 showing the position of the gas chambers and soil sampling plots for the treading and herbage treated plots.
Download TIFF Image (828.9 KB)Figure S1. Field layout of paddock 1 for Experiment 1 showing the position of the gas chambers and soil sampling plots for the treading and herbage treated plots.
Download TIFF Image (1,001 KB)Acknowledgements
Manaaki Whenua Landcare Research, Lincoln, provided funding to the senior author. We are grateful to Shreeparna Pal, Neil Smith, Roger Atkinson and Chris Abraham for assistance in fieldwork and treatment application; and Manjula Premaratne, Qian Liang, Vicky Zhang and Roger Cresswell for GC, inorganic–N, herbage and isotopic analysis, respectively.
References
- Balaine N, Clough TJ, Beare MH, Thomas SM, Meenken ED, Ross JG 2013. Changes in relative gas diffusivity explain soil nitrous oxide flux dynamics. Soil Science Society of America Journal 77: 1496–1505. 10.2136/sssaj2013.04.0141
- Blakemore LC, Searle PL, Daly BK 1987. Methods for chemical analysis of soils. NZ Soil Bureau Scientific Report 80. NZ Soil Bureau, Lower Hutt, New Zealand. Pp. 78–79.
- Brooks PD, Stark JM, McInteer BB, Preston T 1989. Diffusion method to prepare soil extracts for automated nitrogen-15 analysis. Soil Science Society of America Journal 53: 1707–1711. 10.2136/sssaj1989.03615995005300060016x
- Clough TJ, Bertram JE, Ray JL, Condron LM, O'Callaghan M, Sherlock RR et al. 2010. Unweathered wood biochar impact on nitrous oxide emissions from a bovine-urine-amended pasture soil. Soil Science Society of America Journal 74: 852–860. 10.2136/sssaj2009.0185
- Cook A, Marriott CA, Seel W, Mullins CE 1996. Effects of soil mechanical impedance on root and shoot growth of Lolium perenne L., Agrostis capillaris and Trifolium repens L. Journal of Experimental Botany 47: 1075–1084. 10.1093/jxb/47.8.1075
- Dalal RC, Wang W, Robertson GP, Parton WJ 2003. Nitrous oxide emission from Australian agricultural lands and mitigation options: a review. Australian Journal of Soil Research 41: 165–195. 10.1071/SR02064
- Das BT, Hamonts K, Moltchanova E, Clough TJ, Condron LM, Wakelin SA et al. 2013. Influence of photosynthetically active radiation on diurnal N2O emissions under ruminant urine patches. New Zealand Journal of Agricultural Research 55: 319–331. 10.1080/00288233.2012.697068
- Di HJ, Cameron KC, Milne J, Drewry JJ, Smith NP, Hendry T et al. 2001. A mechanical hoof for simulating animal treading under controlled conditions. New Zealand Journal of Agricultural Research 44: 111–116. 10.1080/00288233.2001.9513465
- Drewry JJ 2006. Natural recovery of soil physical properties from treading damage of pastoral soils in New Zealand and Australia: a review. Agriculture, Ecosystems and Environment 114: 159–169. 10.1016/j.agee.2005.11.028
- Drewry JJ, Cameron KC, Buchan GD 2001. Effect of simulated dairy cow treading on soil physical properties and ryegrass pasture yield. New Zealand Journal of Agricultural Research 44: 181–190. 10.1080/00288233.2001.9513476
- Drewry JJ, Cameron KC, Buchan GD 2008. Pasture yield and soil physical property responses to soil compaction from treading and grazing - a review. Australian Journal of Soil Research 46: 237–256. 10.1071/SR07125
- Forster P, Ramaswamy V, Artaxo P, Berntsen T, Betts R, Fahey DW et al. 2007. Changes in atmospheric constituents and in radiative forcing. In: Solomon S, Qin D, Manning M, Chen Z, Marquis M, Averyt KB, Tignor M, Miller HL eds. Climate change 2007: the physical science basis. Contribution of working group I to the fourth assessment report of the intergovernmental panel on climate change. Cambridge and New York, NY, Cambridge University Press, Pp. 129–234.
- Ghani A, Dexter M, Perrott KW 2003. Hot-water extractable carbon in soils: a sensitive measurement for determining impacts of fertilisation, grazing and cultivation. Soil Biology and Biochemistry 35: 1231–1243. 10.1016/S0038-0717(03)00186-X
- Hewitt AE 1998. New Zealand soil classification. Landcare Research Science Series. 2nd edition. Lincoln, Manaki Whenua Press.
- Hutchinson GL, Mosier A 1981. Improved soil cover method for field measurement of nitrous oxide fluxes. Soil Science Society of America Journal 45: 311–316. 10.2136/sssaj1981.03615995004500020017x
- Luo J, De Klein CAM, Ledgard SF, Saggar S 2010. Management options to reduce nitrous oxide emissions from intensively grazed pastures: a review. Agriculture, Ecosystems and Environment 136: 282–291. 10.1016/j.agee.2009.12.003
- Luo J, Ledgard SF, Lindsey SB 2008. A test of a winter farm management option for mitigating nitrous oxide emissions from a dairy farm. Soil Use and Management 24: 121–130. 10.1111/j.1475-2743.2007.00140.x
- Macduff JH, Jackson SB 1992. Influx and efflux of nitrate and ammonium in Italian ryegrass and white clover roots: comparisons between effects of darkness and defoliation. Journal of Experimental Botany 43: 525–535. 10.1093/jxb/43.4.525
- Menneer JC, Ledgard S, McLay C, Silvester W 2005a. Animal treading stimulates denitrification in soil under pasture. Soil Biology and Biochemistry 37: 1625–1629. 10.1016/j.soilbio.2005.01.023
- Menneer JC, Ledgard S, McLay C, Silvester W 2005b. The effects of treading by dairy cows during wet soil conditions on white clover productivity, growth and morphology in a white clover-perennial ryegrass pasture. Grass and Forage Science 60: 46–58. 10.1111/j.1365-2494.2005.00450.x
- Minitab 2006. Minitab Pty. Ltd., Level 6. Sydney, NSW. 2000.
- Nadian H, Smith SE, Alston AM, Murray RS 1996. The effect of soil compaction on growth and P uptake by Trifolium subterraneum: interactions with mycorrhizal colonisation. Plant and Soil 182: 39–49. 10.1007/BF00010993
- Oenema O, Velthof GL, Yamulki S, Jarvis SC 1997. Nitrous oxide emissions from grazed grassland. Soil Use and Management 13: 288–295. 10.1111/j.1475-2743.1997.tb00600.x
- Pal P, Clough TJ, Kelliher FM, Sherlock RR 2013. Nitrous oxide emissions from in situ deposition of 15N-labelled ryegrass litter in a pasture soil. Journal of Environmental Quality 42: 323–331. 10.2134/jeq2012.0271
- Pal P, Clough TJ, Kelliher FM, Van Koten C, Sherlock RR 2012. Intensive cattle grazing affects pasture litter-fall – an unrecognised nitrous oxide source. Journal of Environmental Quality 41(2): 444–448. 10.2134/jeq2011.0277
- Press WH, Flannery BP, Teukolsky SA, Vetterling WT 1989. Numerical recipes. Cambridge, Cambridge University Press.
- Ravishankara AR, Daniel JS, Portmann RW 2009. Nitrous oxide (N2O): the dominant ozone-depleting substance emitted in the 21st century. Science 326: 123–125. 10.1126/science.1176985
- Rowland AP, Roberts JD 1994. Lignin and cellulose fractionation in decomposition studies using acid-detergent fibre methods. Communications in Soil Science and Plant Analysis 25: 269–277. 10.1080/00103629409369035
- Stevens RJ, Laughlin RJ, Atkins GJ, Prosser SJ 1993. Automated determination of nitrogen-15-labeled dinitrogen and nitrous oxide by mass spectrometry. Soil Science Society of America Journal 57: 981–988. 10.2136/sssaj1993.03615995005700040017x
- Van der Weerden TJ, Clough TJ, Styles TM 2013a. Using near-continuous measurements of N2O emission from urine-affected soil to guide manual gas sampling regimes. New Zealand Journal of Agricultural Research 56: 60–76. 10.1080/00288233.2012.747548
- Van der Weerden TJ, Kelliher FM, De Klein CAM 2013b. Influence of pore size distribution and soil water content on nitrous oxide emissions. Soil Research 50: 125–135.
- Van Groenigen JW, Velthof GL, Van der Bolt FJE, Vos A, Kuikman PJ 2005. Seasonal variation in N2O emissions from urine patches: effects of urine concentration, soil compaction and dung. Plant and Soil 273: 15–27. 10.1007/s11104-004-6261-2