
Abstract
Nitrogen (N) can be lost to the atmosphere by nitrous oxide (N2O) flux from soils. For pastoral soils, N is applied in N fertiliser and excreta deposited by farmed, grazing animals. We postulated that soil N2O flux would be linearly related to the N application rate (Nrate). As a test, we applied eight treatments as rates of urea (0–1500 kg N ha−1) to samples of a pastoral soil and measured the N2O flux, pH and ammonium (NH4+) and nitrate (NO3−) concentrations at intervals for 67 days. When fluxes were accumulated, the variability or variance of treated replicates increased with time and increasing Nrate. For 67-day, cumulative N2O fluxes, a linear regression with the N application rate, weighted by the inverse of the replicates' variance, yielded a statistically significant relationship (P < 0.05), accounting for 92% of the variability. A second-order term was too small to be statistically significant for another regression using a polynomial function. Thus, there was no evidence to reject the linear hypothesis. The fluxes were also related to the pH and (NH4+ + NO3−) concentration. These relationships warrant further study in different soils under field conditions.
Keywords:
Introduction
The quantity of nitrogen (N) in fertiliser sold in New Zealand has increased from 59 to 363 Gg N y−1 between 1990 and 2012 (Ministry for the Environment Citation2014). Another form of N applied to New Zealand's pastoral soils is excreta deposited by farmed, grazing animals, 1439 and 1554 Gg N y−1 for 1990 and 2012, respectively (Ministry for the Environment Citation2014). The nitrous oxide (N2O) flux from soils is a loss of N to the atmosphere. The temporally integrated or cumulative N2O flux from soils can be postulated to be linearly related to the N application rate (Nrate), and the relationship's slope has been called an emission factor (EF). However, under field conditions in New Zealand, de Klein et al. (Citation2014) reported a statistically significant (P < 0.05) trend of increasing EF with increasing N application rate for two pastoral soils, suggesting a curvilinear relationship between the cumulative N2O flux and N application rate. In contrast, for another pastoral soil studied by de Klein et al. (Citation2014), the EF did not depend on the N application rate. Under field conditions in Ireland, Selbie et al. (Citationin press) reported the EF of a pastoral soil decreased significantly with increasing N application rate. Moreover, under field conditions in England, Wales and the Netherlands, for four pastoral soils, linear and non-linear relationships were observed between the cumulative N2O flux and the N application rate (e.g. Velthof et al. Citation1997; Cardenas et al. Citation2010a,Citationb). Under field conditions, testing a hypothesis involving one variable can be challenging if additional, uncontrolled variables are also influential. For example, in addition to the N application rate, the N2O flux can potentially be affected by a soil's N mineralisation rate and plant N uptake (Ma et al. Citation2010). Alternatively, although artificial, environmental conditions can be controlled in a laboratory, soil samples can be incubated without plants and the effects of one variable on the N2O flux studied. Here, we present the results of such an experiment designed to test a hypothesis: the cumulative, soil N2O flux will be linearly related to the N application rate.
Materials and methods
Soil samples for the experiment were collected from a dairy farm near Lincoln (43°38.70′S, 172°28.62′E). The soil is called Temuka silt loam (Hewitt Citation2010). At eight, randomly located positions in a representative paddock, soil was excavated by digging pits from the surface to a depth of 0.1 m. According to the farm owner, the sampled paddock had not been grazed for the previous 6 weeks. The bulk density of the sampled soil averaged 900 ± 100 (± SE) kg m−3. The soil's pH (H2O) and carbon and N contents were 6.2, 7.3% and 0.7%, respectively, measured by methods described below. The principal pasture species were perennial ryegrass (Lolium perenne L.) and white clover (Trifolium repens L.).
The soil was passed through a 4 mm sieve, thoroughly mixed and sampled for water content determination (105 °C oven drying, overnight). Samples (0.45 kg dry soil equivalent) were packed into glass jars (diameter 80 mm, height 200 mm, total volume 1 L). The soil sample occupied half of the jar's volume, leaving a 100 mm deep headspace. The jars were placed in an air-conditioned room with the temperature set to 17 ± 2 °C for 2 weeks of pre-incubation. Before the experiment commenced, the water content was adjusted by adding deionised water to fill 80% of the soil's pore space (80% WFPS). Thereafter, by watering three times a week (c. 25 mL applied each time), the samples were maintained at this water content. This simulated a regular rainfall and/or irrigation regime. The choices of temperature and WFPS for incubation were intended to be optimal for N2O flux (Müller & Sherlock Citation2004).
The soil was subjected to treatment according to eight levels of N application rate in the form of urea including 0, 25, 50, 100, 250, 500, 1000 and 1500 kg N ha−1, denoted as control, N25, N50, N100, N250, N500, N1000 and N1500, respectively. Urea is New Zealand's preferred N fertiliser and the principal N component of sheep and cattle urine (de Klein et al. Citation2003). The treatments were applied evenly by pipette across the soil samples' surface as a 10 mL urea-N aliquot with the required N concentration (0 to 2.69 M). Each treatment had 10 replicates, accounting for the 80 jars. For each treatment, five jars were used to measure the N2O flux: three for soil NH4+–N and NO3−–N, and two for soil pH. The urea was fertiliser grade, and before preparing aliquots, three urea subsamples were analysed using a CHN analyser (LECO CHN 1000, St Joseph, MI, USA) with a resulting N concentration of 46.2 ± 0.4%.
Soil pH was measured on nine occasions: one day before and 2.5 hours, 1, 3, 9, 17, 23, 25 and 39 days after N application. Additional measurements were made on day 108 for each treatment using soil from two jars that had been used for gas sampling. The soil was subsampled as for the soil inorganic-N measurements: 5 g of fresh sample was vigorously shaken with 25 mL deionised water for 30 s, set on a bench for 2 min, and measured with a portable pH meter (EXTECH PH110) following a two-point calibration.
Soil inorganic-N concentrations (NH4+–N and NO3−–N) were measured on nine occasions: days 1, 2, 10, 15, 25, 37, 45, 59 and 67 after N application until all soil in the jars had been sampled. Additional measurements were made on day 108 for each treatment using soil from three jars that had been used for gas sampling. Subsampling was conducted using an open-sided steel tube (8 mm OD , 0.5 mm wall). Afterwards, the hole was filled by inserting a 100 mm long, 8 mm diameter wooden plug. A wooden stick (diameter 6 mm) was used to push off the soil core and the core cut at the midpoint, producing upper and lower subsamples. The extraction and analyses were performed on the subsamples. Two grams of fresh soil were extracted by 2 M KCl (1:10) for 1 h on an overhead shaker and filtered. The colorimetric method and auto-analyser had detection limits for NO3−–N, NO2−–N and NH4+–N of 0.10, 0.10 and 0.01 mg L−1, respectively (Alpkem FS3000 twin channel analyser, application notes P/N A002380 and P/N A002423). As the NO2−–N concentration was close to the detection limit in all samples and two- to three-fold lower than the NO3−–N concentration, the results reported as NO3−–N concentrations actually comprised a sum of the NO2−–N and NO3−–N concentrations.
For N2O flux measurement, the jars were sealed by screw-on lids. Gas sampling began with the collection of three ambient air samples. Gas samples (8 mL) were taken from the jars 30 min after sealing using a gas-tight syringe via septa embedded in the lids of the jars and afterwards transferred into a 6 mL Exetainer®, over-pressurisation preventing ambient air contamination. The 30 min sealing time was selected based on earlier measurements of the same soil which showed the increase in N2O concentration over 60 min was linear in the jars after sealing for all treatments. To complete the gas sampling, after collecting samples from the jars, another set of three ambient air samples were collected. The mean concentrations of N2O in the ambient air before and after the gas collection were used as a zero-time point for the flux calculation. For this calculation:
Gas sampling was done over 67 days for the N25, N50, N100, N250 and N500 treatments, and 108 days for the Control, N1000 and N1500 treatments, respectively. Prior to N application, a baseline N2O flux was measured for each soil sample. After N application, gas sampling was done after 6 h and on days 1, 2, 4, 6 and 10, and thereafter twice a week until day 67. For the Control, N1000 and N1500, gas sampling was also performed on days 80, 87, 94 and 108.
The gas chromatography (GC) system was similar to that described by Mosier & Mack (Citation1980) with some distinguishing features. Briefly, the gas samples were analysed within 48 h of sampling on a GC (model 8610, SRI Instruments, CA) interfaced to an auto-sampler (Gilson 222XL, Middleton, WI, USA) with N2 as the carrier gas. A purpose-built double-concentric injection needle (PDZ-Europa, Crewe, UK) pierced the Exetainer® cap and rapidly flushed the gas into GC columns packed with Haysep Q (OD 3 mm, pre-column of length 1 m and analytical column, 6 m) set at an operation temperature of 35 °C. The N2O concentration was quantified by a 63Ni electron capture detector (ECD) operated at 320 °C. The GC system was calibrated using an appropriate selection from standards with N2O concentrations of 0 (N2 gas), 0.32 (air), 0.5, 1, 2, 5, 10, 20 and 50 µL L−1. The GC system's precision was assessed regularly by measuring the N2O concentration of 20 background air samples, and typically, the standard deviation was 1.25% of the mean. Combining this percentage, a 1 × 10⁻³ m deep headspace (V/A) and the jar's sealed period of 0.5 h, we calculated the minimum N2O emission rate that could be reliably measured, 2.1 × 10⁻³ mg N2O–N m−2 h−1 including twice the SD for 95% confidence.
For each jar, the N2O fluxes, the pH and the inorganic-N concentrations were temporally integrated by the trapezoidal method. These data were accumulated over 67 days and subjected to regression analysis. Regression included linear and curvilinear (second-order polynomial) models and for the linear model, each treatment was either weighted by the inverse of the replicates' variance or not. Fits of the regression model to the data were assessed using residual plots. The assumption of normally distributed errors, a requirement of regression analysis, was checked by normal quantile-quantile plots of the residuals. The analysis was done using R (R Core Team Citation2014).
Results
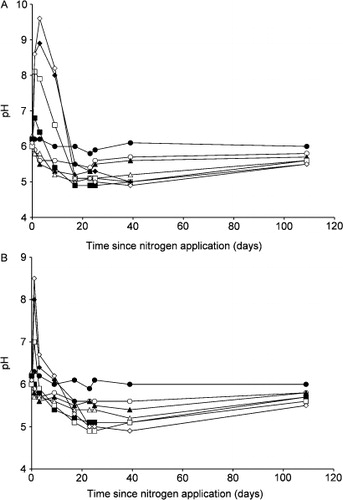
After N application, there were some significant, proportional changes in soil pH (). However, for the controls, upper section (0–5 cm), the pH did not change significantly over 108 days (P > 0.05). Moreover, for N25, N50 and N100 (upper section), the pH declined steadily by about 1 unit over the first 19 days. Afterwards, for these treatments, the pH increased gradually to the controls' level over the next 89 days. In contrast, for N250 and N500, 1 day after N application, the pH increased to maxima of 6.8 and 8.1, respectively, and for N1000 and N1500, 2 days after N application, to maxima of 8.9 and 9.6, respectively. Afterwards, the pH decreased to about 5.0 by day 23. Then there was a gradual increase of about 0.5 units by day 108. There were broadly similar, but lesser, changes of pH in the lower sections (5–10 cm, ).
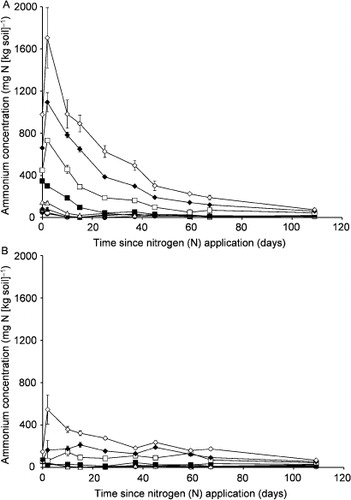
After N application, for the upper sections, there were also changes in soil mineral NH4+–N concentration in all treatments except the controls, where the NH4+–N concentration was less than 50 mg kg−1 over 108 days (). On day 1, the maximum NH4+–N concentration increased with increasing N application rate, up to 1706 mg kg−1 in the N1500 treatment. The NH4+–N concentration returned to the controls' level over the following 1 (N25) to 107 days (N1000 and N1500). In the lower sections, soil NH4+–N concentration increased significantly only in the N500, N1000 and N1500 treatments. Maxima were reached over 2 to 15 days, and returned to the controls’ level by day 108.
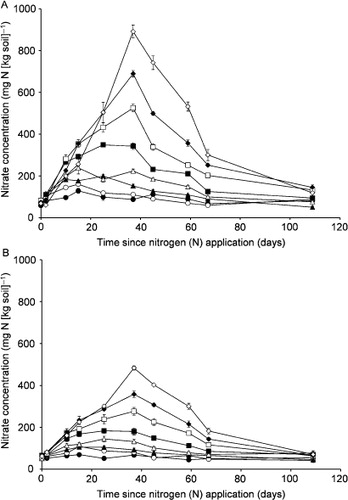
After N application, there were significant, proportional changes in soil NO3−–N concentration (). However, for the controls, the NO3−–N concentration was <100 mg kg−1 over 108 days. In the upper sections, the soil NO3−–N concentration was up to 891 mg kg−1 on day 37 for the N1500 treatment. The soil NO3−–N concentrations returned to the controls’ level on days 37, 45 and 67 for N25, N50 and N100 and day 108 for N250, N500, N1000 and N1500, respectively. In the lower sections, the soil NO3−–N concentration was up to 483 mg kg−1 on day 37 for N1500, afterwards returning to the controls’ level.
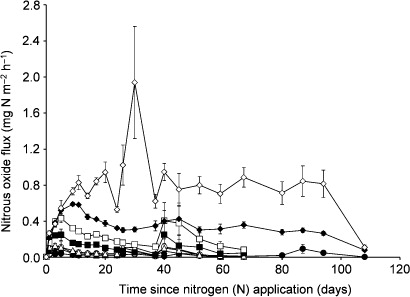
The N2O fluxes ranged from 0.03 mg N m−2 h−1 for the controls on day 1 to 1.94 mg N m−2 h−1 for N1500 on day 31 (). For one jar of the controls, the N2O fluxes were inexplicably 10 times larger than that of the others, so it was excluded from the data analysis. For N25 and N50, 6 h and 1 day after N application, the fluxes had increased significantly, but thereafter, they were not significantly different from the controls. For N100 and 250, the fluxes increased significantly for 2 and 6 days after N application, respectively. On day 40, the means for N25, N50, N100 and N250 seemed to suggest a second peak, but these data had actually not changed significantly (P > 0.05). For N500, N1000 and N1500, 6–10 days after N application, the fluxes had increased to their maxima and they stayed around these levels for 67–94 days.
Discussion
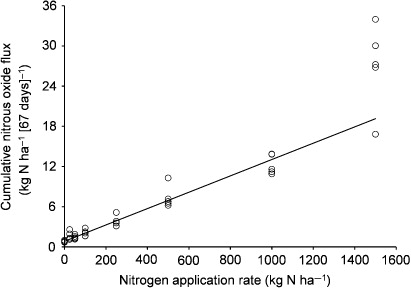
For the N2O fluxes accumulated over 67 days, linear regression with the N application rate (Nrate, kg N ha−1) yielded N2O flux = (0.0122 ± 0.0006) * Nrate + 0.8352 ± 0.0626, a statistically significant relationship (P < 0.05) accounting for 92% of the variability (). Except for the 1500 kg N ha−1 treatment, for which the N2O flux replicates were most variable, the regression line bisected the data well. Variability of the N2O flux replicates increased with increasing Nrate and period of accumulation (data not shown). For the data accumulated over 67 days, a quantile-quantile plot of the linear regression residuals indicated the least and relatively small departures from normally distributed errors (data not shown). For another regression of the 67-day cumulative N2O flux and Nrate data using a curvilinear model, the second-order (squared) term was too small to be statistically significant (P > 0.05). Thus, there was no evidence to reject the linear hypothesis.
We applied N to the soil samples in the form of an aqueous urea solution. As stated, urea is New Zealand's preferred N fertiliser and although urea is also the principal form of N in the urine of sheep and cattle, we acknowledge urine includes other constituents. For example, hippuric acid in urine has been identified as a catalyst of urea hydrolysis (Whitehead et al. Citation1989). Kool et al. (Citation2006) reported that the application of hippuric acid and synthetic urine to soil under controlled, laboratory conditions corresponded with significantly lower N2O fluxes than when the urine alone had been applied. Alternatively, the results of a field trial conducted near Lincoln suggested no effect of hippuric acid concentration in dairy cattle urine on N2O fluxes from the urine applied to soil beneath pasture (Clough et al. Citation2009).
After we had applied N to the soil samples, especially for N1500, the pH, NH4+–N and NO3−–N concentrations and the N2O flux increased rapidly and significantly. Urea hydrolysis would account for the soil's response of increased pH over the first c. 3 days. Except for N25 and N50, the maximum N2O fluxes and soil NH4+–N contents occurred only days after urea application to the soil, consistent with the expected pattern of nitrification following an application of urine (Clough et al. Citation2003a). Although WFPS of the soil samples in this study averaged 80%, this pattern suggested there may have been some drier zones. When lime and urea were applied to soil samples in another study, the N2O flux response was actually negative when water content was near the field capacity and only positive when the samples were wetter (Clough et al. Citation2003b, Citation2004). In this study, for up to 108 days, N application induced elevated N2O fluxes and soil NO3−–N concentrations, suggesting denitrification had also contributed to N2O production in the soil. Nitrification and denitrification rates in soils have been reported to increase with increasing pH from acidic to neutral or slightly alkaline conditions (Focht & Verstraete Citation1977; Müller et al. Citation1980; Granli & Bøckman Citation1994; Šimek et al. Citation2002). For cumulative N2O fluxes, linear regressions with the corresponding accumulated values of the pH and (NH4+ + NO3−) concentration measurements were statistically significant (data not shown). These relationships add to our conclusion that cumulative N2O fluxes from the samples of a pastoral soil were linearly related to the N application rate in the laboratory and warrant further study in different soils under field conditions.
Acknowledgements
The experiment was conducted when the first two authors were employed by Manaaki Whenua Landcare Research. Funding came from the New Zealand Foundation for Research, Science, and Technology (Contract No. C09X0701). We thank Tony McSeveny and Graeme Rogers for helping us collect the soil samples. Rob Sherlock and Roger Cresswell generously shared their facilities and Laura Buckthought assisted with the measurements. We are grateful to Tim Clough, Cecile de Klein Harold Henderson and Simon Wear for valuable discussions, and Chikako van Koten, Tony van der Weerden and anonymous reviewers for constructive critiques.
References
- Cardenas LM, Thorman R, Ashlee N, Butler M, Chadwick D, Chambers B et al. 2010a. Quantifying annual N2O emissions fluxes from grazed grassland under a range of inorganic fertiliser nitrogen inputs. Agriculture, Ecosystems and Environment 136: 218–226. 10.1016/j.agee.2009.12.006
- Cardenas LM, Thorman R, Ashlee N, Butler M, Chadwick D, Chambers B et al. 2010b. Erratum to “Quantifying annual N2O emissions fluxes from grazed grassland under a range of inorganic fertiliser nitrogen inputs”. Agriculture, Ecosystems and Environment 138: 356. 10.1016/j.agee.2010.05.002
- Clough TJ, Sherlock RR, Mautner MN, Milligan DB, Wilson PF, Freeman CG et al. 2003a. Emission of nitrogen oxides and ammonia from varying rates of applied synthetic urine and correlations with soil chemistry. Australian Journal of Soil Research 41: 421–438. 10.1071/SR02105
- Clough TJ, Sherlock RR, Kelliher FM 2003b. Can liming mitigate N2O fluxes from a urine-amended soil? Australian Journal of Soil Research 41: 439–457. 10.1071/SR02079
- Clough TJ, Kelliher FM, Sherlock RR, Ford CE 2004. Lime and soil moisture effects on nitrous oxide emissions from a urine patch. Journal of Environmental Quality 68: 1600–1609.
- Clough TJ, Ray JL, Buckthought LE, Calder J, Baird D, O'Callaghan M et al. 2009. The mitigation potential of hippuric acid on N2O emissions from urine patches: an in situ determination of its effect. Soil Biology and Biochemistry 41: 2222–2229. 10.1016/j.soilbio.2009.07.032
- de Klein CAM, Barton L, Sherlock RR, Li Z, Littlejohn RP 2003. Estimating a nitrous oxide emission factor for animal urine from some New Zealand pastoral soils. Australian Journal of Soil Research 41: 381–399. 10.1071/SR02128
- de Klein CAM, Luo J, Woodward KB, Styles T, Wise B, Lindsey S et al. 2014. The effect of nitrogen concentration in synthetic cattle urine on nitrous oxide emissions. Agriculture, Ecosystems and Environment 188: 85–92. 10.1016/j.agee.2014.02.020
- Focht DD, Verstraete W 1977. Biochemical ecology of nitrification and denitrification. In: Alexander M ed. Advances in microbial ecology. Volume 1. London, Plenum Press. Pp. 135–214.
- Granli T, Bøckman OC 1994. Nitrous oxide from agriculture. Norwegian Journal of Agricultural Science, Supplement 12: 7–127.
- Hewitt AE 2010. New Zealand soil classification. Landcare Research Science Series 1. 3rd edition. Lincoln, Manaaki-Whenua Press. 136 p.
- Kool DM, Hoffland E, Hummelink EWJ, van Groenigen JW 2006. Increased hippuric acid content of urine can reduce soil N2O fluxes. Soil Biology and Biochemistry 38: 1021–1027. 10.1016/j.soilbio.2005.08.017
- Ma BL, Wu TY, Tremblay M, Deen W, Morrison MJ, McLaughlin MB et al. 2010. Nitrous oxide fluxes from corn fields: on-farm assessment of the amount and timing of nitrogen fertilizer. Global Change Biology 16: 156–170. 10.1111/j.1365-2486.2009.01932.x
- Ministry for the Environment 2014. New Zealand's greenhouse gas inventory 1990–2012. http://www.mfe.govt.nz/publications/climate/greenhouse-gas-inventory-2014/index.html (accessed 8 May 2014).
- Mosier A, Mack L 1980. Gas chromatographic system for precise, rapid analysis of nitrous oxide. Soil Science Society of America Journal 44: 1121–1123. 10.2136/sssaj1980.03615995004400050048x
- Müller C, Sherlock RR 2004. Nitrous oxide emissions from temperate grassland ecosystems in the Northern and Southern Hemispheres. Global Biogeochemical Cycles 18: GB 1045.
- Müller MM, Sundman V, Skujins J 1980. Denitrification in low pH spodosols and peats determined with the acetylene inhibition method. Applied and Environmental Microbiology 40: 235–239.
- R Core Team 2014. R: a language and environment for statistical computing. Vienna, R Foundation for Statistical Computing. http://www.R-project.org/ (accessed 8 May 2014)
- Selbie DR, Cameron KC, Di HJ, Moir JL, Lanigan GJ, Richards KG in press. The effect of urinary nitrogen loading rate and a nitrification inhibito on nitrous oxide emissions from a temperate grassland soil. Journal of Agricultural Science. doi:10.1017/S0021859614000136
- Šimek M, Jíšová L, Hopkins DW 2002. What is the so-called optimum pH for denitrification in soil. Soil Biology and Biochemistry 34: 1227–1234. 10.1016/S0038-0717(02)00059-7
- Velthof GL, Oenema O, Postma R, Van Beusichem ML 1997. Effects of type and amount of applied nitrogen fertilizer on nitrous oxide fluxes from intensively managed grassland. Nutrient Cycling in Agroecosystems 46: 257–267. 10.1007/BF00420561
- Whitehead DC, Lockyer DR, Raistrick N 1989. Volatilization of ammonia from urea applied to soil: influence of hippuric acid and other constituents of livestock urine. Soil Biology and Biochemistry 21: 803–808. 10.1016/0038-0717(89)90174-0