
Abstract
Soils were sampled at intervals to 0.8 m depth on an irrigated dairy farm in the Canterbury region of New Zealand and a nearby (control) area with unimproved grasses which was not known to have been irrigated, fertilised or grazed by farmed animals. Eleven years earlier, the dairy farm had been converted from an unirrigated sheep farm. For each depth interval, we measured the bulk density and organic carbon (C) concentration. By volumetric calculations to depth 0.3 m, the irrigated site's mean soil C stock was 28% greater than the control (10.0 ± 0.3 kg C m−2 [±standard error] vs 7.8 ± 0.6 kg C m−2), a statistically significant difference (P < 0.05). In contrast, by volumetric calculations to depth 0.8 m and on an equivalent soil mass basis, the corresponding differences were not statistically significant (13.0 ± 0.4 vs 12.9 ± 0.2 kg C m−2 and 11.6 ± 0.4 vs 12.9 ± 0.2 kg C m−2, respectively). Although C stock change was inferred by sampling soils on irrigated and control sites, these results suggested changes can depend on the sampling depth and calculation basis.
Keywords:
Introduction
The organic carbon (C) in soils has come from the atmosphere by plant photosynthesis. Simultaneously, C can also be lost from soils by respiration and leaching. Thus, a soil's C stock represents the cumulative net balance of C inputs and losses. For pastoral agriculture soils, this balance can be affected by management, weather and soil properties. For example, without rainfall, soil water deficit can restrict plant growth and the activity of soil organisms reducing the flow of C into and out of the soil (Kelliher et al. Citation2012). By irrigating such soils, farmers aim to enhance herbage production and feed availability for grazing animals and by doing so, they may also change C flows into and out of soils. For the Canterbury and Otago regions of New Zealand, irrigation during summer increased perennial ryegrass (Lolium perenne) pasture herbage production by c. twofold over the level of unirrigated control areas (Martin et al. Citation2006; Houlbrooke et al. Citation2011; Kelliher et al. Citation2012). By increasing uptake of atmospheric C to growing plants, irrigation should increase the C input rate to pastoral soils. However, by sampling soils in the Otago region beneath pasture grazed by sheep, half watered by rainfall and the others by rainfall and irrigation over periods of up to 49 years, there was no treatment effect on the soil's C stock to a depth of 0.15 m (Houlbrooke et al. Citation2008). At Winchmore in Canterbury, by sampling soils beneath pasture grazed by sheep, half watered by rainfall and the others by rainfall and irrigation for 60 years, the mean soil C stock to a depth of 1 m was 32% lower in the irrigated plots (Kelliher et al. Citation2012). Moreover, at Winchmore, half the irrigation treatment effect occurred in samples collected deeper than 0.25 m. Alternatively, by analysing a different set of soil samples from the same plots at Winchmore, Schipper et al. (Citation2013) determined that the mean soil C concentration to a depth of 0.075 m was 48% lower in the plots irrigated when water content in the uppermost 0.1 m depth reached 20%. However, for nearby plots irrigated when water content in the uppermost 0.1 m depth reached 10%, Schipper et al. (Citation2013) found irrigation had not significantly affected the soil C concentration relative to the control (P > 0.05). In summary, New Zealand's published literature about irrigation effects on pastoral soil C stock is sparse and equivocal, suggesting further research is warranted.
For 11 years near Lincoln, Canterbury region, New Zealand (43.6°S, 172.4°E, 11 masl), deep sandy soil under continuous pasture grazing by dairy cattle has received rainfall as well as irrigation during summer to limit the water deficit, and fertiliser has been applied to optimise pasture production. Previously, the farm had been unirrigated, minimally fertilised and grazed by sheep at a lower stocking rate. For this study, we postulated that the farm's conversion to dairying and more intensive management would affect the soil's C stock. Measuring the C stock provides a baseline from which change can be assessed over time. Alternatively, C stock change can be inferred by sampling soils on adjacent treated and control sites, and measuring C concentration and bulk density. A sampling depth of 0.3 m has been recommended by the Intergovernmental Panel on Climate Change to determine the C stock of agricultural soils (IPCC Citation2006). This depth has been chosen as being beyond the cultivation layer by full inversion tillage and mould-board ploughing. This is relevant to this study because the farm conversion at Lincoln included tillage to a depth of 0.2 m. Here, to test our hypothesis, we present and analyse the results of measurements on sets of soil samples collected at this irrigated site and a nearby control site.
Materials and methods
The soil samples were collected between 17 March and 3 April 2012 at the Lincoln University Dairy Farm. The terrain was flat and the soil samples came from a wedge-shaped paddock (N9) at 30 m intervals along each of three 180 m long transects (i.e. 18 holes were dug for soil sampling) (). The outermost transects were parallel to fences and 20 m from them. The third transect bisected the space between the outer transects. Mean annual values of rainfall and irrigation during summer were c. 670 mm and c. 450 mm, respectively. One end of each transect was located c. 150 m from the centre of the farm's circular grazing area, the irrigator boom's pivot point. Sampling locations also avoided stock congregation areas such as gates, water troughs and fences. About 400 m away, the control site was a c. 10 m wide strip located between Weedon's Road and a gravel pit. The soil samples were collected at 30 m intervals along one 180 m long transect (i.e. six holes were dug for soil sampling at this site). The control site's unimproved grasses are not known to have been irrigated, fertilised or grazed by farmed animals. By inspection, the control site's soil did not appear to have been disturbed by road construction or gravel extraction. At both sites, soils were deep sandy Templeton series, classified as a Typic Immature Pallic according to the New Zealand system (Hewitt Citation2010).
Table 1 Geographic position system (GPS) coordinates for soil sampling locations at the irrigated and control sites.
From soils at each hole, bulk density samples were taken with a steel corer (0.05 m long and 0.07 m inside diameter). The sampling depth intervals were 0–0.05, 0.05–0.10, 0.10–0.15, 0.15–0.20, 0.2–0.3, 0.3–0.4, 0.4–0.6 and 0.6–0.8 m. Although stones prevented soil sampling from the deepest interval in the first two holes dug at the control site, no stones were found in the remaining four holes and no stones were found when digging the holes across the irrigated paddock. In the uppermost 0.2 m, the steel sampling corer was inserted vertically. For the intervals deeper than 0.2 m, the corer was inserted horizontally at the midpoint of the depth intervals and the C concentration sample taken by scraping a soil sample from the length of the interval. Each sample was dried at 105 ° C for 24 h, weighed and passed through a 2 mm sieve. After the removal of roots, a 0.5 g subsample was subjected to C concentration measurement by a combustion method (Elementar Vario-Max CN Elemental Analyser, Hanau, Germany).
The sand content was measured for samples from both sites across the depth intervals 0.2–0.3, 0.3–0.4, 0.4–0.6 and 0.6–0.8 m. This involved adding a small quantity of water to a 20 g soil subsample in a beaker, and heating the contents to 70 ° C. For 1 h, up to 5 mL of hydrogen peroxide was added until the organic matter was gone as indicated by the cessation of ‘frothing’. Afterwards, the mass fraction of the soil that did not pass through a 53 µm sieve was measured and expressed as a percentage of the original sample mass to calculate the percentage of sand.
The statistical significance of differences in soil property mean values between the irrigated (treated) and control sites were determined using Minitab (version 16, PA, USA). Generally, a two-sample t-test assumed unequal variance and the probability (P) level for statistical significance was 0.05 (P < 0.05). For each sample, a standard error of the mean (SE) was calculated to express the precision of estimation of the population mean.
To determine a relationship between C concentration and depth (z), called a vertical distribution (C(z)), a continuous function was needed. Following (natural) logarithmic transformation of the dependent variable, linear regression was performed and fit to the C concentration and z data set assessed by plotting the residuals (errors). Logarithmic transformation was required to meet the assumption of normally distributed errors, a requirement of regression analysis, checked by normal quantile-quantile plots of the residuals.
Results and discussion
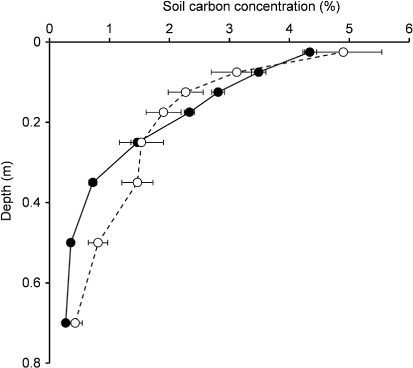
The relationship between C concentration and depth was curvilinear (). In the uppermost 0.05 m of soil, the C concentration averaged 4.2 ± 0.1% at the irrigated site and 4.9 ± 0.1% at the control site, reducing to 0.3 ± 0.02% by 0.6–0.8 m at the irrigated site and 0.4 ± 0.1% at the control site. The only statistically significant differences in C concentration and sand content (P < 0.05) were for 0.3–0.4 m and 0.4–0.6 m with the control site's C concentration means c. twofold greater and the sand content means c. 50% less.
Regression of the C concentration data with depth yielded statistically significant relationships which accounted for 96% of the variability. For the irrigated site's data, following Kelliher et al. (Citation2012), the relationship may be written as:
By volumetric calculations, the soil C stock is a product of the C concentration, bulk density and depth interval. Deeper than 20 cm, by collecting bulk density samples from the middle of the intervals, spatial variability would be problematic. At the irrigated and control sites, mean bulk densities were virtually identical for the 0.3–0.4, 0.4–0.6 and 0.6–0.8 m intervals and within 9% of values for the 0.2–0.3 m interval (data not shown). Moreover, across the sampled transects at both sites for these depth intervals, SE were <5% of the mean.
The most common reason for sampling pastoral soils in New Zealand is fertility assessment and, generally, the sampling depth will be 0.075 m. As stated, for this study, this sampling depth was not included but by volumetric calculations to depth 0.05 m, the irrigated site's mean soil C stock was 35% greater than the control (2.3 vs 1.7 kg C m−2, ), a statistically significant difference. However, to this depth, the control site's mean bulk density (soil mass per unit area) was only 68% of that at the irrigated site. Multiplying the irrigated site's volumetrically calculated soil C stock by 68% yields 1.6 kg C m−2, the irrigated site's mean soil C stock expressed on a soil mass basis equivalent to that of the control site. On this equivalent mass basis, the irrigated site's mean soil C stock was not significantly greater than that of the control. The same was true when volumetric calculations of the irrigated site's mean soil C stock were redone on the bases of cumulative soil mass at the control site to depths of 0.1, 0.15, 0.3, 0.4, 0.6 and 0.8 m. While recalculation on the basis of the control site's cumulative soil mass to a depth 0.2 m meant the irrigated site's C stock was reduced by 16%, this difference of 1 kg C m−2 between the sites was statistically significant.
Table 2 Mean cumulative soil carbon (C) stock (±SE) for increasing depths at the irrigated and control sites according to volumetric and equivalent soil mass calculations. Also shown are the corresponding cumulative soil masses.
Measuring C stock provides a baseline from which change can be assessed over time. Just prior to the farm's conversion in 2001, five soil samples were taken in paddock N9 to depth 0.075 m at 20 m intervals along a 100 m long transect, combined, and the measured C concentration was 2.69%. Measurements on additional samples indicated the corresponding bulk density was 1100 kg m−3. A second set of samples was taken in paddock N9 in 2011, and showed that the C concentration had increased to 4.25% while the bulk density had not changed. For this study, the samples taken in 2012 from paddock N9 to depth 0.05 m had a very similar mean C concentration and bulk density to those taken the previous year, 4.34 ± 0.12% and 1070 ± 16 kg m−3, respectively. Combining results from the samples taken in 2001 and 2011 to depth 0.075 m, it can be calculated that the soil's C stock had increased by 58% over 10 years or by 0.13 kg C m−2 year−1 on average (= 1.3 t C ha−1 year−1). This percentage is substantially greater than 35%, the difference in volumetric soil C stock to depth 0.05 m between the irrigated and control sites. Moreover, as stated, the difference was not statistically significant when recalculated on an equivalent soil mass basis. In 1996, before the farm's conversion, measurements on soil samples collected in a paddock different to N9 to depth 0.8 m indicated the C stock was 10 kg C m−2 (Silva et al. Citation2005). In 1996, the mean bulk density to depth 0.8 m was not substantially different from that in 2012 from this study. Thus, by comparison on volumetric and equivalent soil mass bases, the irrigated site's C stock to depth 0.8 m which was 13 kg C m−2 in 2012 had increased by 30% since 1996 or by 0.19 kg C m−2 year−1 on average (= 1.9 t C ha−1 year−1). This comparison needs to be treated with caution because different paddocks were sampled. If we combine this comparison to a depth of 0.8 m with the one to a depth of 0.075 m, we approximate that below a depth of 0.075 m the irrigated site's C stock increased by 0.06 kg C m−2 year−1 on average (= 0.6 t C ha−1 year−1). Although uncertain, these rates of change in C stock at the irrigated site appear to be greater than zero, in contrast with the comparison between the irrigated and control sites indicating no difference in soil C stock to depth 0.8 m.
In conclusion, to estimate C stocks, soils should be sampled deeply across depth intervals reflecting the vertical distributions of soil mass per unit area and C concentration. By measuring the C stock and establishing a baseline, change can be determined over time. Although C stock change can be inferred by sampling soils on irrigated and control sites, the results of this dairy farm conversion study have suggested soil C stock change can depend on the sampling depth, calculation basis, the period between sampling campaigns and suitable control sites.
Acknowledgements
We thank Chikako van Koten for valuable discussions and Mike Dodd, Dave Houlbrooke and anonymous reviewers for constructive critiques. Francis Kelliher and Peter West were funded by the New Zealand Greenhouse Gas Research Centre.
References
- Hewitt AE 2010. New Zealand soil classification. Landcare Research Science Series No. 1. 3rd edition. Lincoln, Manaaki Whenua Press. 136 p.
- Houlbrooke DJ, Littlejohn RP, Morton JD, Patton RJ 2008. Effect of irrigation and grazing animals on soil quality measurement in the North Otago rolling downlands region of New Zealand. Soil Use and Management 24: 416–423. 10.1111/j.1475-2743.2008.00183.x
- Houlbrooke DJ, Paton RJ, Littlejohn RP, Morton JD 2011. Land-use intensification in New Zealand: effects on soil properties and pasture production. Journal of Agricultural Science 149: 337–349. 10.1017/S0021859610000821
- Intergovernmental Panel on Climate Change (IPCC) 2006. Guidelines for national greenhouse gas inventories. Volume 4: Agriculture, forestry and other land uses, Chapter 2: Generic methodologies applicable to multiple land-use categories. http://www.ipcc-nggip.iges.or.jp/public/2006gl/pdf/4_Volume4/V4_02_Ch2_Generic.pdf (accessed 24 March 2014).
- Kelliher FM, Condron LM, Cook FJ, Black A 2012. Sixty years of seasonal irrigation affects carbon storage in soils beneath pasture grazed by sheep. Agriculture, Ecosystems and Environment 148: 29–36. 10.1016/j.agee.2011.10.022
- Martin RJ, Thomas SM, Stevens DR, Zyskowski RF, Moot DJ, Fraser TJ 2006. Improving water use efficiency on irrigated dairy farms in Canterbury. Proceedings of the New Zealand Grassland Association 68: 155–160.
- Schipper LA, Dodd MB, Pronger J, Mudge PL, Upsdell M, Moss R 2013. Decadel changes in soil carbon and nitrogen under a range of irrigation and phosphorus fertilizer treatments. Soil Science Society of America Journal 77: 246–256. 10.2136/sssaj2012.0126
- Silva RG, Cameron KC, Di HJ, Jorgensen EE 2005. A lysimeter study to investigate the effect of dairy effluent and urea on cattle urine N losses, plant uptake and soil retention. Water Air and Soil Pollution 164: 57–78. 10.1007/s11270-005-2249-7