
Abstract
The nitrification inhibitor dicyandiamide (DCD) has been reported to significantly reduce nitrate () leaching and nitrous oxide (N2O) emissions under urine patches in New Zealand trial conditions. However, results on the efficacy of DCD for increasing pasture production have been inconclusive. As part of a national series of nitrous oxide mitigation research (NOMR) trials, a 3-year study was conducted at a dairy farm in South Otago to examine the effect of DCD on pasture production and N leaching under mowing and/or (simulated) grazing conditions and on N2O losses from dung and urine patches. Over the three trial years, DCD significantly inhibited nitrification in urine-amended soil, reducing peak
concentrations in the soil by >50% and the N2O emission factor from urine by 33%–72%. Nitrate concentrations in drainage under simulated grazing plots with or without DCD applications were low and consequently no effect of DCD was detected. The N2O emissions and N leaching results suggested that high rates of denitrification occurred in the imperfectly draining soil, particularly in years 2 and 3 of the study. DCD significantly increased spring pasture dry matter (DM) yields from urine patches by 9%–21% in all years under mowing, but no significant annual effect on DM response was detected under either mowing or grazing. The observed increases in DM response in the urine patches under mowing were not detectable under the variable pasture responses under true grazing conditions.
Disclaimer
DCD has been withdrawn from use on farms in New Zealand and its use is now restricted to research undertaken on small plot trials or lysimeters. Protocols to ensure that DCD does not enter the food chain are supported by soil and plant testing for DCD residues.
Introduction
The pastoral dairy industry is New Zealand's largest agricultural export earner (Statistics NZ Citation2012) and its ongoing intensification and expansion is raising concerns about the environmental impacts and nitrogen (N) losses to water and air. In New Zealand's pastoral systems, urine deposited by grazing animals has been identified as the largest contributor to environmental N losses from dairy farms (Ledgard Citation2001). A single dairy cow urination can deposit a large amount of N equating to localised deposition of about 700–1000 kg N ha−1 directly on to pasture (Haynes & Williams Citation1993). Much of this urine-N is quickly hydrolysed to ammonium () and transformed to nitrate (
) by soil bacteria known as nitrifiers. The amount of
within the urine patch is well in excess of plant uptake and therefore prone to loss from the soil system via
leaching, ammonia (NH3) volatilisation, and dinitrogen (N2) or nitrous oxide (N2O) emissions. In New Zealand,
leaching and N2O emissions are the loss pathways that are of greatest concern (e.g. Ledgard Citation2001; Di & Cameron Citation2002). The potential for
pollution to occur increases as the dairy industry expands and intensifies and animal numbers increase; therefore the fate of the excess
produced in urine patches is subject to major research and regulatory scrutiny in New Zealand (e.g. Ledgard et al. Citation2009; de Klein & Monaghan Citation2011).
In recent years, the nitrification inhibitor dicyandiamide (DCD) has received much attention as a technology to reduce soil concentrations in urine patches deposited on to pasture in New Zealand (e.g. Di & Cameron Citation2002; Smith et al. Citation2008; Monaghan et al. Citation2009; de Klein et al. Citation2011). DCD temporarily inhibits the first step of the nitrification process (Di et al. Citation2010), thereby inhibiting the production of
and thus reducing the risk of subsequent N losses. New Zealand research has shown that DCD can reduce N losses via
leaching by 16%–83% (studies summarised in Cameron et al. Citation2014) and N2O emissions by 0%–86% (studies summarised in de Klein et al. Citation2011). The retention of N in the
form in soil prolongs the availability of N for pasture plant uptake and could thus potentially increase pasture production. In addition, an increase in pasture production is an economic incentive to use DCD as a farm management tool. The results to date on the effect of DCD on pasture production are varied, with >20% production increases reported in a trial by Moir et al. (Citation2007) and nil effects in others (Monaghan et al. Citation2009; MacDonald et al. Citation2010). Following application to pasture, DCD is gradually degraded or leached from soil, and its persistence in soil is influenced by factors such as temperature, moisture, organic matter and pH (Amberger Citation1989; Kelliher et al. Citation2008; Menneer et al. Citation2008; Kim et al. Citation2012). The efficacy of DCD to reduce N losses may therefore vary according to local soil and climate factors; the timing of application in relation to these factors may have a large influence on the subsequent performance of DCD as an effective farm management tool.
To measure the efficacy of DCD for reducing N losses and increasing pasture production in dairy systems under a range of environmental conditions, a coordinated series of nitrous oxide mitigation research (NOMR) trials was conducted over 3 years, in the four key dairying regions in New Zealand. The results of trials in Waikato, Manawatu and Canterbury are presented in associated papers (Ledgard et al. Citation2014; Kim et al. Citation2014 and Cameron et al. Citation2014, respectively). This paper reports the results from the NOMR trial in South Otago.
The main objectives of the trial were to measure the effect of DCD applications to a South Otago poorly drained soil on:
N2O emissions from real cattle urine patches (gas chamber trial, 2009–11).
leaching from simulated grazing plots (drainage trial, 2010–11).
Pasture DM response, soil mineral N and soil DCD decay rates from synthetic cow urine applied to small plots (mowing trial, 2009–11).
Pasture dry matter response under grazing conditions (grazing trial, 2009–11).
Materials and methods
Site description and climate data
The South Otago NOMR trial was conducted at the Telford Polytechnic Dairy Farm, from April 2009 to March 2012 (Gillingham et al. Citation2012). The trial site was located on Tokomairiro deep silt loam (Fragic Perch-gley Pallic soil, NZ Soil Classification, or Fragiochrept, USDA Soil Taxonomy [Hewitt Citation1998]), an imperfectly drained soil with moderate fertility and high water availability. The trial paddock (total area 2.17 ha) was cultivated and sown to a perennial ryegrass/white clover pasture in February 2009. General soil fertility and soil physical parameters of the trial paddock in each year are presented in and . Soil physical parameters were measured as described by Drewry et al. (Citation1999). Rainfall and soil temperature (10 cm depth) data were obtained from an NIWA meteorological site located about 2 km from the trial site.
Table 1 Mean soil fertility measurements (0–7.5 cm depth) at the Telford NOMR 2009–11 trial site; n = 6.
Table 2 Mean soil physical measurements (0–5 cm depth) at the Telford NOMR 2009–11 trial site; samples taken within the mowing trial areas in trial years 1, 2 and 3; n = 6.
The NOMR trial consisted of four component studies: an N2O gas chamber trial, a drainage trial, a mowing trial and a grazing trial. All components examined the effect of DCD on various aspects of N cycling in a paddock within an operating farm system. The treatments, measurements and methods for each trial are described in sections below and the treatment rates and dates are summarised in .
Table 3 Overview of experimental treatments and measurements at the Telford NOMR 2009–11 trial site. In square brackets are the N application rates (kg N ha−1) and dates. DCD was applied at 10 kg DCD ha−1 in all trials.
Gas chamber trial to measure DCD effect on N2O emissions
Nitrous oxide measurements were made using a standardised chamber methodology (de Klein et al. Citation2003) in a small trial area that was fenced off at least 4 weeks prior to treatment application. A different area was used in each trial year. Within this area, stainless steel rings (0.25 m diameter in year 1 and 0.5 m diameter in years 2 and 3) that were fitted with a 2 cm tall, U-shaped ‘water trough’ flange were inserted 10 cm into the soil and left to ‘settle’ for at least 1 week. Urine and/or dung and DCD treatments were then applied to the rings in a randomised block design (n = 6) ().
Fresh urine or dung was collected from a local dairy farm 1–2 days prior to application, chilled at 4 °C and the total N concentration analysed. The urine was evenly applied within the stainless steel rings at a rate of 10 L m−2 (equivalent to 700 kg N ha−1), while 0.9 kg fresh cow dung was applied to a 20 cm diameter circle within the rings. DCD was dissolved in water (100 g DCD 8 L−1) and sprayed on to the plots after the urine or dung applications at a rate equivalent to 10 kg DCD ha−1. An equivalent amount of water was sprayed on to the control plots.
Gas sampling started on the day of treatment application in autumn (April or May) and continued twice weekly for 6 weeks, thereafter weekly for another 6 weeks and then fortnightly. Extra sampling was conducted after significant rainfall events (>10 mm) throughout the entire measurement period. Measurements continued for 7–8 months until the N2O emissions from all treatments had receded to background levels.
At each sampling occasion, the water trough flanges were carefully filled with water (to avoid spillage within the chamber internal area) and a chamber cover with two open ports was placed into the trough. After placement of the cover, the ports were closed with Suba-Seals to provide an airtight cover. Headspace samples were taken at 0, 20 and 40 min (t0, t20 and t40) for the first 6 weeks after treatment application. For the remainder of each trial, headspace samples were taken at t0 and t30.
Nitrate leaching trial to determine DCD effect on loss in drainage
The leaching trial consisted of 20 plots (2 × 10 m) which were each hydrologically isolated by burying plastic polythene sheeting vertically into the ground to 1 m depth around the three up-slope boundaries of each plot. In the centre of each plot, a narrow trench was dug to 70 cm depth along the 10 m length of each plot, using a chain-trencher. A slotted drainage pipe was placed at the bottom of this trench, which was then backfilled with c. 40 cm of pea gravel and c. 30 cm of topsoil. The drainage pipes were positioned on a clay pan to capture subsurface drainage water from within each plot, with minimal loss below the pan. At the down-slope boundary of each plot, the drainage water collected through the slotted pipe exited the plots and was captured using tipping buckets and a siphon device as described by Monaghan et al. (Citation2009). Subsamples were frozen and later analysed for and
concentrations by flow injection analysis.
Stock was excluded from the trial area, but each plot received two simulated urine patches by applying real cow urine with watering cans within two 50 cm diameter rings (i.e. 2% of each plot area received urine at any one time). The urine was applied at the same rate as for the gas chamber trial (i.e. 10 L m−2, at a rate of 700 kg N ha−1 for each patch). The timing of the urine application coincided with the grazing rotation in the grazing trial plots (see below). Prior to urine application, all drainage plots were harvested using a push mower (within ±1 week of the grazing event) down to a residual of c. 1400 kg DM ha−1. Plots were paired to give 10 blocks of two plots with two treatments randomly applied within blocks; control (no DCD) or +3DCD.
DCD was applied three times throughout the season, directly following the urine applications in early autumn, late autumn and early spring, at 10 kg DCD ha−1 per application to the appropriate plots using a high-pressure handheld sprayer ().
Fortnightly soil sampling (0–10 and 10–20 cm depth) occurred in the 10 +3DCD plots until soil DCD concentrations were below detection limit (0.003 ppm) for at least 1 month. Soil DCD content was determined as for the mowing trial (see below).
Mowing trial to determine the DCD effect on DM production, soil mineral N and soil DCD
A mowing trial was established in autumn each year. For each trial year, a different area of the paddock was fenced off and used to measure annual pasture production, and soil ,
and DCD concentrations for 5–8 months, until all treatments had receded to background levels. The trial consisted of 51 plots (1.25 × 2 m2) in year 1 and 136 plots (0.5 × 5 m2) in years 2 and 3. The plots were arranged into 17 blocks with three (year 1) or eight (years 2 and 3) randomly applied treatments in each block with a buffer strip (approx. 0.5 m width) between each plot. Synthetic urine (700 kg N ha−1 equivalent, urine composition according to de Klein et al. Citation2003) was applied to plots using watering cans. Fertiliser N (urea) was applied by hand to plots; fertiliser N application rates were determined according to Telford farm practice, which varied slightly between trial years. On the same day or the day following urine or urea application, DCD was applied (10 kg DCD ha−1 equivalent) to appropriate plots using a high-pressure hand sprayer. Re-applications of DCD (10 kg DCD ha−1 equivalent) were specific to each trial year. In the first year, DCD applications were applied during the autumn/winter period only. In following years, treatments were expanded to include DCD applications during the autumn, winter and spring periods (). In year 2, a treatment was included to assess the effect of DCD on pasture responses at the outer edges of the urine-treated area (urine-edge effect). The urine-edge effect plots were located directly adjacent to the urine plots (i.e. without a buffer strip between the plots) and DM production determined as per the protocol described below.
Pasture DM production was determined at regular intervals by mowing one or two strips in each plot. In the urine-edge effect plots, these strips were located at the boundary line with the urine-treated plots. The collected herbage was weighed and a subsample dried to determine percentage DM. In year 1, the mowing dates were based on the grazing rotations of the grazing trial and, as a result, pasture covers were very high at the time of mowing during spring and early summer. In subsequent years, the plots were therefore harvested as pasture covers reached (or as close as practical to) a target cover of 2800 kg DM ha−1.
Soil samples (0–10 and 10–20 cm depths) were taken from six randomly selected blocks of selected treatments (see ). Sampling occurred at regular intervals and lasted for 7–10 months until average soil DCD and soil mineral N reached background levels (i.e. not significantly different from control plots, P > 0.05). Samples were extracted in the laboratory using 2M potassium chloride (KCl) and sent to Ruakura (Hamilton, AgResearch Ltd) for soil and
analyses by flow injection analysis. Separate subsamples were extracted with distilled water and analysed for DCD by high performance liquid chromatography (HPLC, Shimadzu HIC-6A) with adjustment for incomplete recovery as described by Welten et al. (Citation2012).
Grazing trial to determine DCD effect on pasture production
The grazing trial was established to measure pasture production in response to DCD application under grazing conditions. The trial was conducted in the same area of the paddock for all years and, in years 1 and 2, consisted of 70 plots (100 m2 per plot) with two treatments (control and +DCD; n = 35). DCD was applied twice per year (2 × 10 kg DCD ha−1), once in autumn and once in spring (). The treatments were randomly applied within blocks. In year 3, all plots were divided into two, to establish 140 plots (50 m2 per plot) and enable an additional two treatments to be included: DCD applied five times per year and DCD applied twice in spring (). For each DCD application, dissolved DCD (10 kg DCD in 800 L) was applied at 10 kg DCD ha−1 using high-pressure knapsack sprayers. The area was grazed as closely as possible to the farm rotation practice (i.e. grazed at a target herbage mass of c. 2800 kg DM ha−1 down to a residual target of c. 1450 kg DM ha−1).
To determine pasture yield (kg DM ha−1), pasture cover was measured at pre- and post-grazing for each grazing event using a Farmworks rising plate meter (Farmworks Citation2008), by taking c. 80 readings per plot. Pasture cover (kg DM ha−1) was estimated from the plate meter ‘clicks’ using the standard DairyNZ all season's equation (Farmworks Citation2008).
Results
Climate data
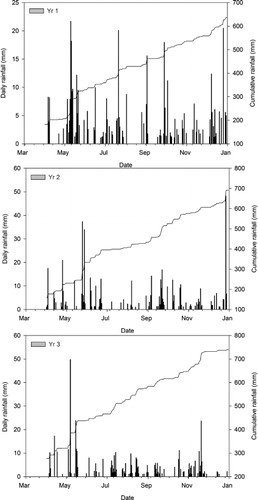
The cumulative rainfall total in years 1 and 2 were similar to the long-term average of 730 mm (NIWA Meteorological Site No. 692706). In year 3, total rainfall marginally exceeded this long-term average (). In year 1 there was a substantial amount of rain prior to and immediately following the cultivation of the paddock and subsequent trial establishment (May 2009). This frequent rainfall pattern continued for much of the duration of the trial, particularly in the initial 12 weeks in year 1. In year 3 there was approximately 100 mm more rainfall prior to the start of the trial in autumn compared with previous trial years.
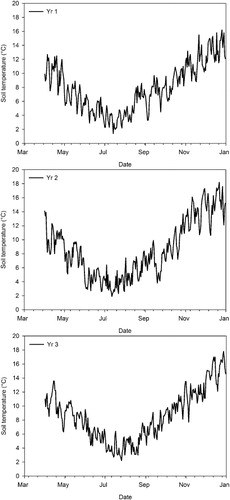
Soil temperatures at 10 cm depth were typically lowest during July and August each year (3-year average 4.6 °C) and highest during December (3-year average 14.6 °C). It should be noted that January and February recorded the highest average soil temperatures in all trial years (3-year average 14.9 °C), however most gas and soil sampling had ceased by this time (). Due to the earlier start date in trial year 3 (April, rather than May as in trial years 1 and 2), the average soil temperature was higher at the start of trial year 3 (6.6, 7.7 and 10.1 °C in years 1, 2 and 3, respectively).
Soil , and DCD concentrations
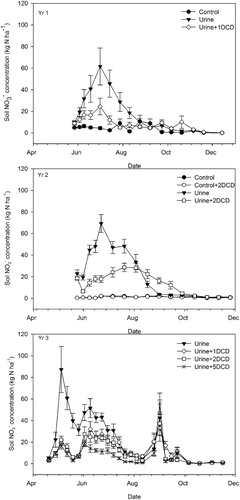
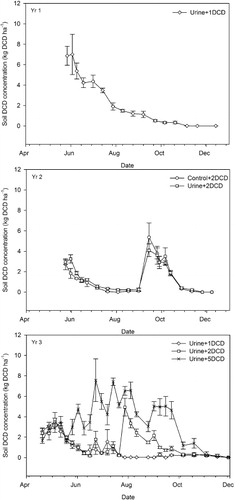
The application of DCD inhibited nitrification in soil, thus reducing soil concentrations (0–20 cm depth) in urine patches for 8–16 weeks in all years compared with urine-only treatments (). In the urine-only treatment, soil
concentrations peaked 3–5 weeks following treatment application (61.6, 69.3 and 87.3 kg NO3-N ha−1 in years 1, 2 and 3, respectively). DCD application reduced these peaks by >50% (24.4, 28.6 and 32.1, 27.4, 18.4 kg NO3-N ha−1 in years 1, 2 and 3, with the latter reporting values for one, two and five DCD applications, respectively). Soil
concentrations also took longer to decline to background levels by a few weeks in the DCD treatments (). An
spike in September for all treatments in year 3 cannot be readily explained.
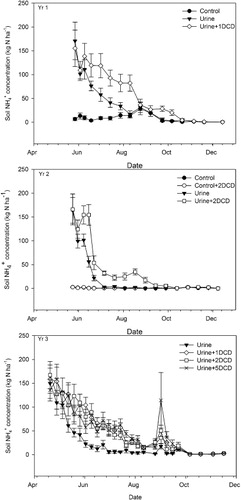
The application of urine substantially increased concentrations for 8–12 weeks. When DCD was applied, soil
concentrations were higher than in the urine-only treatment and persisted for longer; from about 3 up to 12 weeks following application (). Increasing the number of DCD applications from one to five in year 3 resulted in little difference in soil
concentrations.
Soil DCD concentrations (0–10 cm depth) in the mowing trial ranged from 3–7 kg DCD ha−1 immediately after application and reduced to non-detectable levels after 8–12 weeks. The applied DCD was never fully recovered in any of the trial years (). The highest DCD concentrations were measured in the first 2 weeks post-application in year 1 and following the third application in the +5DCD treatment in year 3 (7–8 kg DCD ha−1 at 0–10 cm depth, ). Apart from these two occasions, soil DCD concentrations rarely exceeded 5 kg DCD ha−1 during any of the trial years. DCD concentrations in the 10–20 cm soil layer rarely exceeded 2 kg DCD ha−1 across all years and treatments.
Nitrous oxide emissions
The application of DCD to urine patches was consistently effective at reducing peak daily N2O emissions by 14%, 70% and 42% or 50% in years 1, 2 and 3 (two or five DCD applications, respectively, in year 3, ). In all years, daily N2O emissions peaked within the first 8 weeks after treatment application and returned to background levels within 3–4 months. In year 2, a second N2O emission ‘envelope’ occurred approximately 12 weeks after urine application, which made a large contribution to the emissions total that year. In year 3, the peak N2O emissions were at least threefold higher than in the previous years.
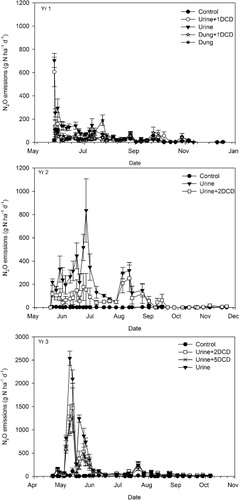
Total N2O losses from urine patches varied between years (10, 23 and 41 kg N ha−1 in years 1, 2 and 3, respectively) and were significantly higher in year 3 compared with other years (P < 0.01). In year 1, the N2O emission factors (expressed as N2O-N emitted as a percentage of N applied) from autumn-applied urine patches were significantly reduced (P < 0.01) by 72% following a DCD application in autumn (). In years 2 and 3, the N2O emission factors from autumn-applied urine patches were significantly reduced by 54% (P < 0.01) and 33% (P < 0.05), respectively, following two DCD applications, one in autumn and one in winter. Increasing the number of DCD applications from two to five in year 3 resulted in a further reduction in N2O emissions, with DCD reducing the emission factor by 50% (P < 0.001).
Table 4 N2O emissions and the N2O emission factor for the N2O trial treatments at the Telford NOMR trial site for trial years 1 (2009–10), 2 (2010–11) and 3 (2011–12). Numbers in parenthesis are SEM; n = 6.
In year 1, total N2O emissions from dung treatments were low and similar to control treatments (5.8 and 4.1 kg N ha−1 for dung and control treatments, respectively) and applying DCD did not significantly reduce those total emissions ().
Nitrate losses in drainage
Cumulative leaching losses in trial years 2 and 3 from the drainage trial site ranged from 9–16 kg N ha−1 across treatments and trial years (). The application of DCD reduced the
load in drainage by 8% and 11% in years 2 and 3, respectively, but these reductions were not statistically significant. There were no noticeable effects of DCD application on
concentrations at individual drainage events, except on one occasion in year 2 of the trial, where the
concentration of the DCD plots was significantly lower than that of the control plots (data not shown).
Table 5 Total annual pasture yield (t DM ha−1) and nitrate leachate load in drainage (kg NO3-N ha−1) from the Telford NOMR leaching trial, years 2 (2010–11) and 3 (2011–12). Numbers in parenthesis are the SEM; n = 10.
Pasture dry matter response
In the mowing trial, DCD significantly increased spring pasture dry matter (DM) in the urine-treated plots (). In year 1, spring and annual DM from the urine+DCD plots were 9% and 5% higher (P < 0.05), respectively, than from the urine-only plots. In year 2, spring and annual DM responses of the urine plots were increased by 12% and 5% (P < 0.05), respectively, due to DCD applications. In the urine-edge effect plots, DCD also significantly increased spring pasture DM (by 9%, P < 0.05), but not the annual DM production. In year 3, DCD applications increased spring and annual DM in the urine plots by 13%–21% (P < 0.05) and by 6%–11%, respectively, depending on the DCD treatment (one, two, three or five applications; P < 0.05 for three and five DCD applications only). In general, the DM responses increased with the number of DCD applications (). There were no significant pasture responses during summer. In the urea-treated plots, DCD application did not significantly affect DM response, with the urea and urea+DCD plots yielding the same amount in both year 2 and 3 (). Similarly, in year 2, DCD application did not increase DM yield of the control treatment.
Table 6 Total and seasonal pasture yield (t DM ha−1) from the Telford NOMR small plot mowing trial, years 1 (2009–10), 2 (2010–11) and 3 (2011–12). Numbers in parenthesis are the SEM; n = 17.
In the grazed plots, DCD application did not significantly increase pasture yields on an individual, seasonal or annual basis (). The total pasture yields were difficult to compare between years due to the variation in the measurement periods and subsequent grazing rotations (); however, there is a consistent lack of DCD treatment effect across all years.
Table 7 Annual and seasonal pasture yield (t DM ha−1) from the Telford NOMR Grazing trial, years 1 (2009–10), 2 (2010–11) and 3 (2011–12). Numbers in parenthesis are the SEM; n = 35.
Discussion
Soil , and DCD concentrations
The application of DCD significantly inhibited soil nitrification rates across all treatments in all years, as evidenced from the soil mineral N measurements. In general, concentrations in the DCD treatments were maintained at higher levels for 4–7 weeks longer than in the no-DCD treatments. This coincided with a >50% reduction in
peak concentration following urine+DCD application over the same period. However, thereafter, soil
levels in the DCD plots were elevated above control levels for up to 4 weeks longer than in the urine-only plots, which indicated that DCD effectiveness slowly decreased over time. These observations are consistent with previous findings (e.g. Smith et al. Citation2008; Di & Cameron Citation2012; Monaghan et al. Citation2013) and with the soil DCD measurements in our trial. Soil DCD concentrations declined to zero within 8–12 weeks after application, except in year 1 where DCD persisted at detectable concentrations for up to 18 weeks. The cooler soil temperatures in year 1 () probably resulted in a slower degradation of DCD (Kelliher et al. Citation2008) compared with the other years. Immediately following application, DCD recovery in soil samples was not always achieved. The interception of DCD through adhesion to grass surfaces has been suggested as a cause for the low recovery rate (Gillingham et al. Citation2012). This is supported by the fact that DCD recovery commonly improved a few weeks following application (), suggesting that DCD may have been washed from grass surfaces over time. Incomplete DCD recovery could also have been due to DCD adsorption on soil organic matter (Welten et al. Citation2012). However, this effect would probably have been small because Welten et al. (Citation2012) measured DCD recovery efficiencies ranging from 65% in a silty peat soil to 94% in the Tokomairiro soil of our study. In years 2 and 3, DCD recovery rarely exceeded 5 kg DCD ha−1 in soil, even immediately following (re-)application(s). Antecedent weather and soil conditions may have modified application rate and subsequent efficacy of DCD to inhibit nitrification. Gillingham et al. (Citation2012) indicated that rainfall and high soil moisture immediately prior to DCD application may have increased DCD leaching losses, although rainfall and soil moisture were high at the start of year 1 also. Field observations suggest that high wind may also affect application by dispersing DCD spray on to unintended areas. Soil
and N2O emissions results over all trial years suggest however that there was sufficient DCD present to inhibit nitrification for at least 8 weeks, and in some cases up to 12–15 weeks.
Nitrous oxide emissions
The inhibition of nitrification rates due to DCD application significantly reduced N2O emissions from urine patches in all treatments and all years. Reductions in total N2O losses ranged from 33%–72% (56% average over 3 years), which are within the range of other New Zealand studies (de Klein et al. Citation2011; Cameron et al. Citation2014; Kim et al. Citation2014; Ledgard et al. Citation2014). The majority of N2O emissions occurred in the 6–8 weeks following treatment applications, and in year 3, DCD effectiveness in reducing N2O emissions was higher with five compared with two applications. However, at c. NZ$100 ha−1 per application, the costs of five DCD applications will most likely outweigh the additional benefit of reduced N2O emissions. In year 1, total N2O emissions from the dung treatment were low but DCD application still resulted in a similar proportional reduction in emissions as for the urine treatment. Total N2O emissions from urine patches showed a large inter-annual variation, with emissions from patches applied in years 2 and 3 being two to four times higher than from urine applied in year 1. The N2O emission factors for urine and dung (calculated as the amount of N2O-N emitted as a percentage of the total urine-N applied; de Klein et al. [Citation2011]) in year 1 were similar to the New Zealand Greenhouse Gas Inventory values of 1% and 0.25%, respectively (Ministry for the Environment Citation2013). In years 2 and 3, the emission factors for urine were four to six times higher than the New Zealand value and in the very top range of (or even higher than) values observed in all previous New Zealand studies (Kelliher et al. Citation2014). This inter-annual variation could be due to differences in weather conditions (warmer and wetter, particularly in year 3) or due to differences in soil biological and/or physical conditions in the trial areas. Although the trial areas for the three years were all located within the same paddock, soil micro-porosity was significantly higher in the year 3 trial area (). Additional measurements also suggested that the earthworm population was higher in the trial area in year 3 (data not shown), which could also have affected the N2O emissions (e.g. Lubbers et al. Citation2013).
Nitrate leaching
DCD applications did not significantly affect nitrate leaching losses in drainage water. The estimated annual N leaching losses at our study site (9–16 kg N ha−1) were low compared with N leaching losses measured in other grass-clover based grazed systems (Ledgard et al. Citation2009) but very similar to those measured in a 4-year study in Southland (7–15 kg N ha−1; Monaghan et al. Citation2009). However, in their study, Monaghan et al. (Citation2009) did find that DCD significantly reduced N leaching losses by 21%–56%. The low N leaching losses at our study site are also supported by relatively low peak soil concentrations of <75 kg N ha−1 at 0–20 cm depth in the mowing trial. In comparison, maximum soil
concentrations at the Tokanui NOMR site (Ledgard et al. Citation2014) were c. 150 kg N ha−1. This may suggest that denitrification rates were higher in our imperfectly draining soil compared with the free-draining allophanic soil at Tokanui, thus minimising the risk of N leaching. The relatively high N2O emission rates at our site, especially in years 2 and 3, would support this conclusion.
Pasture dry matter responses
In the mowing trial, DCD application significantly (P < 0.05) increased spring pasture responses from urine by 9%–12% across all years. Annual increases in DM response from DCD in urine treatments ranged from 3%–11% but these were not statistically significant. These DCD-induced DM responses are similar to those found following urine application in other mowing trails (e.g. Menneer et al. Citation2008; Sprosen et al. Citation2009; Cameron et al. Citation2014; Kim et al. Citation2014; Ledgard et al. Citation2014). In the grazing trial, DCD application did not increase pasture yield at individual grazing events, nor cumulative seasonal or annual DM yields. These results are in contrast to other South Island grazing trials (Moir et al. Citation2007; Carey et al. Citation2012), but similar to those obtained in some or all trial years of the other NOMR sites (Cameron et al. Citation2014; Kim et al. Citation2014; Ledgard et al. Citation2014). Similarly, in their 4-year grazing study in Southland, Monaghan et al. (Citation2009) did not find any significant effect of DCD application on pasture responses. These authors suggested that the DM response appeared to be consistent with what could be expected based on the amount of additional N available due to reduced gaseous and leaching losses, and from decomposition of DCD itself. The incomplete DCD recovery that was observed in our study could have influenced the DCD effect on pasture responses in the grazing trial. However, the mowing trial results show that despite this incomplete DCD recovery, DM responses following urine application were significantly higher in the DCD plots. In addition, the soil mineral N and N2O emission results indicated that sufficient DCD was present to inhibit nitrification for up to 3–4 months. It is therefore unlikely that the lack of pasture response in the grazing trial was due to reduced DCD availability in the soil. DM responses in a grazing trial are by definition much more variable than in mowing trials and small increases in DM production may be difficult to detect with current pasture measurement techniques.
Conclusion
DCD application(s) to a South Otago imperfectly drained soil inhibited nitrification rates and significantly reduced the N2O emission factor from urine patches by 33%–72%. N2O emissions from the site were relatively high, especially in years 2 and 3, which suggested that soil and climatic conditions were favourable for denitrification. As a result, N leaching losses were relatively low and no significant effect of DCD could be detected, despite soil concentrations in urine patches being significantly reduced following DCD application. DCD applications significantly increased spring and annual pasture responses in urine patches in the mowing trial, but no significant pasture responses were measured under grazing. Increasing the number of DCD applications during the season increased the effectiveness of DCD on increased pasture response and reduced N2O emissions from urine patches.
Acknowledgements
The authors wish to thank Telford farm staff and the Invermay technical team for their assistance in the field and lab. These trials were conducted under the nitrous oxide mitigation research (NOMR) programme, jointly funded by the Ministry for Primary Industries (MPI; formerly the Ministry of Agriculture and Forestry), DairyNZ, Fonterra Co-operative Group Ltd, Ravensdown Fertiliser Co-operative Ltd, Ballance Agri-Nutrients Ltd and the Pastoral Greenhouse Gas Research Consortium (PGgRc).
References
- Amberger A 1989. Research on dicyandiamde as a nitrification inhibitor and future outlook. Communications in Soil Science and Plant Analysis 20: 1933–1955.
- Cameron KC, Di HJ, Moir JL 2014. Dicyandiamide (DCD) effect on nitrous oxide emissions, nitrate leaching and pasture yield in Canterbury, New Zealand. New Zealand Journal of Agricultural Research. doi:10.1080/00288233.2013.797914.
- Carey PL, Jiang S, Roberts AH 2012. Pasture dry matter responses to the use of a nitrification inhibitor: a national series of New Zealand farm trials. New Zealand Journal of Agricultural Research 55: 63–72.
- de Klein CAM, Barton L, Sherlock RR, Li Z, Littlejohn RP 2003. Estimating a nitrous oxide emission factor for animal urine from some New Zealand pastoral soils. Australian Journal of Soil Research 41: 381–399.
- de Klein CAM, Cameron KC, Di HJ, Monaghan RM, Sherlock RR 2011. Repeated annual use of the nitrification inhibitor dicyandiamide (DCD) does not alter its effectiveness in reducing N2O emissions from cow urine. Animal Feed Science and Technology 166–167: 480–491. 10.1016/j.anifeedsci.2011.04.076
- de Klein CAM, Monaghan RM 2011. The effect of farm and catchment management on nitrogen transformations and N2O losses from pastoral systems-can we offset the effects of future intensification? Current Opinion in Environmental Sustainability 3: 396–406. 10.1016/j.cosust.2011.08.002
- Di HJ, Cameron KC 2002. The use of a nitrification inhibitor, dicyandiamide (DCD), to decrease nitrate leaching and nitrous oxide emissions in a simulated grazed and irrigated grassland. Soil Use and Management 18: 395–403.
- Di HJ, Cameron KC 2012. How does the application of different nitrification inhibitors affect nitrous oxide emissions and nitrate leaching from cow urine in grazed pastures? Soil Use and Management 28: 54–6110.1111/j.1475-2743.2011.00373.x
- Di HJ, Cameron KC, Sherlock RR, Shen JP, He JZ, Winefield CS 2010. Nitrous oxide emissions from grazed grassland as affected by a nitrification inhibitor, dicyandiamide, and relationships with ammonia oxidising bacteria and archaea. Journal of Soils and Sediments 10: 943–954
- Drewry JJ, Lowe JAH, Paton RJ. 1999. Effect of sheep stocking intensity on soil physical properties and dry matter production on a Pallic Soil in Southland. New Zealand Journal of Agricultural Research 42: 493–499. 10.1080/00288233.1999.9513399
- Farmworks 2008. F400 electronic rising plate meter user manual. Farmworks Precision Farming Systems, Fielding, New Zealand. p. 59.
- Gillingham AG, Ledgard SF, Saggar S, Cameron KC, Di HJ, de Klein CAM et al. 2012. Initial evaluation of the effects of dicyandiamide (DCD) on nitrous oxide emissions, leaching and dry matter production from dairy pastures in a range of locations within New Zealand. In: Currie LD, Christensen CL eds. Advanced nutrient management: gains from the past – goals for the future. Occasional Report No. 25. Fertilizer and Lime Research Centre, Massey University, Palmerston North, New Zealand. 16 p.
- Haynes RJ, Williams PH 1993. Nutrient cycling and soil fertility in the grazed pasture ecosystem. Advances in Agronomy 49: 119–199
- Hewitt AE 1998. New Zealand soil classification. Lincoln, Landcare Research Ltd. 133 p.
- Kelliher FM, Clough TJ, Clark H, Rhys G, Sedcole JR 2008. The temperature dependence of dicyandiamide (DCD) degradation in soils: a data synthesis. Soil Biology and Biochemistry 40: 1878–1882.
- Kelliher FM, Cox N, van der Weerden TJ, de Klein CAM, Luo J, Cameron KC et al. 2014. Statistical analysis of nitrous oxide emission factors from pastoral agriculture field trials conducted in New Zealand. Environmental Pollution 186: 63–66
- Kim D-G, Giltrap DL, Saggar S, Hanly J 2014. Field studies assessing the effect of dicyandiamide (DCD) on pasture yields, N2O emissions and N-leaching in the Manawatu region. New Zealand Journal of Agricultural Research. doi:10.1080/00288233.2013.855244.
- Kim DG, Palmada T, Berben P, Giltrap D, Saggar S 2012. Seasonal variations in the degradation of a nitrification inhibitor, dicyandiamide (DCD), in a Manawatu grazed pasture soil. In: Currie LD, Christensen CL eds. Advanced nutrient management: gains from the past – goals for the future. Occasional Report no. 25. Palmerston North, Fertilizer and Lime Research Centre, Massey University. 7 p.
- Ledgard SF 2001. Nitrogen cycling in low input legume-based agriculture, with emphasis on legume/grass pastures. Plant and Soil 228: 43–59.
- Ledgard SF, Luo J, Sprosen MS, Wyatt J, Balvert S, Lindsey S 2014. Effects of the nitrification inhibitor dicyandiamide (DCD) on pasture production, nitrous oxide emissions and nitrate leaching in Waikato, New Zealand. New Zealand of Agricultural Research. doi:10.1080/00288233.2014.928642.
- Ledgard SF, Schils R, Eriksen J, Luo J 2009. Environmental impacts of grazed clover/based pastures. Irish Journal of Agricultural and Food Research 48: 209–226.
- Lubbers IM, González EL, Hummelink EWJ, Van Groenigen JW 2013. Earthworms can increase nitrous oxide emissions from managed grassland: a field study. Agriculture, Ecosystems and Environment 174: 40–48.
- Macdonald KA, Williams Y, Dobson-Hill B 2010. Effectiveness of a nitrification inhibitor (DCn) on a coastal Taranaki dairy farm. Proceedings of the New Zealand Grasslands Association 72: 147–152.
- Menneer JC, Ledgard SF, Sprosen MS 2008. Soil N process inhibitors alter nitrogen leaching dynamics in a pumice soil. Australian Journal of Soil Research 46: 323–331.
- Ministry for the Environment 2013. New Zealand's Greenhouse Gas Inventory 1990–2011. Publication number: ME 1113. Wellington, Ministry for the Environment. 456 p.
- Moir JL, Cameron KC, Di HJ 2007. Effects of the nitrification inhibitor dicyandiamide on soil mineral N, pasture yield, nutrient uptake and pasture quality in a grazed dairy pasture. Soil Use and Management 23: 111–120.
- Monaghan RM, Smith LC, de Klein CAM 2013. The effectiveness of the nitrification inhibitor dicyandiamide (DCD) in reducing nitrate leaching and nitrous oxide emissions from a grazed winter forage crop in southern New Zealand. Agriculture, Ecosystems and Environment 175: 29–38.
- Monaghan RM, Smith LC, Ledgard SF 2009. The effectiveness of a granular formulation of dicyandiamide (DCD) in limiting nitrate leaching from a grazed dairy pasture. New Zealand Journal of Agricultural Research 52: 145–159.
- Smith LC, de Klein CAM, Catto WD 2008. Effect of dicyandiamide applied in a granular form on nitrous oxide emissions from a grazed dairy pasture in Southland, New Zealand. New Zealand Journal of Agricultural Research 51: 387–396.
- Sprosen MS, Ledgard SF, Lindsey SB 2009. Effect of rate and form of dicyandiamide application on nitrate leaching and pasture production from a volcanic ash soil in the Waikato. New Zealand Journal of Agricultural Research 52: 47–55.
- Statistics NZ 2012. www.stats.govt.nz (accessed 16 December 2013).
- Welten B, Kear M, Dexter M, Judge A 2012. Efficiency of DCD extraction from soils. In: Currie LD, Christensen CL eds. Advanced nutrient management: gains from the past – goals for the future. Occasional Report No. 25. Palmerston North, Fertilizer and Lime Research Centre, Massey University. 5 p. http://flrc.massey.ac.nz/publications.html (accessed 28 February 2014).