
Abstract
The objective of this study was to determine the relationships between ewe lamb live weight and body condition score immediately prior to breeding with fertility (ewes pregnant per 100 ewes bred) and reproductive rates (fetuses per 100 ewes bred). Over 2 years, ewe lambs on seven commercial sheep farms in the North Island of New Zealand were monitored during the breeding period until pregnancy diagnosis. Live weight and body condition score were recorded prior to breeding. Fertility rates increased with live weight up to 47.4 kg but did not increase above this (P > 0.05). Reproductive rate peaked for ewes in the 47.5–52.4 kg breeding live weight category at 138% (133%–143%). Ewe fertility peaked at a body condition score (BCS) of 3.5 (90% [88%–91%]) while reproductive rates peaked at a BCS of 3.0 (130% [127%–133%]). The apparent plateauing of the relationship indicates there is a point at which no further benefits are gained from increasing live weight or BCS.
Introduction
In an extensive pastoral production system, breeding ewe lambs at 7–9 months of age has a number of advantages (Kenyon et al. Citationin press). It allows the utilisation of an animal class that may not otherwise be productive, thereby increasing the potential lifetime production of the ewe (McCall & Hight Citation1981). In addition, ewe lamb breeding can increase the total number of lambs born on the farm, thus providing a means of increasing profits and the rate of genetic gain (Tyrrell Citation1976; Kenyon & Proctor et al. Citation2008). There are, however, a number of limitations including low and variable fertility and reproductive rates (Hight Citation1982; Kenyon & Pinchbeck et al. Citation2004). Fertility rates of ewe lambs have been reported to be between 47% and 82% compared with 85%–97% in mature multiparous ewes (Donald et al. Citation1968; Forrest & Bichard Citation1974; Annett & Carson Citation2006; Mulvaney et al. Citation2013).
Fertility rates in ewe lambs are limited due to a number of factors including failure to attain puberty prior to the breeding period, silent oestrus (oestrus without ovulation), shorter and less intense oestrus, impaired breeding behaviour, insemination failure and fertilisation failure (Dyrmundsson Citation1973; Allison et al. Citation1975; Keane Citation1976; Quirke et al. Citation1981; Quirke & Hanrahan Citation1983; Smith & Knight Citation1998). The threshold breeding live weight for ewe lambs to reach puberty is between 40% and 70% of their mature live weight (Dyrmundsson Citation1973; Jainudeen et al. Citation2000). Live weight of mature ewes during breeding is known to be positively associated with increased ovulation rates in adult ewes (Coop Citation1962; Smith Citation1991; Scaramuzzi et al. Citation2006). Therefore, it would be expected that heavier live weights at the start of the breeding period would result in improved reproductive rates. A series of studies conducted in New Zealand have shown that ewe lambs bred early in the breeding period or that were identified with twin fetuses were heavier, on average, than ewe lambs bred later in the breeding period, were not pregnant, or had only one fetus (Kenyon & Morris et al. Citation2008; Kenyon et al. Citation2009, Citation2010). Studies in Australia and the USA have also shown a positive relationship with ewe lamb live weight and reproductive performance (Gaskins et al. Citation2005; Rosales Nieto et al. Citation2013). However, a limitation across these studies is the relatively small number of animals involved and that they were conducted under experimental conditions rather than on commercial farms.
In mature ewes, body condition score (BCS) has a positive effect on reproductive performance to at least a BCS of 3.0 (Gunn & Maxwell et al. Citation1991; Kenyon & Morel et al. Citation2004). However, few studies have examined the effect of BCS on ewe lamb reproductive performance. Ewe lambs bred early in the breeding period had, on average, higher condition scores than ewe lambs bred later or that were not bred (Kenyon et al. Citation2009). In addition, a greater ewe lamb BCS has been associated with a greater number of fetuses identified at pregnancy diagnosis (Cave et al. Citation2012). Again these studies have included relatively small numbers of animals. Therefore, the aim of the current study was to determine the relationship of ewe lamb breeding live weight and BCS on fertility and reproductive rates of large numbers of ewe lambs on commercial sheep farms within the North Island of New Zealand.
Materials and methods
The current study was undertaken over 2 years (2011 and 2012). In 2011, ewe lambs on two properties—farm A located in the Waikato region (latitude 37.78° S, longitude 175.28° E) and farm B in the Wairarapa region (latitude 40.97° S, longitude 175.65° E) of the North Island of New Zealand—were enrolled. In the following year (2012), four additional farms (farms C, D, E and F) located in the Wairarapa region and one farm (farm G) in the Manawatu region (latitude 40.36° S, longitude 175.61° E) were added to the study along with a new cohort of ewe lambs enrolled on farms A and B. Ewe lambs on each farm were managed under commercial farming conditions and according to the normal practice for that farm from breeding to pregnancy diagnosis (on average 94 days after introduction of the ram).
The predominant breed over the seven farms was the Highlander® composite (½ Romney, ¼ Texel, ¼ Finnish Landrace) on farms B, C, D and E. Farm A was in the process of transitioning from a Romney × Finnish Landrace to Coopworth × Finnish Landrace breed. Farms F and G had straight bred Romney and Coopworth ewes, respectively.
A summary of the breeding programme on each farm for each year is given in . Prior to breeding, five of the seven farms (B, C, D, E and G) introduced vasectomised rams for 17 days which were then removed at the start of the breeding period. All seven farms utilised a 34-day breeding period.
Table 1 Summary of breeding of ewe lambs on each property (farms A, B, C, D, E, F and G) and year (2011 and 2012) including the number of ewe lambs, minimum ewe lamb live weight (kg) for breeding, breeding start date, ratio of rams to ewe lambs, duration of the breeding period and the pregnancy diagnosis date.
Measurements
Within 7 days of breeding, ewe lamb live weights and body condition scores (BCS) were recorded. BCS was recorded by a single operator on all sevens farms using a scale of 1 to 5 with increments of 0.5 (1.0 = emaciated and 5.0 = grossly fat [Jefferies Citation1961; Kenyon et al. Citation2014]). Pregnancy diagnosis using trans-abdominal ultrasound was used a minimum of 45 days after the completion of the breeding period to determine, first, if a ewe lamb was pregnant (yes or no) and, second, the number of fetuses present (0 or 1 or 2). The pregnancy diagnosis on each farm was conducted by a commercial technician regularly contracted to that property.
Statistical analyses
All statistical analyses were conducted using SAS (SAS Institute Inc, Cary, NC, USA). The analyses included all ewe lambs identified as bearing 0, 1 or 2 fetuses that had either breeding live weight or BCS recorded prior to breeding and that also had pregnancy diagnosis results. Ewe lambs identified as bearing triplet fetuses were excluded from the analyses due to small total numbers (n = 16) and uneven distribution across farms. The analyses included a small number of ewe lambs that had breeding live weights but no BCS (n = 70) and ewe lambs that had BCS but no breeding live weights (n = 40).The total number of ewe lambs included in the analyses was 15,510. Farms A and B had data collected over 2 years, and the remainder of the farms (farms C, D, E, F and G) had data from only 1 year, therefore, each farm and year was treated as a single unit (n = 9; FarmA_2011, FarmA_2012, FarmB_2011, FarmB_2012, FarmC_2012, FarmD_2012, FarmE_2012, FarmF_2012 and FarmG_2012). Due to differences in ewe lamb breed, management practices and environment between farms, the interaction of farm and live weight or BCS was not tested.
Comparison between farms
The ewe lamb breeding live weight was compared between farms using a general linear model (Proc Mixed; SAS) with the fixed effect of farm. Breeding BCS and reproductive rates between farms were compared using a generalised linear model (Proc Genmod; SAS) based on a Poisson distribution and a logit transformation and included farm as a fixed effect. Fertility rate was analysed using the same generalised linear model, but was based on a binomial distribution and a logit transformation.
Breeding live weight
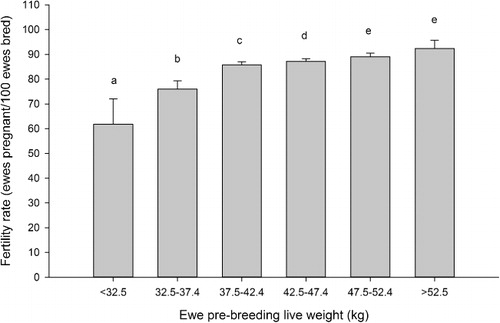
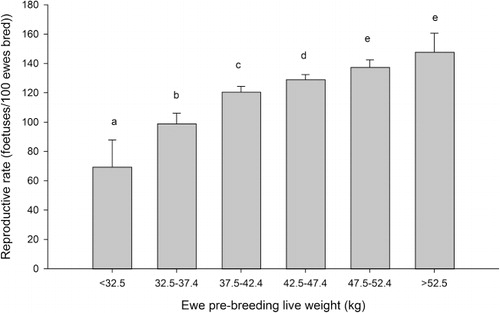
The breeding live weight of the ewe lambs was divided into categories as follows: <32.5 kg (n = 100), 32.5–37.4 kg (n = 947), 37.5–42.4 kg (n = 5423), 42.5–47.4 kg (n = 6122), 47.5–52.4 kg (n = 2471) and ≥52.5 kg (n = 377). The effect of the breeding live weight category on ewe lamb’s fertility (ewes pregnant per 100 ewes presented for breeding) and reproductive rate (fetuses per 100 ewes presented for breeding) at pregnancy diagnosis was analysed using a general model (Proc Genmod; SAS). Fertility (pregnant or non-pregnant) was analysed with a binomial distribution and logit link function with farm and live weight category fitted as fixed effects. Reproductive rate (0, 1 or 2 fetuses) was analysed with a Poisson distribution and logit link function with farm and breeding live weight category fitted as fixed effects.
Breeding BCS
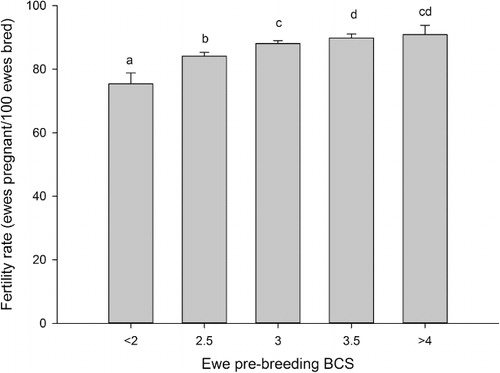
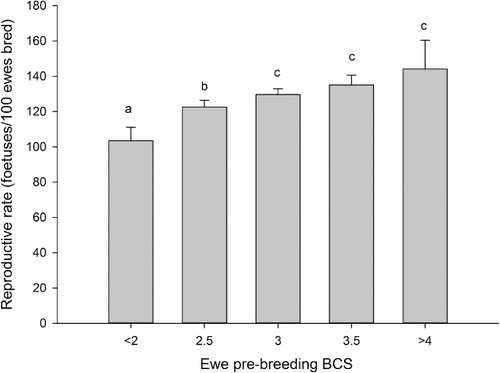
Due to low numbers of ewe lambs with breeding BCS scores of less than 2.0 or greater than 4.0 the following BCS categories were created: ≤2.0 (n = 935), 2.5 (n = 5437), 3.0 (n = 6912), 3.5 (n = 1932) and ≥4.0 (n = 254). The effect of the breeding BCS category of the ewe lamb on fertility and reproductive rate at pregnancy diagnosis was analysed using a general model (Proc Genmod; SAS). Fertility rate was analysed with a binomial distribution and logit link function with farm and BCS category fitted as fixed effects. Reproductive rate was analysed with a Poisson distribution and logit link function with farm and BCS category fitted as fixed effects. Each model was run both with, and without, ewe lamb breeding live weight as a covariate in the model.
Results
Description of farm and year
The breeding live weight and BCS of ewe lambs varied widely between farms and between years (). Fertility and reproductive rates also varied between farms and within years on farms that were recorded over 2 years.
Table 2 Summary statistics of breeding live weight (kg; ± s.e.), body condition score, fertility rate (ewes pregnant per 100 ewes bred) and reproductive rate (fetuses per 100 ewes bred) of ewe lambs by farm and year.
Effect of ewe lamb live weight
The percentage of ewes identified as pregnant increased as ewe lamb breeding live weight increased from <32.5 to 47.5–52.4 kg (P < 0.05, ). Fertility rates of ewes that weighed ≥52.5 kg did not differ from that of ewes weighing 47.5–52.4 kg (P > 0.05).
The reproductive rate showed a similar pattern to fertility rate. Reproductive rate increased as live weight increased from <32.5 to 47.5–52.5 kg (P < 0.05, ). The reproductive rate of ewes that weighed 52.5–57.4 kg did not differ from ewes that weighed 47.5–52.4 kg (P > 0.05).
Effect of ewe lamb condition score
Fertility rate increased as breeding BCS increased to 3.5 (P < 0.05, ). However, the fertility rate of ewes with BCS >4.0 did not differ from that of those with BCS greater than 3.0 (P > 0.05). The addition of ewe live weight as a covariate in the fertility rate model resulted in changes in the pattern of differences observed. The fertility rate of ewes with a BCS ≤2.0 remained lower than those in the BCS 2.5, 3.0, 3.5 and ≥4.0 categories (78% vs 85%, 88%, 88% and 89%, respectively). While the fertility rate of BCS 2.5 ewes was lower (P < 0.05) than that of the BCS 3.0 and 3.5 ewes, it did not differ from BCS ≥4.0 ewes (P > 0.05) and there were no significant differences in fertility rate between BCS 3.0, 3.5 and ≥4.0 ewes (P > 0.05).
Reproductive rates increased as the breeding BCS category increased to 3.0 (P < 0.05, ), however, ewes with a BCS of 3.5 and ≥4.0 did not differ from those with BCS of 3.0 (P > 0.05). The inclusion of ewe lamb live weight as a covariate in the model resulted in changes in the pattern of differences observed. The reproductive rate of ewes in the BCS ≤2.0 category remained lower than those with BCS 2.5, 3.0, 3.5 and ≥4.0 (1.09 vs 1.22, 1.27, 127 and 1.31, respectively, P < 0.05). However, the reproductive rates of ewes in the BCS 2.5, 3.0, 3.5 and ≥4 categories no longer differed (P > 0.05).
Discussion
The aim of the current experiment was to determine the effect of ewe lamb live weight and body condition score at the start of the breeding period on their subsequent reproductive and fertility rates under commercial conditions in New Zealand. Previously in New Zealand, the relationships of live weight and BCS with reproductive performance have only been examined as part of smaller studies designed to investigate other aspects of ewe lamb management. Therefore this study set out to examine these relationships with large numbers of ewe lambs on commercial farms. On the farms in this study, fertility rates ranged from 77% to 92% and reproductive rates were between 108% and 145% which were in the upper range of those previously reported by other researchers both in New Zealand (Kenyon et al. Citation2010; Mulvaney et al. Citation2013) and in the Northern Hemisphere (Donald et al. Citation1968; Gaskins et al. Citation2005; Annett & Carson Citation2006). The differences in fertility and reproductive rates between farms could not be examined due to variation and confounding due to breed, environment and farming systems.
Improvements in both fertility and reproductive rates were observed with increases in breeding live weight up to 47.5 kg, with further increases in live weight resulting in no additional gains. This positive relationship, at least up to 47.5 kg, is in agreement with the previous findings of Kenyon & Morris et al. (Citation2008) and Kenyon et al. (Citation2009, Citation2010) in Romney ewe lambs in New Zealand and Rosales Nieto et al. (Citation2013) in Merino ewe lambs in Australia. If the current industry guidelines were followed—that is, to breed only ewe lambs with live weights greater than 40 kg—reproductive rates of 121% could potentially be achieved. However, if farmers were to use a minimum live weight of 42 kg, this could result in reproduction rates of 130%. For mature ewes it has been reported previously that the proportion of multiple bearing ewes increases at a diminishing rate of return with live weight until plateauing (Smith Citation1991). Therefore it is unsurprising that there appears to be a plateauing of reproductive rate in heavier hoggets.
Ewe lamb fertility and reproductive rates also improved with increasing breeding BCS up to BCS 3.0 for fertility and BCS 3.5 for reproductive rate. This finding is somewhat in agreement with Kenyon et al. (Citation2010) and Smith & Knight (Citation1998), who reported that ewe lambs with a BCS of >2.5 had higher fertility rates than those with a BCS of 2.0 which in turn had higher rates than BCS 1.5 ewe lambs. Although there have been few studies examining the effect of BCS on the reproduction of ewe lambs, this relationship is similar to that observed in mature ewes.
In mature ewes, both very low and very high BCS have the potential to affect reproductive rates negatively (Kenyon & Morel et al. Citation2004; Maurya et al. Citation2009; Sejian et al. Citation2009; Yilmaz et al. Citation2011). Body condition of mature ewes has consistently been reported to have a positive relationship with ovulation rate (Bastiman Citation1972; Rhind et al. Citation1984) and a plateauing relationship with fertility rate (Gunn & Maxwell et al. Citation1991; Gunn & Smith et al. Citation1991). In addition, reproductive rates of mature ewes showed a positive relationship with BCS (Kleemann & Walker Citation2005). However, others have reported a relationship that plateaued at moderate condition scores of 2.0, 2.5 and 3.0 (Gunn & Maxwell et al. Citation1991; Kenyon & Morel et al. Citation2004).
In the current study, the effect of body condition score on ewe lamb reproductive and fertility rates was partially explained by live weight. The inclusion of ewe lamb breeding live weight in the BCS models for reproductive and fertility rates resulted in no differences in BCS above BCS 2.0 and 2.5, respectively. Therefore in the current study, it appears that poor reproductive performance of ewe lambs with a BCS of 2.0 or less was independent of ewe lamb live weight. Therefore, if ewe lambs have a body condition score of greater than 2.0, differences in fertility and reproductive rate appear to be explained by differences in live weight. Body condition score is closely related to total body fat (Kenyon et al. Citation2014). Stephenson et al. (Citation1980) concluded that the rate of fat increase was related to onset of sexual maturity, therefore, ewe lambs with small fat deposits may be delayed in reaching sexual maturity resulting in reduced fertility and reproductive rates. This finding illustrates the importance of BCS as a method of determining whether a ewe lamb should be bred.
In conclusion, these data suggest that to maximise both ewe lamb fertility and reproductive rate, farmers should aim either to have ewe lambs at a minimum BCS of 3.0 or a minimum live weight of 47.5 kg. The further that ewe lambs are below these targets, the poorer their reproductive performance will be.
Acknowledgements
The authors wish to acknowledge the help provided by the farm staff on each of the properties and the Massey University technical staff involved in this study. Funding for this study was provided by Beef + Lamb NZ, C. Alma Baker Trust and Massey University. R.A. Corner-Thomas is partly funded by C. Alma Baker Trust and P.R. Kenyon by the National Research Centre for Growth and Development (Gravida).
References
- Allison AJ, Kelly RW, Lewis JS, Binnie DB 1975. Preliminary studies on the efficiency of mating on ewe hoggets. Proceedings of the New Zealand Society of Animal Production 35: 83–90.
- Annett RW, Carson AF 2006. Effects of plane of nutrition during the first month of pregnancy on conception rate, foetal development and lamb output of mature and adolescent ewes. Animal Science 82: 947–954.
- Bastiman B 1972. The effect of ewe condition at tupping on lambing performance. Experimental Husbandry 22: 22–24.
- Cave LM, Kenyon PR, Morris ST 2012. Effect of timing of exposure to vasectomised rams and ewe lamb body condition score on the breeding performance of ewe lambs. Animal Production Science 52: 471–477.
- Coop IE 1962. Liveweight-productivity relationships in sheep. New Zealand Journal of Agricultural Research 5: 249–264.
- Donald HP, Read JL, Russell WS 1968. A comparative trial of crossbred ewes by Finnish Landrace and other sires. Animal Production 10: 413–421.
- Dyrmundsson OR 1973. Puberty and early reproductive performance in sheep. I. Ewe lambs. Animal Breeding Abstracts 41: 273–289.
- Forrest PA, Bichard M 1974. Analysis of production records from a lowland sheep flock. 2. Flock statistics and reproductive-performance. Animal Production 19: 25–32.
- Gaskins CT, Snowder GD, Westman MK, Evans M 2005. Influence of body weight, age, and weight gain on fertility and prolificacy in four breeds of ewe lambs. Journal of Animal Science 83: 1680–1689.
- Gunn RG, Maxwell TJ, Sim DA, Jones JR, James ME 1991. The effect of level of nutrition prior to mating on the reproductive-performance of ewes of 2 Welsh breeds in different levels of body condition. Animal Production 52: 157–163.
- Gunn RG, Smith WF, Senior AJ, Bartham E, Sim DA, Hunter EA 1991. Pre-mating herbage intake and the reproductive performance of North Country Cheviot ewes in different levels of body condition. Animal Production 52: 149–156.
- Hight GK 1982. Improving the efficiency of breeding schemes. In: Wickham GA, McDonald MF eds. Sheep production: volume one breeding and reproduction. Auckland, New Zealand, New Zealand Institute of Agricultural Science. Pp. 169–197.
- Jainudeen MR, Wahid H, Hafez ESE 2000. Sheep and goats. In: Hafez B, Hafez ESE eds. Reproduction in farm animals. Baltimore, MD, Lippincott Williams & Wilkins. Pp. 172–181.
- Jefferies BC 1961. Body condition scoring and its use in management. Tasmanian Journal of Agriculture 32: 19–21.
- Keane MG 1976. Breeding from ewe lambs. Farm and Food Research 7: 10–12.
- Kenyon PR, Morel PCH, Morris ST 2004. The effect of individual liveweight and condition scores of ewes at mating on reproductive and scanning performance. New Zealand Veterinary Journal 52: 230–235.
- Kenyon PR, Pinchbeck GL, Perkins NR, Morris ST, West DM 2004. Identifying factors which maximise the lambing performance of hoggets: a cross sectional study. New Zealand Veterinary Journal 52: 371–377.
- Kenyon PR, Morris ST, Burnham DL, West DM 2008. Effect of nutrition during pregnancy on hogget pregnancy outcome and birthweight and liveweight of lambs. New Zealand Journal of Agricultural Research 51: 77–83.
- Kenyon PR, Proctor L, Morel PCH, Morris ST, West DM 2008. The effect of breeding ewe lambs on subsequent two-year-old ewe performance. Livestock Science 115: 206–210.
- Kenyon PR, Smith SL, Morel PCH, Morris ST, West DM 2009. The effect of the maturity and prior breeding activity of rams and body condition score of ewe hoggets on the reproductive performance of ewe hoggets. New Zealand Veterinary Journal 57: 290–294.
- Kenyon PR, Morris ST, West DM 2010. Proportion of rams and the condition of ewe lambs at joining influences their breeding performance. Animal Production Science 50: 454–459.
- Kenyon PR, Maloney SK, Blache D 2014. Review of sheep body condition in relation to production characteristics. New Zealand Journal of Agricultural Research 57: 38–64.
- Kenyon PR, Thompson AN, Morris ST in press. Breeding ewe lambs successfully to improve lifetime performance. Small Ruminant Research.
- Kleemann DO, Walker SK 2005. Fertility in South Australian commercial Merino flocks: relationships between reproductive traits and environmental cues. Theriogenology 63: 2416–2433.
- Maurya VP, Kumar S, Kumar D, Gulyani R, Joshi A, Naqvi SMK et al. 2009. Effect of body condition score on reproductive performance of Chokla ewes. Indian Journal of Animal Sciences 79: 1136–1138.
- McCall DG, Hight GK 1981. Environmental influences on hogget lambing performance and the relationship between hogget and two-tooth lambing performance. New Zealand Journal of Agricultural Research 24: 145–152.
- Mulvaney FJ, Morris ST, Kenyon PR, Morel PCH, West DM, Vinoles C et al. 2013. Comparison between the reproductive performance of ewe hoggets and mature ewes following a progesterone based oestrus synchronization protocol. New Zealand Journal of Agricultural Research 56: 288–296.
- Quirke JF, Hanrahan JP, Gosling JP 1981. Duration of estrus, ovulation rate, time of ovulation and plasma-LH, total estrogen and progesterone in Galway adult ewes and ewe lambs. Journal of Reproduction and Fertility 61: 265–272.
- Quirke JF, Hanrahan JP 1983. Comparison of the survival of fertilized-eggs from adult ewes in the uteri of adult ewes and ewe lambs. Journal of Reproduction and Fertility 68: 289–294.
- Rhind SM, Doney JM, Gunn RG, Leslie ID 1984. Effects of body condition and environmental-stress on ovulation rate, embryo survival, and associated plasma follicle-stimulating-hormone, luteinizing-hormone, prolactin and progesterone profiles in Scottish blackface ewes. Animal Production 38: 201–209.
- Rosales Nieto CA, Ferguson MB, Macleay CA, Briegel JR, Martin GB, Thompson AN 2013. Selection for superior growth advances the onset of puberty and increases reproductive performance in ewe lambs. Animal: An International Journal of Animal Bioscience 7: 990–997.
- Scaramuzzi RJ, Campbell BK, Downing JA, Kendall NR, Khalid M, Munoz-Gutierrez M et al. 2006. A review of the effects of supplementary nutrition in the ewe on the concentrations of reproductive and metabolic hormones and the mechanisms that regulate folliculogenesis and ovulation rate. Reproduction Nutrition Development 46: 339–354.
- Sejian V, Maurya VP, Naqvi SMK, Kumar D, Joshi A 2009. Effect of induced body condition score differences on physiological response, productive and reproductive performance of Malpura ewes kept in a hot, semi-arid environment. Journal of Animal Physiology and Animal Nutrition 94: 154–161.
- Smith JF 1991. A review of recent development on the effect of nutrition on ovulation rate (the flushing effect) with particular reference to research at Ruakura. Proceedings of the New Zealand Society of Animal Production 51: 15–24.
- Smith JF, Knight TW 1998. Reproductive management of sheep. In: Fielden ED, Smith JF, eds. Reproductive management of grazing ruminants in New Zealand. Hamilton, New Zealand, New Zealand Society of Animal Production. Pp. 113–134.
- Stephenson SK, Dalton DC, Kirton AH 1980. The relationships between growth, body shape and body composition to the initiation of oestrus activity in different sheep breeds. Proceedings of the New Zealand Society of Animal Production 40: 258–267.
- Tyrrell RN 1976. Some effects of pregnancy in 8-month-old Merino ewes. Australian Journal of Experimental Agriculture 16: 458–461.
- Yilmaz M, Altin T, Karaca O, Cemal I, Bardakcioglu HE, Yilmaz O et al. 2011. Effect of body condition score at mating on the reproductive performance of Kivircik sheep under an extensive production system. Tropical Animal Health and Production 43: 1555–1560.