
Abstract
Liveweight production was quantified from six dryland pastures at Lincoln University, Canterbury, New Zealand, over an 8 year period. The experiment was a randomised complete block with six replicates. The pastures were established in autumn 2002 with cocksfoot (CF) and subterranean (CF/Sub), balansa (CF/Bal), white (CF/Wc) or Caucasian (CF/Cc) clovers, a perennial ryegrass/white clover (RG/Wc) control and a lucerne (Luc) monoculture. Liveweight (LWt) production from Years 2 (2003–04) to 9 (2010–11) was 7940 kg LWt/ha from the lucerne monoculture, 7270 kg LWt/ha from the CF/Sub pasture and 5680 ± 171 kg LWt/ha from CF/Bal, CF/Wc, CF/Cc and RG/Wc pastures. Annually, LWt production ranged from 443 kg/ha (CF/Wc pastures with hoggets grazing in spring in 2006–07) to 1285 kg/ha from CF/Sub pastures in Year 9 when ewes with twin lambs at foot grazed in spring. On average, grass-based pastures produced 64%–70% of their total annual LWt production in spring compared with 57% from lucerne monocultures. In spring, relationships between LWt and total spring DM yield showed that 7.3 ± 0.68 kg LWt/ha was produced per 100 kg total DM (R2 = 0.87) grown in 5 of the 6 years under the hogget/weaned lamb grazing system. Relationships between LWt and metabolisable energy or N yield failed to improve this relationship, which suggests that DM yield from persistent improved pasture components was the major factor responsible for differences in LWt production from these optimally grazed pastures.
Introduction
Dryland, drought-prone farms on the east coast of New Zealand aim to finish priority stock, particularly spring lambs, on grazed pastures prior to the onset of summer water stress. There is also a financial incentive to finish lambs as early as possible associated with the supply of lamb to export markets. Prime lambs sent for slaughter are currently drafted at >33 kg/hd with carcass weights of at least 15–17 kg/hd from late November to mid December. Between 2011 and 2013, the average ‘hot’ carcass weight of lambs slaughtered nationally was 17.5–18.0 kg/hd for the November/December period (Ministry of Primary Industries Citation2014). The objective is to complete the main lamb draft at weaning, which occurs 12–14 weeks after lambing. Assuming a 5 kg/hd birth weight (Nicol & Brookes Citation2007), a lamb born on 1 September needs to gain 286 to 333 g/hd per day to reach prime weight of 33 kg/hd in this timeframe.
In spring, pasture growth is usually reliable in all areas of New Zealand because soil moisture is non-limiting and pasture growth rates increase in response to rising temperatures (Rickard & Radcliffe Citation1976). As soil water deficits develop and pasture growth rates decline, feed supply can fall behind animal demand and consequently liveweight (LWt) gain per head, and per unit area, decline. The quality of feed on offer is also reduced, particularly after anthesis in late spring, in grass-based pastures. Therefore, rapid animal LWt gain during spring from permanent pastures is important to ensure total animal demand on-farm is reduced before water stress limits pasture production. Spring lambs that have been retained after weaning because they failed to meet LWt targets are inefficient consumers of feed (Brown Citation1990) that could alternatively be used for capital stock. This change in the allocation of available feed can compromise production in the current and following season. Further, the variability of spring rainfall in these dry east coast regions (Salinger Citation2003) can accelerate or reduce the need to finish stock early. Therefore, farmers require pastures that supply a high quantity and quality of feed as early as possible, to grow as long as possible into summer and respond rapidly to any in-season rainfall.
In a previous paper we showed that annual dry matter (DM) yields from lucerne (Medicago sativa) monocultures were superior to those of the five grass-based pastures evaluated over 9 years in a temperate dryland grazed experiment (Mills et al. Citationin press). Of the grass-based pastures, cocksfoot (Dactylis glomerata) with the annual subterranean clover (Trifolium subterraneum) as a companion legume was the most productive over time. However, superior DM production does not necessarily translate into superior animal performance. Therefore, in this second paper in the series, we report the liveweight production from Coopworth sheep grazing these six dryland pastures established as a grazing experiment at Lincoln University from Year 2 (2003–04) to Year 9 (2010–11) and the average metabolisable energy (ME) and nitrogen content (N%) of sown pasture components.
Materials and methods
Full experimental details and environmental conditions were presented in Mills et al. (Citationin press). Briefly, the experiment used a randomised complete block design. Four replicates were established in February 2002 with an additional two replicates established in an adjacent paddock in autumn 2003. Replicates 5 and 6 were allowed to establish and data were included from the start of 2004–05 (Year 3). The site was flat with a Templeton silt loam soil (Udic Haplusoll USDA taxonomy) of variable depth to gravels, at Lincoln University, Canterbury, New Zealand. Pastures were cocksfoot (D. glomerata) established with subterranean (T. subterraneum; CF/Sub), balansa (T. michelianum; CF/Bal), white (T. repens; CF/Wc) or Caucasian (T. ambiguum; CF/Cc) clovers. There was also an industry standard perennial ryegrass (Lolium perenne)/white clover mix (RG/Wc) and a lucerne (M. sativa) monoculture (Luc). Plots measured 22 × 23 m (0.05 ha) with central laneways to facilitate stock movement. Sowing rates, pasture management and methodologies for pasture-related measurements were reported previously (Mills et al. Citationin press).
Stock management
Pastures were always de-stocked in winter when feed supply could not support grazing. This is a common commercial practice, whereby capital stock would be wintered on specialist annual fodder crops, conserved feed, or are grazed on a reduced portion of the property. Seasonal variation in rainfall across years (Mills et al. Citationin press) affected the initiation of spring and autumn grazing events. Therefore, the ‘spring’ production period was defined as the period 1 July (July)–30 November (Nov), which accounted for years when grazing events were initiated in late August (Aug) and represented the major pasture growth period. ‘summer’ was defined as the period from 1 December (Dec)–28 February (Feb) when soil moisture deficits usually restrict pasture growth. The ‘autumn’ production period was from 1 March (Mar)–30 June (Jun), which captured any post-summer grazing and accounted for years when a flush of growth followed late autumn rainfall events.
A ‘put and take’ system of animal management was used which allowed for stocking rates to be adjusted by adding ‘spares’ to the weighed ‘core’ animals to match feed supply and animal demand during grazing periods. For simplicity, grazing days reported here are one animal for one day and are not adjusted for stock class. Thus, in spring of Years 8 and 9, one ewe grazing for one day with twin lambs at foot is three grazing days. In almost all cases, stock of the same class were grazing all pasture treatments within a given LWt production period.
In Years 2 (2003–04) to 7 (2008–09), between five and 10 ‘core’ Coopworth ewe hoggets, selected on the basis of soundness and initial weight, were randomly allocated to one of the six pasture treatment groups in spring. Hoggets were replaced by weaned Coopworth ewe lambs when they became available (late spring/summer). Stock were weighed ‘empty’ before and after each grazing rotation associated with a specified LWt ‘production’ period. In Years 8 (2009–10) and 9 (2010–11) the grazing system was changed. Coopworth ewes with twin lambs at foot grazed until weaning in Nov/Dec. Animals were weighed ‘full’ during this period to prevent stress to young lambs. After weaning, lambs were returned to their treatment pastures and were weighed ‘empty’ before and after each liveweight ‘production’ period. Ewes were only returned after weaning for ‘maintenance’ grazing events as required.
During measured liveweight ‘production’ periods, treatment groups grazed the six replicates of their assigned pasture treatment. Production periods ended when there was insufficient growth to maintain grazing by core groups without altering animal behaviour due to low stock numbers. This occurred when moisture stress developed, and pasture growth rates declined in summer/autumn, or when temperatures declined which reduced growth rates in winter. Lucerne was rotationally grazed in a four (Years 1 and 2) or six (Years 3–9) paddock rotation throughout active growth periods. Grass-based pastures were set stocked in early spring (Brown et al. Citation2006) before moving to a three- or six-paddock rotational grazing system. For pasture established with annual clovers, stock were removed for a period in late spring to allow for reseeding every 2–3 years. In all cases, the aim was to provide best management practices that maximised animal production and maintained pasture quality.
Sheep grazing groups were not replicated. A seasonal weighted LWt gain (g/hd/day) was calculated for core animals in each stock class in spring, summer and autumn. This was multiplied by total production graze days (total number of stock × days grazing) to calculate animal LWt production from each plot suitable for data analysis (Brown et al. Citation2006).
‘Maintenance’ grazing events were associated with sward management. For annual clover plots, the purpose was to reduce pasture mass and dead material in the grass-dominant summer sward prior to autumn rains to allow germinating annual clover seedlings to re-establish. In other pastures, the aim was to remove seedheads and/or dead material that had built up during the reproductive phase. During early winter, lucerne underwent a ‘clean-up’ graze and subsequent herbicide application (Mills et al. Citationin press) as required. Maintenance grazing events were usually made by hoggets or ewes, which were stocked at high rates for short periods (9–17 days). Consequently, liveweight production was not measured, but grazing days were recorded. During these events, LWt production was assumed to be nil.
Pastures were grazed in Year 1 (2002–03), however, LWt was not measured in all rotations and the methodology for LWt production differed between grazing events. This was to enable all pastures to receive best management practices for establishment of the sown pasture components. This included letting the autumn-sown seedling lucerne crop flower before grazing in late spring 2002, and ceasing grazing in mid-spring so that pastures established with annual clovers could reseed in early summer 2002 to generate a seedbank for re-establishment in subsequent years. Consequently, for Year 1, LWt is not reported.
Statistical analysis
Annual and seasonal LWt production (kg LWt/ha) and seasonal grazing days (GD/ha) were calculated for each plot and analysed by ANOVA in Genstat (v.16, VSN International) in each year. An 8-year average was calculated to quantify the proportions of LWt and total DM produced in each season. Where significant, means were separated by Fishers protected LSD at α = 0.05.
The seasonally weighted liveweight gain per head (g/hd/d) was unreplicated but was analysed by ANOVA with year as the replicate. Analysis focused on spring periods in Years 2–7 when grazed by ewe hoggets. For the summer and autumn, the weighted LWt gains of the weaned lambs in Years 2–9 were analysed. These data were the most complete over time for similar stock classes within the specified seasons. The additional seasonal LWt gains are reported for completeness but could not be analysed when there was insufficient data for a given stock class, within a specified season, to provide replication over time.
A grouped linear regression was fitted to treatment mean data to explore the relationships between LWt and DM yield on an annual basis and for the critical spring period. For this analysis, data were restricted to Years 2–7 when the same stock classes (hoggets and weaned lambs) grazed. In Years 8 and 9, linear regressions were fitted separately, for reference only, as grazing management changed.
Production graze days were analysed within each season by ANOVA. Maintenance graze days for each season are shown for completeness. A seasonal average was calculated for metabolisable energy (ME; MJ ME/kg DM) and nitrogen concentration (N%) of the sown pasture components. Metabolisable energy and N yields were summed, from plot specific data, from spring, summer or autumn rotations in each year. Data were then averaged to generate a seasonal mean. For spring, a 7-year mean was calculated from nutritive data from Years 2, 3 and 5–9 as this corresponded with the LWt data presented here. Year 4 data had to be excluded because nutritive data from the November harvest were misplaced and this accounted for about 50% of the total spring yield. Summer and autumn means are for the 8-year period (Years 2–9) corresponding to the LWt data reported within this paper.
Supplementary data
For completeness, additional supplementary data that are outside the scope of this paper or which provide specific details not required here are available on the ‘MaxClover’ page of our website (www.lincoln.ac.nz/dryland). This includes full soil test results, analysed annual total and production graze days, the change in liveweight of core stock and raw arithmetic mean stocking rates specific to the ‘MaxClover’ grazing experiment.
Results
Total liveweight production was accumulated across all 8 years between 2003–04 (Year 2) and 2010–11 (Year 9). Stock grazing lucerne monocultures produced a total of 7940 kg LWt/ha. This was 9% more (P < 0.001) than the 7270 kg LWt/ha produced from CF/Sub pastures and 41% more than the 5680 ± 171 kg LWt/ha from CF/Bal, CF/Wc, CF/Cc and RG/Wc pastures. Total LWt accumulated from the CF/Sub pastures exceeded that of all other grass-based pastures by 28% or almost 1600 kg/ha.
Annual liveweight production
shows annual liveweight ranged from a minimum of 443 kg LWt/ha (CF/Wc pastures in 2006–07) to a maximum of 1156 kg LWt/ha (Luc 2004–05) in Years 2–7 (2003–04 to 2008–09). In 2009–10 and 2010–11, liveweight production from ewes with twin lambs and then weaned lambs ranged from 709 kg LWt/ha (RG/Wc in Year 9) to 1285 kg LW/ha from CF/Sub pastures in Year 9.
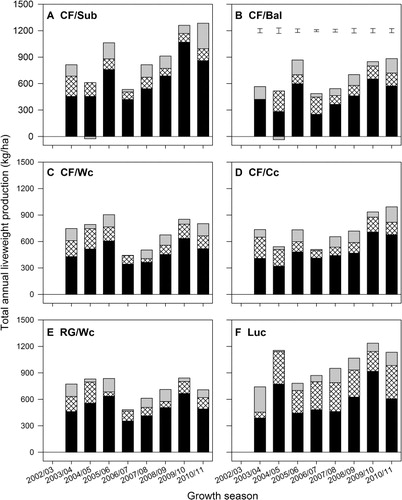
In 6 of the 8 years, LWt produced from the lucerne monocultures () was greater (P < 0.001) than, or similar to, that from the highest producing grass-based pasture. For example, in 2006–07, sheep grazing lucerne produced 871 kg LWt/ha, 67% more (P < 0.001) than the highest producing grass pastures (522 ± 22.6 kg LWt/ha from CF/Sub and CF/Cc pastures). In 2004–05, the 1156 kg LWt/ha from the lucerne pastures was 43% more (P < 0.001) than the 811 ± 62.5 kg/ha from pastures established with white clover (CF/Wc and RG/Wc); pastures established with either Caucasian or annual clovers produced the lowest LWt (536 ± 62.5 kg LWt/ha). In both 2007–08 and 2008–09, LWt production from lucerne was 17% more (P < 0.001) than that from the highest producing grass-based pasture (CF/Sub).
Of the grass-based pastures, LWt production from the CF/Sub () ranged from 534 (2006–07) to 1285 kg/ha/yr (2010–11). This was greater than, or similar to, LWt produced from lucerne monocultures in Years 2, 4, 8 and 9. Production from this pasture was similar to, or greater than, all other grass-based pastures in every year except 2004–05. From Year 6 (2007–08) onwards, the quantity of LWt produced from CF/Sub pastures was consistently superior (P < 0.001) to that of all other grass-based pastures. The CF/Bal () pastures produced between 487 and 884 kg LWt/ha/yr. In 5 of the 8 years this was the lowest, or similar to the lowest, LWt produced from any of the six pastures evaluated.
Liveweight produced from the CF/Wc pastures () ranged from 443 (2006–07) to 904 kg LWt/ha/yr (2005–06). In 2003–04 and 2004–05, the LWt produced from the CF/Wc pastures was similar to the highest producing grass-based pastures. From Year 5 (2006–07) until the experiment terminated in 2010–11, LWt produced from this pasture fell within the treatment group with the lowest LWt production annually. Stock grazing the CF/Cc pastures produced 493–993 kg LWt/ha annually (). With the exception of 2003–04 (Year 2), LWt production from this pasture was either intermediate (Years 5, 6 and 9) or did not differ from that measured in the lowest producing treatments (Years 3, 4, 7 and 8).
Ryegrass/white clover pastures () produced 516 (2007–08) to 841 kg LWt/ha/yr (2009–10). It was one of the highest producing pastures in 2003–04 and 2004–05 (Years 2 and 3), but was one of the lowest in Years 7–9.
Relationships between annual LWt production and DM yield
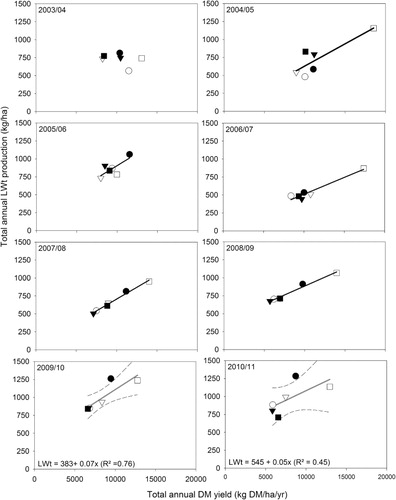
To explore the variation in year-to-year LWt production, the relationship with total annual DM yield was investigated. In Years 2–7, the relationship between annual liveweight and total annual DM yield, fitted to treatment mean data, explained only 24% of the observed variation in LWt. The form of the relationship was 385 ± 100 + 0.034 ± 0.001x. For Years 8 and 9 (2009–10 and 2010–11), when ewes with twin lambs grazed, the form of the relationship was LWt (kg/ha) = 477 ± 140 + 0.062 ± 0.017x (R2 = 0.54).
Subsequently, a grouped linear regression was fitted to determine if the poor fit of the initial regression was a function of year-to-year variation or pasture type and whether the relationship could be improved and stabilised with use of another explanatory variate. For this analysis, Year 2 (2003–04) was excluded as initial grouped regression analysis showed no relationship existed between LWt and DM yield. It is likely that this reflected management decisions as the experiment was used as a demonstration area for a conference in November 2003 and animals were removed prematurely to encourage pasture growth for the field day. Years 8 and 9 (2009–10 and 2010–11) were excluded because the change in stock class meant higher annual and spring LWt was produced owing to the greater LWt gain potential of young lambs relative to the hoggets and weaned lambs that grazed in previous years.
Pasture type failed to improve the relationship between annual LWt and DM yield but applying Year as a grouping factor increased the R2 from 0.24 to 0.85 and indicated a common slope and differing y-intercepts (). On an annual basis the slope indicated that annual LWt was produced at a rate equivalent to 5.6 ± 0.5 kg LWt per 100 kg total DM/ha produced.
Seasonality of LWt production
Averaged over 8 years, grass-based pastures produced 64.1% (CF/Bal) to 70.0% (RG/Wc) of their total annual LWt in spring. In contrast, spring accounted for 57% (P < 0.001) of total annual LWt production from the lucerne monocultures (). In summer months, lucerne produced a further 30% of annual LWt compared (P < 0.001) with the grass-based pastures where 18%–24% of annual LWt production occurred. Only 12 ± 0.5% of annual LWt production occurred in autumn (Mar–Jun). This generally followed the seasonal patterns of DM production averaged over the corresponding years. To explain differences in LWt, discussion will focus on the spring period when the majority of LWt and DM was produced. In addition, the majority of graze days in spring were associated with LWt production and the majority of maintenance grazing events occurred in summer and autumn periods.
Table 1 Percentage (%) of total annual LWt and total annual dry matter (TDM) produced, averaged1 over 8 years from 2003–04 to 2010–11, in spring, summer and autumn periods from six dryland grazed pastures at Lincoln University, Canterbury, New Zealand.
Spring
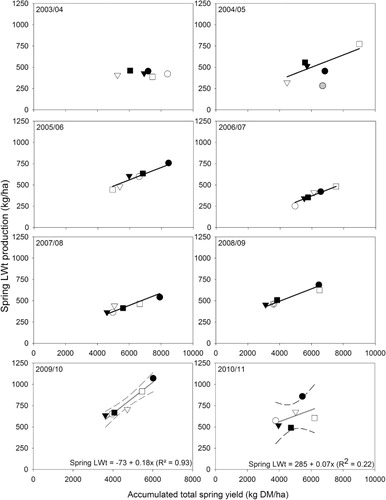
In Years 2–7, the amount of LWt produced in the spring period ranged from 252 kg/ha (CF/Bal in 2006–07) to 772 kg/ha (Luc 2004–05) (–). In Years 8 and 9, LWt ranged from 491 kg/ha (RG/Wc in 2010–11) to 1070 kg LWt/ha (CF/Sub in 2009–10). Of all pasture treatments, lucerne monocultures () were the most successful and spring LWt was greater, or similar to, the highest producing grass-based pasture in 5 years and second only to CF/Sub pastures in Year 8. In Year 9, LWt produced from CF/Cc, Luc and CF/Bal pastures was similar (619 ± 41.2 kg/ha), which was less (P < 0.001) than the 859 kg/ha produced by ewes and lambs grazing CF/Sub pastures.
The CF/Sub pastures were the most successful of the grass-based pastures for spring LWt production (). In Years 4 (2005–06), 8 (2009–10) and 9 (2010–11), spring LWt production from CF/Sub pastures exceeded (P < 0.001) that from lucerne stands. Further, in Years 2, 5, 6 and 7, the quantity of LWt produced from CF/Sub pastures in spring was similar to that from lucerne stands. In contrast, the other annual clover-based pasture, CF/Bal, was one of the least successful pastures for spring LWt production (). In 5 of the 8 years, spring LWt production from the CF/Bal pasture was one of the lowest measured. The LWt produced by CF/Wc (), CF/Cc () and RG/Wc () pastures fell into the lowest LWt producing group of treatments in spring of 4 of the 8 years.
To identify the cause of differences in spring LWt production between the pastures, differences in graze days/ha and the weighted seasonal LWt gains were investigated. In 2004–05, 2007–08 and 2008–09 (Years 3, 6 and 7), LWt was produced from a similar number of production grazing days () on each of the six pastures.
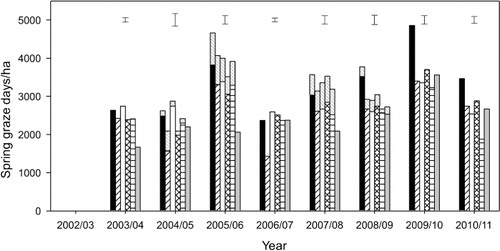
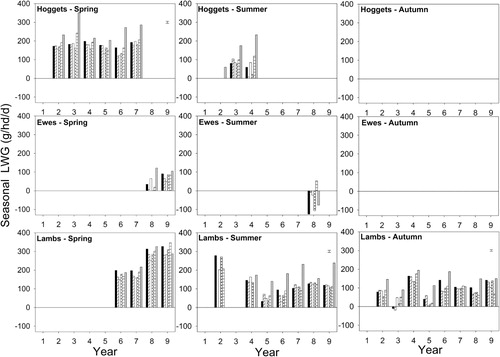
In Years 4, 5, 8 and 9, the differences in spring LWt production from the six pastures reflected differences in both production grazing days and LWt gain per head. Subsequent analysis, with year applied as a replicate, showed that between 2003–04 and 2008–09, hoggets grazing lucerne in spring (Years 2 to 7) had a weighted seasonal LWt gain of 206 g/hd/day which was 51% more (P < 0.001) than the hoggets grazing grass-based pastures, which grew at 172 ± 10.4 g/hd/day (). Thus, superior spring LWt production from Luc was predominantly a function of superior LWt gain per head.
However, for the grass-based pastures, the pattern of means separation for spring LWt production () sometimes differed from that of production graze days (). This indicated that, within an individual year, the balance between graze days and LWt gains per head contributed to differences in the total quantity of LWt produced per hectare. For example, in spring of Year 5 (2006–07), the CF/Wc and CF/Bal pastures produced similar LWt (272 ± 15.3 kg/ha). However, there were 2221 GD/ha on CF/Wc compared (P < 0.001) with 1431 GD/ha on the CF/Bal pastures. This inferred that, although not analysed, the spring hogget growth rate of 132 g/hd/d on CF/Wc pastures was lower than the 176 g/hd/d from hoggets on the CF/Bal pastures ().
Spring LWt and DM yield relationships
With year as a grouping factor (), between 2003–04 (Year 3) and 2008–09 (Year 7), under ewe hogget and weaned lamb grazing, LWt was produced at a common rate equivalent to 7.3 ± 0.68 kg per 100 kg of total DM produced (R2 = 0.87). Intercepts differed from year to year. The slope of this spring relationship was 30% higher than that determined on an annual basis ().
Spring nutritive analysis
Metabolisable energy and N% of the sown pasture components were averaged for spring harvests taken over the 8 years (). For the grasses, metabolisable energy was highest from the industry standard perennial ryegrass (11.9 MJ/kg DM) and lowest (P < 0.001) from cocksfoot in the CF/Cc pasture (11.1 MJ/kg DM). Nitrogen content of the sown grass on offer ranged (P < 0.001) from 2.9% (perennial ryegrass) to 3.4% for cocksfoot in the CF/Sub pastures.
Table 2 Metabolisable energy (kg ME/kg DM) and nitrogen concentration (%) for sown grass and sown legume components in six dryland grazed pastures at Lincoln University, Canterbury, New Zealand. Values were averaged over spring harvests between Years 2 (2003–04) and 9 (2010–11).
For the sown legumes, spring ME ranged (P < 0.001) from 11.4 MJ/kg DM from sub clover to 12.1 MJ/kg DM for white clover in the CF/Wc pastures. The N% of the clovers tended to be higher (P < 0.001) for the perennial legumes than the annual legumes in the spring period, which probably reflected the annual clovers becoming reproductive in mid/late spring with an associated change in partitioning priorities to reproductive structures. Specifically, white clover averaged 4.3 ± 0.06% N which was greater (P < 0.001) than the 4.1 ± 0.06% N for the lucerne and Caucasian clover and 13% more than the 3.8 ± 0.06% N in the sub and balansa clovers.
The spring ME and N yields are presented in . Generally, nutritive analysis was only conducted on sown pasture components. However, at some harvests in Years 8 and 9, the unsown grasses and dicot weed components in the RG/Wc pastures were bulked and sent for analysis because they represented the majority of the pasture yield. In spring, the unsown grasses had an average ME of 11.0 MJ/kg DM and 2.8% N. Broadleaf weeds had an average spring ME of 11.1 MJ/kg DM and 2.9% N. These values were used to estimate ME and N yields from these unsown components for all other grass-based pastures across all spring harvest dates over the 8 years where no other nutritive data were available. The ME and N% of the sown white clover component in CF/Wc and RG/Wc pastures were averaged and applied to the volunteer white clover component in CF/Sub, CF/Bal and CF/Cc pastures. For lucerne, ME and N yields were only calculated for the lucerne component because broadleaf weeds, unsown grasses and volunteer white clover were a minor component of the monocultures (Mills et al. Citationin press). For the six pastures, over the 7 years, ME and N yields were estimated for about 94% of total spring DM produced.
Table 3 Average metabolisable energy (GJ ME/ha) and N yield (kg N/ha) on offer to grazing stock in spring from sown pasture components plus unsown grasses, volunteer white clover and dicot weeds of five grass-based pastures and lucerne (lucerne only) at Lincoln University, Canterbury, New Zealand. Data are the average of Years 2, 3 and 5–9.
As expected, both ME (71.3 GJ/ha) and N yields (250 kg N/ha) were highest (P < 0.001) from lucerne monocultures and reflected the superior spring DM yield of the pasture. Similarly, the ME and N yields of the CF/Sub pasture were greater than those of all other grass-based pastures.
Summer
On average, lucerne produced a greater proportion of its annual LWt in summer months (c. 30%) compared (P < 0.001) with 18%–24% from grass-based pastures (). In 6 out of 8 years, LWt production from lucerne monocultures in summer (Dec–Feb) exceeded (P < 0.001) that of all grass-based pastures (). However, patterns of LWt production were inconsistent among the grass-based pastures. For example, in 2004–05 (Year 3) and 2007–08 (Year 6), LWt production from the RG/Wc pastures was similar to the highest producing grass-based pasture, but in the other 6 years it was one of the lowest producing pastures.
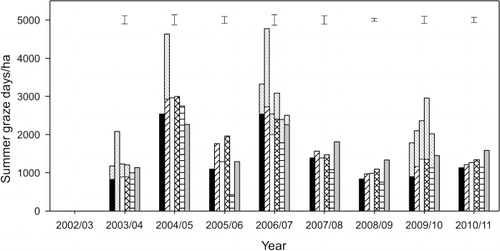
Summer LWt production differed among pastures in all 8 years (). However, in 6 out of those 8 years (Years 2, 3, 5, 6, 8 and 9) there was no effect of treatment on production grazing days per hectare (). This indicated the primary cause of differences in LWt production in the summer period could be attributed to differences in LWt gain per head () between the pastures. On average, weaned lambs grazing lucerne in the summer grew at a rate of 194 g/hd/day or 85% faster (P < 0.001) than the lambs grazing grass-based pastures (105 ± 11.8 g/hd/d). In 2005–06 and 2008–09, the differences in LWt production reflected differences in both the number of grazing days and LWt gain per head. For example, shows that in Year 4 (2005–06), summer LWt production ranged (P < 0.001) from 50 (RG/Wc) to 256 kg/ha (Luc). Of the grass pastures, the CF/Cc and CF/Bal pastures produced 109 ± 15.2 kg LWt/ha from 1859 ± 175 GD/ha (). This was 44% more (P < 0.001) graze days than from CF/Wc or lucerne treatments (1292 ± 175 GD/ha). For the cocksfoot-based pastures, the majority of the differences in LWt production appeared to be a result of low LWt gains in the early summer period by the CF/Cc and CF/Bal hoggets prior to their replacement with weaned lambs ().
Summer nutritive analysis
The average ME of the sown grass component in summer () ranged from 11.2 (CF/Cc) to (P < 0.001) 12.0 MJ/kg DM and the average grass nitrogen content was 2.7% from ryegrass and cocksfoot in the CF/Sub pasture compared (P < 0.001) with 2.4 ± 0.07% for cocksfoot established with balansa, white or Caucasian clovers. For the sown legumes, ME ranged from 10.6 for sub clover to (P < 0.001) 11.8 MJ/kg DM for white clover in the RG/Wc pasture. The N content was 3.1% for balansa clover compared (P < 0.001) with 3.7 ± 0.15% for perennial legumes and 4.4% N for sub clover. In summer, broadleaf weeds in the RG/Wc pastures, averaged over available samples, had 2.6% N and 10.6 MJ ME/kg DM and unsown weed grasses had 2.0% N and 10.4 MJ ME/kg DM.
Table 4 Metabolisable energy (kg ME/kg DM) and nitrogen concentration (%) in summer for sown grass and sown legume components in six dryland grazed pastures at Lincoln University, Canterbury, New Zealand. Values were averaged over summer harvests between Years 2 (2003–04) and 9 (2010–11).
Neither ME nor N yields were calculated for the summer period as it was not possible to partition the DM on offer between maintenance and production grazing events. This would confound explanations because monthly cage cuts occurred independently of grazing events.
Autumn
In autumn, 12 ± 0.47% of annual LWt production occurred and this was similar for all six pastures (). The quantity of LWt produced was variable and ranged from a loss of –31.1 ± 5.11 kg LWt/ha from stock grazing CF/Sub and CF/Bal pastures in 2004–05, to a maximum gain of about 290 kg/ha on lucerne monocultures in 2003–04 and CF/Sub pastures in 2010–11 (). No obvious pattern to autumn LWt production from the pasture treatments emerged over time. Lucerne monocultures produced more, or similar, LWt to the highest producing treatment in 4 of the 8 years (2006–07, 2007–08, 2009–10 and 2010–11). Averaged over 8 years it emerged that weaned lambs grazing lucerne grew at 134 g/hd/day which was 61% faster (P < 0.001) than the 83 ± 9.0 g/hd/day from lambs grazing grass-based pastures ().
In 2008–09, autumn LWt () was similar for all six pastures (130 ± 8.2 kg LWt/ha). This was produced from 1284.0 ± 79.3 GD/ha () which was also similar for all six pastures and inferred autumn LWt gain per head was also similar among the pastures (). In contrast, autumn LWt production differed between the pastures in 2006–07 and 2007–08 () but there were a similar number of production grazing days on each of the six pastures (). This indicated that these differences in LWt production were solely a result of differences in the LWt gains per head ().
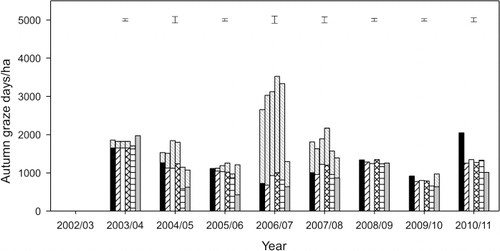
In 2003–04, 2004–05, 2005–06, 2009–10 and 2010–11, the observed differences in autumn LWt production () could not be explained by differences in production grazing days alone because the patterns of means separation differed from that of LWt production. For example, in 2009–10, there were 645 ± 58.8 production graze days/ha on both the Luc and RG/Wc pastures () which resulted in 94 kg LWt/ha from lucerne which was more (P < 0.001) than the 39 kg LWt ha from the RG/Wc pasture (). Consequently, the difference between these two treatments was because lambs grazing lucerne grew at 149 g/hd/day compared with only 60 g/hd/day on the RG/Wc pastures (). In contrast, the CF/Sub pastures produced 93 kg LWt/ha (), which was similar to lucerne LWt production, but there were 40% fewer (P < 0.001) production grazing days on lucerne () than on the CF/Sub pasture (914 GD/ha). This indicated that the lucerne lambs grew faster (149 g/hd/d) than the CF/Sub lambs (101 g/hd/d) () but similar LWt was produced because there were more production graze days on the CF/Sub pastures compared with the lucerne monoculture.
Over the 8 years, the majority of maintenance grazing events occurred in the autumn period ().
Discussion
Relationships between LWt production and pasture yield
The results of the LWt production data were supported by the superior DM production reported in the previous paper (Mills et al. Citationin press). In Years 3 (2004–05) to 7 (2008–09), under the hogget/weaned lamb grazing system, strong relationships between annual LWt and total annual DM yield showed that 5.6 ± 0.5 kg LWt was produced for every 100 kg DM/ha grown (). Thus, on an annual basis, the superior total DM yields from lucerne in most years translated into the production of more LWt. The relationship between LWt production and DM yields in spring showed that 7.3 ± 0.68 kg LWt was produced from every 100 kg of total DM (). This was interesting for two main reasons. First, the rate was about 30% higher than that determined on an annual basis () which was influenced by allocation of feed to maintenance grazing events in summer and autumn, and second, because ME and N% of the herbage in spring () was generally higher than that in summer () and autumn (not shown).
In Years 3, 6 and 7, there were a similar number of production grazing days on each of the pastures (). Consequently, observed differences in spring LWt in each of these years reflected differences in LWt gain per head (), but these data were unable to be analysed within individual years because sheep treatment groups were unreplicated. In Years 4, 5, 8 and 9, both grazing days () and differences in LWt gains per head () contributed to differences in spring LWt production (). This conclusion can be made on the basis that the pattern of means separation of spring LWt production differed from the pattern of means separation of the treatments in the analysis of grazing days. This indicated that grazing days alone were not responsible for LWt differences and that LWt gains per head differed among treatments. Similarly, in autumn of 2003–04, 2004–05, 2005–06, 2009–10 and 2010–11, differences in LWt production () could not be solely attributed to differences in the number of production grazing days on the pasture treatments. This indicated that both grazing days () and differences in LWt gain per head () within a given year contributed to the differences in LWt produced from the six pastures in autumn of most years.
The benefit of the CF/Sub clover pasture for spring LWt production was also demonstrated (). In 7 of the 8 years, LWt production from the CF/Sub pasture was greater than or similar to, that from a lucerne monoculture in the spring period (). This reflected an earlier start to grazing (c. 3 weeks) on the grass-based pastures compared with lucerne, where grazing is not initiated until the first paddock reaches 15–20 cm in height (Moot et al. Citation2003). This meant there were more grazing days per hectare () on grass pastures even when LWt gains per head () were lower than those from animals grazing lucerne. However, the CF/Sub pastures also had high spring DM yields relative to other grass pastures in most years () which meant that, although stocked at similar rates, the CF/Sub pasture was grazed for a longer duration (days) resulting in more grazing days () compared with the lower-yielding grass pastures. Similarly, in Hawkes Bay, Thomson & Muir (Citation2009) reported annual ryegrass pastures produced more DM in spring than perennial ryegrass. This meant that although LWt gain per head was lower from animals grazing annual ryegrass, the LWt production per hectare was superior because annual ryegrass pastures supported a higher stocking rate than perennial ryegrass.
A range of alternative relationships were also investigated to try to explain observed variation for both spring and annual LWt production. These included total clover yield, fraction of clover, ME yield and N yield. Both year and pasture type were applied as grouping factors to improve the explanations annually and for the critical spring period. The R2 of these evaluations ranged from 0.09 to 0.63 and indicated none of the relationships tested could exceed the variation simply explained using total DM yield. Further, in some cases, negative relationships were found (e.g. spring LWt vs spring N yield in 2003–04) or no relationship (e.g. in 2003–04 and 2010–11 ME yields increased from 20 to >60 GJ ME/ha but this did not translate to increased spring LWt production). Neither of these situations was biologically sensible and indicated the explanatory variate was inappropriate for these data. For summer and autumn, relationships could not be explored as there was no way to partition the DM, ME or N yield data between grazing events associated with maintenance vs production LWt periods.
There were several reasons that these alternative explanatory variates were less capable of explaining LWt variations. In this case, we believe it may reflect the methodology. Specifically, exclosure cage yields and composition probably differed from the quantity and quality of feed selected and consumed by grazing sheep. It is well documented that sheep prefer a legume dominant diet when given the choice (Parsons et al. Citation1994; Cosgrove et al. Citation2002). It is likely, if data on the quantity and quality of consumed feed were available, explanatory relationships may have been more successful.
Liveweight production
Over an 8-year period, lucerne proved to have superior LWt production () compared with all grass-based pastures and produced total accumulated LWt of 7940 kg/ha over the 8 years of measurement. The majority of annual LWt was produced from grazing events in spring (57%), but summer LWt production (30%) was where the additional benefit of lucerne in the system was expressed relative to the grass-based pastures. On an annual basis, there were generally fewer grazing days on lucerne than the grass-based pasture but the livestock generally had high LWt gains per head (). This was the basis for the superior summer LWt production from lucerne swards, as in 6 out of 8 years, the number of liveweight production grazing days () did not differ between the six treatments. Optimal lucerne grazing management meant the absolute duration (days) of grazing events throughout the year did not exceed 5–7 days on any individual paddock. This is necessary to prevent grazing animals damaging or eating shoots forming from the basal buds at the crown which are the start of canopy development and yield formation for the next rotation (Teixeira et al. Citation2007).
Commercial farms do not allocate the entire grazing area to lucerne as its strict management requirements mean spring grazing should not be initiated before the lucerne reaches 15–20 cm height in the first paddock to be rotationally grazed (Moot et al. Citation2003). In this environment, lucerne grazing was initiated in about mid-September. On average, grazing began on the grass-based pastures almost 3 weeks earlier, which corresponded to the start of the main period of lambing (late August) in lowland mid-Canterbury. Thus a persistent, high-quality, grass-based pasture complements lucerne and offers the opportunity to enhance the overall sustainability of the grazing system by providing high-quality feed in sufficient quantities during the first 3 weeks of lactation when demand on the ewe is high.
The superior clover content in the CF/Sub pastures (Mills et al. Citationin press), particularly in spring, translated to a higher N% in the cocksfoot component of the CF/Sub pasture (). Nitrogen fertility has been shown previously to improve grazing preference by sheep in cocksfoot (Edwards et al. Citation1993) and ryegrass (Cosgrove et al. Citation2002) pastures. The superior spring DM yields in most years (), compared with the other grass-based pastures, also translated to higher ME and N yields (). For grass pastures, almost two thirds of annual LWt was produced in spring (see ‘Spring LWt and DM yield relationships’). This overcame lower ME of the cocksfoot compared with perennial ryegrass and lower N% of the sub clover relative to white clover () and indicated that the main driver to LWt production was total DM yield.
Liveweight production from the industry standard RG/Wc pastures was higher than expected () given the previously documented loss of sown species from the pasture over time (Mills et al. Citationin press). This showed the sown species declined at 10% per annum and were replaced with unsown grasses and broadleaf weed species. However, the LWt production from RG/Wc pastures remained at levels that were comparable to the lower LWt and DM producing cocksfoot-based pastures. Nutritive data indicated that, for the unsown grasses and broadleaf weeds in spring, the ME was comparable to that determined for cocksfoot and the N% was comparable to that of the perennial ryegrass component (see ‘Spring nutritive analysis’). Consequently, the reduction in LWt produced over time could not be attributed purely to a reduction in total DM yield from sown pasture components or lower nutritive value of unimproved invading species. However, in summer, the nutritional value of the unsown annual grasses and broadleaf weeds in the RG/Wc pasture was inferior to that of the originally sown pasture species (see ‘Summer nutritive analysis’) and generally the RG/Wc pastures supported fewer grazing days than the cocksfoot pastures ().
For the cocksfoot pastures established with balansa, Caucasian or white clovers, LWt production () and DM yields (, ) tended to be less than those from the CF/Sub pasture over time. The lower yields compared with CF/Sub pastures translated into fewer grazing days per hectare particularly in the spring period ().
Mechanisms of DM productivity for LWt production
Previously, we showed the rate of spring DM production was strongly related to clover content. Specifically, in spring prior to the onset of water stress, total DM yield of grass pastures increased by 1.0 kg DM/ha/°Cd for every 1 t clover produced per hectare (Mills et al. Citationin press). Increased clover content results in a greater potential for N transfer to the companion grass through plant decomposition and urine returns. This was observed for the cocksfoot in the CF/Sub pastures in spring compared with other sown grasses (). As N availability to the grass increases, N deficiency symptoms are alleviated and DM yield increases through (1) an increased rate of photosynthesis (Peri et al. Citation2002)Citation; (2) a more efficient use of water during non-water stressed growth periods (Moot et al. Citation2008; Mills et al. Citation2009; Black & Murdoch Citation2013); and (3) increased grazing preference for the grass (Edwards et al. Citation1993).
However, this will not reduce grazing pressure on the clover component. Cosgrove et al. (Citation2002) found that, when given a choice, both sheep and cattle spent 75% of their time grazing clover regardless of the N status of the grass on offer. When only offered a choice of high or low N concentration grass, both sheep and cattle spent >75% of time grazing on the higher N grass pastures. This would be the situation in summer and autumn for pastures containing annual clovers whose lifecycle had finished. In contrast, pastures with summer active perennial clovers would be subjected to preferential grazing pressure throughout the year. In Southland, Brown (Citation1990) previously reported that white clover quality could not compensate for low clover yields in pastoral systems. Consequently, maintaining clover content within a pasture is critical to creating a productive sward to optimise animal production.
Numerous authors have reported that alleviating N deficiency has a greater impact on increasing annual DM production than applying irrigation alone to alleviate water stress conditions (e.g. Peri et al. Citation2002; Mills et al. Citation2009; Black & Murdoch Citation2013). Further, the efficiency of water use in the production of DM has also been shown to decline in N deficient pastures (Mills Citation2007; Moot et al. Citation2008; Black & Murdoch Citation2013). Mills et al. (Citation2009) reported that when water was non-limiting, which is similar to the situation expected in spring for dryland pasture systems, an N-deficient cocksfoot sward produced less than half the DM yield of cocksfoot supplied with adequate N. Both pastures intercepted a comparable amount of photosynthetically active radiation but radiation use efficiency was halved by N deficiency. Consequently, while the pastures used a similar quantity of water for growth, the captured light energy was used less efficiently in the production of DM by the N-deficient pasture.
Thus, although N yield was unable to explain as much variation in LWt production as total DM yield, the nitrogen dynamics underlie the LWt production, competitive ability of the improved pasture components and, therefore, the financial viability of the dryland pastoral system. Increased clover content translated to increased spring DM yields and metabolisable energy () available for grazing livestock in spring, particularly for the lucerne and cocksfoot/sub clover pastures. During this period, when commercial dryland properties focus on finishing priority stock (lambs) to generate farm income while air temperatures increase and soil moisture remains non-limiting, swards with high legume content have the highest rates of spring DM production. This explains the higher LWt production from the lucerne and cocksfoot/subterranean clover pastures over nine growth seasons and 8 years of LWt production measurements.
Pasture improvement vs pasture renewal
The improved persistence of the cocksfoot-based pastures, compared with RG/Wc, offered an opportunity for improvement by oversowing subterranean clover into the remaining cocksfoot to enhance animal LWt production. After 9 years, these cocksfoot-based swards contained c. 60% of the originally sown species (Mills et al. Citationin press). Thus, for these cocksfoot pastures, LWt production could be improved by overdrilling subterranean clover. This would have a lower financial cost than having to enter a full 1–2 year pasture renewal phase. Previously, at Ashley Dene in Canterbury on a shallow and stony soil, subterranean clover was successfully overdrilled into a 3.5-year-old cocksfoot or ryegrass dominant dryland pasture and increased total annual yield by 40% (Ates et al. Citation2010). The ‘MaxClover’ experiment received 450–780 mm rainfall annually (Mills et al. Citationin press). Thus, for pastures grown in comparable environments with a similar temporal rainfall distribution, we would recommend autumn oversowing into a hard-grazed, grass-dominant pasture (600 kg DM/ha post-grazing residual) with a mix of 5 kg/ha each of a mid- and a late-flowering subterranean clover cultivar. This would allow the sub clovers to set seed for regeneration while buffering for year-to-year variation in rainfall. The addition of 1 kg/ha of white clover as a secondary clover component would offer opportunity for clover growth years with wetter than average summers. In contrast, the RG/Wc pasture had deteriorated beyond the point of salvage and would require full pasture renewal to allow adequate weed control. Given the extent of the weed load present at Year 9, the cost of renewal would be higher than that for oversowing a cocksfoot sward, as weed control would require a greater financial investment relative to renewing a run-out cocksfoot sward. Commercially, the RG/Wc pasture should probably have been renewed 4–5 years after sowing (Mills et al. Citationin press). Even then, the loss of ryegrass and white clover would have meant renewal was required rather than oversowing.
Dryland farming systems
This research has shown that spring is the critical period for profit in dryland farming systems on the east coast of New Zealand. The annual rainfalls were variable and ranged from 480–780 mm/yr at this site. The periodic water stress conditions in summer/autumn meant that even when rainfall was in theory within an acceptable range for RG/Wc pasture, exposure to prior water stress compromised subsequent LWt production and overall pasture persistence. However, this pattern of deterioration did not become evident until after Year 3 and shows the importance of long-term studies when recommendations are made to farmers who expect at least 10 years from their pastures before renewal.
Here, in Years 2–7, Coopworth ewe hoggets and weaned lambs were used for grazing. This was for simplicity of management and was suitable to determine the differences in potential LWt production from the six pastures evaluated. However, the use of ewes with twin lambs in spring in Years 8 and 9 gave insight into the potential production from commercial properties and was about 30% higher annually than that recorded in Years 2–7. This reflected the difference in potential LWt gain between different classes of stock.
In 2009–10 and 2010–11 (Years 8 and 9), twin lambs at foot grew at 251 (CF/Wc) to 348 g/hd/d (RG/Wc). These pastures were grazed for approximately the same duration, but the RG/Wc pastures supported 35%–50% fewer livestock than the other dryland pastures and consequently had fewer spring grazing days (). Comparisons with other published LWt production data are difficult because of differences in stocking rates and energy requirements which differ in sex, breed and initial LWt. However, at Ashley Dene, Canterbury, twin lambs at foot grazing dryland CF/Sub pastures showed that stocking rate affected lamb liveweight gains per head (Ates et al. Citation2008). Lambs achieved >325 g/hd/d in spring when stocked at 8.3 ewes/ha plus twin lambs. This was 29%–35% faster than pastures stocked at 13.9 ewes/ha plus twin lambs. Although lamb LWt gain per head was superior at the lower stocking rate, the LWt production per hectare was 33% less than from the high stocking rate. The water holding capacity of this shallow stony soil means pasture growth rates are restricted by about mid-November in most years compared with the ‘MaxClover’ site where the deeper silt loam soil allows growth to continue through to late November/early December in most years. Muir et al. (Citation2003) also previously documented high lamb growth rates for singles, twins and triplets (380–437 g/hd/d) in the 12 weeks following birth. However, production per hectare was not reported and could not be calculated. It is likely that feed allowances were high and reflected a low stocking rate given the 13 kg/hd increase in ewe LWt between pre-joining and 12 weeks post-lambing.
On an irrigated site, adjacent to the ‘MaxClover’ experiment with similar soil, Black et al. (Citation2007) reported weaned ewe lambs and ewe hoggets gained between 150 and 175 g/hd/d on irrigated ryegrass pastures which, annually, contained 11% white to 19% Caucasian clover in the pre-graze pastures. Based on their data, where all grazing was associated with LWt production, the dryland ‘MaxClover’ grazing experiment had about 20% fewer total graze days and 32% fewer production graze days annually. This shows (1) the impact of water stress on the potential for LWt production as pasture growth declines when the soil dries and (2) differences that resulted from the need for maintenance grazing events, primarily associated with sward management, and ensuring pasture quality by removing dead and reproductive material in preparation for LWt production periods.
Conclusions
Strong relationships existed between sheep LWt production and total DM yield, both on an annual basis and in the spring period when the majority of LWt and DM production occurred. In spring, all pastures produced 7.3 ± 0.68 kg LWt/ha for every 100 kg DM/ha produced under ewe hogget grazing in 5 out of 6 years.
Over 8 years (Years 2–9), the accumulated sheep LWt produced from lucerne monocultures was 7940 kg LWt/ha and was 9%–41% more than produced from grass/clover pastures.
Of the grass pastures, the cocksfoot/subterranean clover pasture produced 7270 kg LWt/ha over 8 years which was 28% more than all other grass-based pastures and only 9% less than from lucerne monocultures.
In most years, spring LWt production from the cocksfoot/subterranean clover pastures was greater than, or similar to, that from the lucerne monoculture. Both LWt gain/hd and more spring grazing days per hectare contributed to this result.
Acknowledgements
The authors acknowledge financial assistance from Beef + Lamb NZ, AGMARDT, the Cocksfoot Growers Association, Sinclair Cummings Trust and Lincoln University. Technical and management assistance were provided by Malcolm Smith and Dr Keith Pollock.
References
- Ates S, Lucas RJ, Edwards GR 2008. Pasture production and liveweight gain from cocksfoot-subterranean clover pastures grazed at two stocking rates and closed at different times during spring. Proceedings of the New Zealand Grassland Association 70: 225–232.
- Ates S, Tongel MO, Moot DJ 2010. Annual herbage production increased 40% when subterranean clover was over-drilled into grass-dominant dryland pastures. Proceedings of the New Zealand Grassland Association 72: 3–9.
- Black AD, Lucas RJ, Moot DJ, Sedcole JR 2007. Liveweight gains of lambs from Caucasian clover/ryegrass and white clover/ryegrass swards on soils of high and low fertility. Grass and Forage Science 62: 225–238.
- Black AD, Murdoch HM 2013. Yield and water use of a ryegrass/white clover sward under different nitrogen and irrigation regimes. Proceedings of the New Zealand Grassland Association 75: 157–164.
- Brown C 1990. An integrated herbage system for Southland and South Otago. Proceedings of the New Zealand Grassland Association 52: 119–122.
- Brown HE, Moot DJ, Lucas RJ, Smith M 2006. Sub clover, cocksfoot and Lucerne combine to improve dryland stock production. Proceedings of the New Zealand Grassland Association 68: 109–115.
- Cosgrove GP, Anderson CB, Parsons AJ, Brock JL, Tilbrook JC 2002. Can nitrogen-fertilised ryegrass substitute for white clover? Proceedings of the New Zealand Grassland Association 64: 205–209.
- Edwards GR, Lucas RJ, Johnston MR 1993. Grazing preference for pasture species by sheep is affected by endophyte and nitrogen fertility. Proceedings of the New Zealand Grassland Association 55: 137–141.
- Mills A 2007. Understanding constraints to cocksfoot (Dactylis glomerata L.) based pasture production. PhD thesis. Canterbury, Lincoln University. http://researcharchive.lincoln.ac.nz/handle/10182/32 ( accessed 14 January 2014).
- Mills A, Lucas RJ, Moot DJ in press. ‘MaxClover’ grazing experiment I: annual yields, botanical composition and growth rates of six dryland pastures over nine years. Grass and Forage Science. doi:10.1111/gfs.12132.
- Mills A, Moot DJ, Jamieson PD 2009. Quantifying the effect of nitrogen of productivity of cocksfoot (Dactylis glomerata L.) pastures. European Journal of Agronomy 30: 63–69.
- Ministry for Primary Industries (MPI) 2014. Livestock slaughter statistics. http://www.mpi.govt.nz/news-resources/statistics-forecasting/livestock-slaughter-statistics ( accessed 3 September 2014).
- Moot DJ, Brown HE, Teixeira EI, Pollock KM 2003. Crop growth and development affect seasonal priorities for lucerne management. In: Moot DJ ed. Legumes for Dryland Pastures Proceedings of a New Zealand Grassland Association Inc Symposium held at Lincoln University, 18–19 November 2003. Christchurch, New Zealand Grassland Association. Pp 201–208.
- Moot DJ, Brown HE, Pollock K, Mills A 2008. Yield and water use of temperate pastures in summer dry environments. Proceedings of the New Zealand Grassland Association 70: 51–57.
- Muir PD, Smith NN, Lane JC 2003. Maximising lamb growth rate – just what is possible in a high performance system. Proceedings of the New Zealand Grassland Association 65: 61–63.
- Nicol AM, Brookes, IM 2007. The metabolisable energy requirements of grazing livestock. In: Rattray PV, Brookes IM, Nicol AM eds. Pasture and Supplements for Grazing Animals. Occasional Publication No. 14. Christchurch, New Zealand Society of Animal Production (Inc.). Pp. 151–172.
- Parsons AJ, Newman JA, Penning PD, Harvet A, Orr RJ 1994. Diet preference of sheep: effects of recent diet, physiological state and species abundance. Journal of Animal Ecology 63: 465–478.
- Peri PL, Moot DJ, McNeil DL, Varella AC, Lucas RJ 2002. Modelling net photosynthetic rate of field-grown cocksfoot leaves under different nitrogen, water and temperature regimes. Grass and Forage Science 57: 61–71.
- Rickard DS, Radcliffe JE 1976. Seasonal distribution of pasture production in New Zealand. XII. Winchmore, Canterbury Plains dryland and irrigated pastures. New Zealand Journal of Experimental Agriculture 4: 329–335.
- Salinger J 2003. Climate reality – actual and expected. In: Moot DJ ed. Legumes for dryland pastures. Proceedings of a Symposium held at Lincoln University, 18–19 November 2003. Grassland Research and Practice Series No. 11. Wellington, New Zealand Grassland Association. Pp. 13–18.
- Teixeira, EI, Moot DJ, Brown, HE, Pollock KM 2007. How does defoliation management impact on yield, canopy forming processes and light interception of lucerne (Medicago sativa L.) crops? European Journal of Agronomy 27: 154–164.
- Thomson, BC, Muir PD 2009. Lamb growth rate on annual and perennial ryegrasses. Proceedings of the New Zealand Grassland Association 71: 207–210.