
Abstract
Potential losses of nitrogen (N) from land application of effluents include ammonia (NH3) and nitrous oxide (N2O) emissions. In this review paper, the extent of the NH3 and N2O losses resulting from application of effluents to pastoral soils is assessed. Nitrogen losses, as NH3 and N2O, from applied effluent to pastoral soil ranged from 1%–66% and <0.1%–6% of the applied N, respectively. The potential mitigation methods include: reducing livestock numbers; lowering N content of the effluent; using N process inhibitors; optimising timing of effluent application; and applying effluent at rates that match plant uptake. It is important to remember that some of these options can result in ‘pollution swapping’ and some of them are in the early stages of development. Future research needs to focus on the overall impact of mitigation options on the whole suite of gaseous emissions and the practicality of those options.
Introduction
One of the challenges facing the dairy industry is to optimise a proven effluent management system that can increase nutrient use efficiency and minimise off-farm environmental impacts. Increased animal numbers, greater use of nitrogen (N) fertilisers and higher supplementary feed inputs on dairy farms have markedly changed the volume and types of effluent produced. Different types of effluent (e.g. liquid, solid, fresh or stored manure) with differing concentrations of solids and nutrients are derived from different animal and effluent management systems (Rotz Citation2004). The effluent produced on farms by off-paddock systems can be classified as farm dairy effluent (FDE), slurries or manures, depending on their solid or dry matter (DM) content (Chadwick et al. Citation2000; Rotz Citation2004). Liquid products with a DM content <5%, which are usually derived from the farm dairy milking parlour and associated yards, are termed FDE. Slurries have a DM content of 5%–15% while solid manures contain >15% DM (Longhurst et al. Citation2012). Both slurries and solid manures are typically derived from animal standoff and housing areas or from effluent solid separation. In this review paper, the general term ‘effluent’ is used to cover all the effluent types. Otherwise, the terms FDE, slurry or manure are used specifically. All these farm effluents contain quantities of valuable plant nutrients that, if correctly applied to land, can improve soil fertility and increase the sustainability of farming systems (Spiehs et al. Citation2010; Li et al. Citation2014b).
Environmental concerns from effluent application encompass all aspects of non-point source pollution including air quality (Luo et al. Citation2008; Gerber et al. Citation2013). Ammonia volatilisation occurs through the ammonification process and depends on the environmental conditions at the time of effluent application. Nitrous oxide gas is formed in soils through the microbiological processes of nitrification and denitrification. Nitrous oxide production by nitrifying bacteria may arise either during ammonium (NH4 +) oxidation to nitrite (NO2 −) or during dissimilatory NO2 − reduction when the oxygen (O2) supply is limited (Saggar et al. Citation2011; Akiyama et al. Citation2013; Li et al. Citation2014b). The complex interactions between soil properties, climatic factors and agricultural practices all affect the extent of these gaseous emissions (Saggar et al. Citation2013). An understanding of the NH3 and N2O emissions from land application of effluents and the development of technologies and strategies to mitigate these emissions is required to reduce nutrient losses and improve nutrient use efficiencies.
This review will investigate the scientific literature regarding NH3 and N2O production from effluent application to pastures, the factors controlling these emissions and the major management options available for reducing these losses. The aim is to provide an overview of present knowledge, assess how this information can be used to improve the estimates of emissions from effluent application to pasture and to discuss good practices for reducing these losses.
Ammonia and nitrous oxide emissions from land application of effluent
Ammonia volatilisation
Fresh FDE (containing fresh urine, faeces and washing water) is commonly applied on New Zealand dairy farms. Most urea in effluent is likely to have been hydrolysed to NH4 + before application to soil; however, depending on duration of effluent collection and storage, some urea may still remain in applied effluent. Early studies by MacGregor et al. (Citation1979) and O'Toole (Citation1996) suggested that FDE may contain between 3 and 140 mg urea-N L–1. Urea either in stored or applied FDE is usually rapidly hydrolysed within 1–2 days by urease. This enzyme catalyses the hydrolysis of urea to NH4 + and carbamate ions, which decompose to carbon dioxide (CO2) and NH3 (Cameron et al. Citation2013) (Equation 1).
Ammonia volatilisation occurs as the NH4 +-N in the applied effluent or soil solution is converted to NH3 gas, which is subsequently transferred from the soil to the atmosphere (Zaman et al. Citation2008; Li et al. Citation2014a).
Ammonia volatilisation patterns and amounts vary greatly. Li et al. (Citation2014a) found that 80% of the total NH3 volatilisation occurred within the first 5 days of the effluent application, and peaks of the NH3 fluxes from all types of effluent occurred within 24 hours. Other researchers have found a similar pattern (e.g. Meisinger & Jokela Citation2000; Sherlock et al. Citation2002; Panetta et al. Citation2005; Rochette et al. Citation2009; Salazar et al. Citation2014). It has been reported that 1%–66% of applied effluent N is lost as NH3 (e.g. Sherlock et al. Citation2002; Petersen & Sommer Citation2011; Li et al. Citation2014b), depending on form and DM content of applied effluent, application method, soil and environmental factors.
Nitrous oxide emission
Nitrous oxide gas is formed in soils through the microbiological processes of nitrification (Equation 2) and denitrification (Equation 3) (Schils et al. Citation2013).
Nitrification is the biological oxidation of soil NH4 + to soil NO2 − and NO3 −, producing N2O as a by-product (Saggar et al. Citation2013). Denitrification is the stepwise biological reduction of soil NO3 − to gaseous N compounds, with N2O and nitrogen gas (N2) being the main products. The ratio of N2O/N2 produced during denitrification in soil is affected by the presence of NO3 −, the level of anoxia, pH, temperature, soluble carbon (C) availability and microbial populations (Saggar et al. Citation2013).
Nitrous oxide emissions are highly dynamic and affected by effluent application time, application method and rainfall or irrigation. Several researchers have found that N2O emissions peak immediately after application (e.g. Barton & Schipper Citation2001; Saggar et al. Citation2004; Bhandral et al. Citation2009; Sistani et al. Citation2010; Li et al. Citation2014b). One possible reason is that liquid from the effluent drives out air trapped in the soil which could contain high levels of N2O. Schils et al. (Citation2013) suggested that N2O loss increased immediately after liquid manure injection and was followed by a shift to N2 emissions. Other studies have shown highly variable patterns of N2O peak response after effluent application. Whalen et al. (Citation2000) and Sommer & Hutchings (Citation2001) observed that the emissions did not peak until 30 hours after cattle slurry application, although emission peaks were observed much earlier (after 8 hours) during second and third applications. Studies have shown peak emissions 1–7 days after cow manure application (Sherlock et al. Citation2002). Emissions from applied effluent generally reach the background level within 60 days depending on application rate and climatic conditions (e.g. Luo et al. Citation2008; Bhandral et al. Citation2009; Thomsen et al. Citation2010; Li et al. Citation2014b). A large range of N2O emission factors (percentage of applied N lost as N2O) have been reported after the application of effluent to land, ranging from <0.1%–6% (e.g. Bhandral et al. Citation2004; Luo et al. Citation2008; Chadwick et al. Citation2011; Li et al. Citation2014b).
Factors affecting ammonia and nitrous oxide emissions
Understanding the factors that affect NH3 and N2O emissions will delineate practices to reduce NH3 and N2O losses, improve the prediction of these losses, and aid in developing more efficient farm nutrient management plans. Both NH3 and N2O emissions are reported to be influenced by effluent characteristics, a number of soil factors and environmental conditions and application managements, as described below. Data found in a search of the literature related to dairy effluent application to pastures were summarised. However, data which we believe have been compromised by variables outside the trial design were excluded.
Effluent characteristics
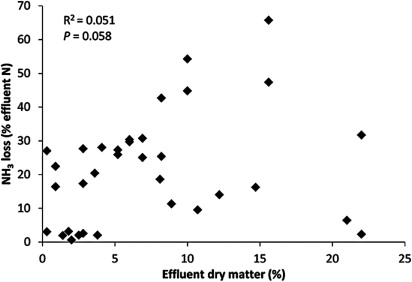
The effluent DM concentration is an important factor that affects NH3 emissions from effluent applications (e.g. Smith & Chambers Citation1995; Li et al. Citation2014a). The general observation is that as DM increases, the NH3 losses (percentage of applied N lost as NH3) increase (). This is likely to be due to the fact that an effluent with higher DM remains on the soil surface, providing increased opportunity for NH3 contained within the effluent to volatilise to the atmosphere. Conversely, an effluent with lower DM tends to have greater fluidity and, therefore, infiltrates more readily into the soil where NH4 + is protected from volatilisation by adsorption on to soil colloids. Another potential reason is that when the effluent infiltrates into the soil, NH4 + is nitrified to NO3 − more readily due to the higher nitrification rates deeper in the soil than on the surface. However, combined data from the literature do not indicate a significant relationship between NH3 loss and effluent DM concentration (P > 0.05) (). This is due to other effluent and soil factors that may have influenced the effect of effluent DM on NH3 losses.
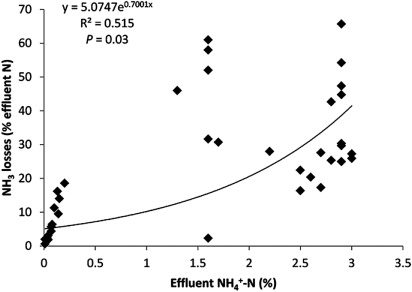
The amount of mineral-N contained within different effluents depends on the type of effluent, storage duration and how it has been managed during this time (Rotz Citation2004). The rate and amount of NH3 loss can be directly related to concentrations of NH4 +-N in the applied effluent (e.g. Rochette et al. Citation2009; Li et al. Citation2014b). Analysis of data from the literature reveals that there is a significant exponential relationship between NH3 loss and effluent NH4 +-N concentration in effluents (R2 = 0.515, P < 0.05) ().
Some other factors, such as pH and effluent C concentration, also affect NH3 emissions. Meisinger & Jokela (Citation2000) found that lowering the effluent pH below 7 before it is applied can decrease NH3 volatilisation. This is because the equilibrium between NH3 and NH4 + is affected by pH, with more N in the gaseous NH3 form at higher pH. There is little information in the literature describing the effect of effluent C on NH3 emissions. However, it is likely that a high effluent C concentration would lead to immobilisation of N and therefore less availability of NH3 for volatilisation. This effect may be obscured by other factors such as the fact that a high C effluent is also likely to have a higher NH4 + content.
Effluent characteristics, such as C, N and DM, can all affect N2O emissions and, potentially, emission factors. As discussed in the following paragraphs, data can be found in the literature that imply relationships between N2O emission factors and individual effluent components (–); however, there are no reports of studies where one factor in the applied effluent is altered, but all other factors remain constant. Therefore, these relationships need to be interpreted with caution.
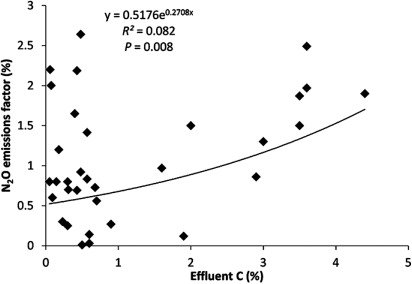
Addition of effluent C to soil not only stimulates microbial growth and respiration but also provides the organic C needed by the soil denitrifiers (Cameron et al. Citation2013). Pelster et al. (Citation2012) suggested that the greater C content of dairy effluents is the reason for the larger N2O emissions when compared with pig manure. Barton & Schipper (Citation2001) also suggested that higher N2O emissions from dairy effluent than from inorganic N fertiliser were due to enhanced denitrification activity by increasing C availability and/or by decreasing soil aeration following increased respiration. Analysis of the data from the literature suggests that there is a significant exponential relationship between N2O emission factors and effluent C concentration (R2 = 0.082, P < 0.05) (). The increase may not be entirely due to increasing C content, as there is typically a corresponding increase in total N. Thus, the increase in emission factors may be due to other factors associated with the effluent C increase.
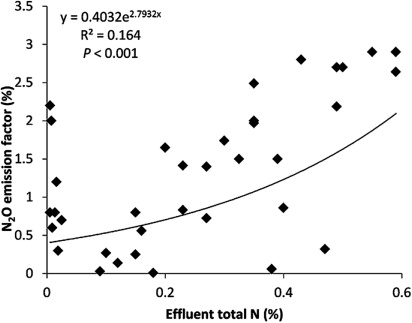
The availability of NO3 − for denitrifying bacteria is the first step in biological denitrification, and the denitrification rate and N2O emission would therefore be expected to depend on effluent N concentration. The trend is that higher effluent total N concentrations would lead to higher N2O emissions. An increase in N2O emissions due to an increase in N concentration (and therefore an increase in N load on to soil) may not affect N2O emission factors. However, analysis of the data from the literature implies that there is a significant exponential relationship between N2O emission factors and effluent total N concentrations (R2 = 0.164, P < 0.001) (). This increase in N concentration is likely to correspond with increases in other components which could also affect emission factors.
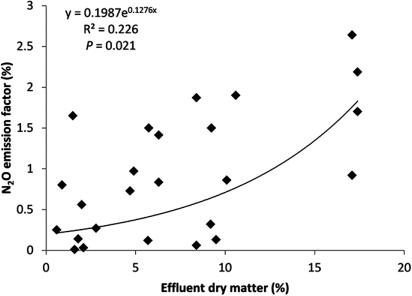
Other effluent properties, such as DM content, could also affect the value of the N2O emission factor. Data from the literature suggest that higher effluent DM content generally leads to higher N2O emission factors (R2 = 0.226, P < 0.05) (). These effects may be obscured by other factors such as the fact that the effluent with higher DM content is also likely to have a higher C and N concentration. Effluent with a larger amount of fine solids can block soil pores, enhancing anaerobic conditions and N2O emissions, but solid manures generally have lower N contents and result in lower N2O emission than slurries (Chadwick et al. Citation2011). Effluents with a lower DM content infiltrate the soil more, which may also affect N2O emissions and complicate the relationship between DM and N2O emission factor.
Application method
Application method may also affect gaseous N losses. There are four broad categories of land application methods: irrigation of effluent; broadcast spreading; band spreading; and injection into the soil (Rotz Citation2004).
Meisinger & Jokela (Citation2000) suggest that during the irrigation process, 15%–43% of the total N applied was emitted as NH3 or otherwise made airborne before contacting the plant or soil surface. Ammonia volatilisation then continues from the field surface, causing an additional loss of up to 35% of total applied N. The range of losses reflects the difference in ambient temperature, precipitation and other weather conditions. If soil conditions are wet following irrigation then rapid incorporation of the effluent is slowed, which may lead to greater NH3 losses (Rodhe et al. Citation2006).
A wide range of N2O emissions have been found after irrigation with effluent. Luo et al. (Citation2008) found that irrigation with FDE generally increased N2O emissions, and overall N2O emissions from effluent-derived N ranged from 0.01%–4.93% depending on irrigation time, soil water-filled pore space (WFPS) and grazing history. Bhandral et al. (Citation2004) applied dairy effluent by irrigation to a poorly drained soil and observed that N2O emissions increased immediately after the application of the dairy effluent, and the total N2O emitted from effluent application ranged from 2%–5.8% of the total N added in the effluent. This suggests that the soil conditions (including moisture, surplus N and bulk density), manure characteristics and the interaction between the soil and effluent affect the emission of N2O from soils after irrigation with effluent.
Broadcast spreading throws effluents from the side or the back of a storage vehicle (i.e. slurry wagons and muck spreaders). This method is able to deal with effluents of different solid contents through the use of different storage and spreading units. The efficiency of broadcast spreading techniques for reducing NH3 losses is variable and again depends on the effluent, soil and weather conditions (Thomsen et al. Citation2010). In general, less than 1% of the total N applied is lost as NH3 during the spreading operation (Meisinger & Jokela Citation2000). The low loss is probably due to the lack of airborne fine particles as a result of this application technique. Compared with application to bare soil, broadcast spreading on grassland or heavy crop residue may increase NH3 loss by 30%–50%. This could be due to the grass or crop residue serving as a barrier and preventing much of the effluent from making contact with the soil. Also, effluent adhering to the grass could create a larger surface area for NH3 volatilisation, as suggested by Meisinger & Jokela (Citation2000). Limited data show that broadcast spreading of effluent results in N2O emissions ranging from 0.07%–1.69% of the total effluent N applied (Misselbrook et al. Citation2002; Webb & Misselbrook Citation2004; Thorman et al. Citation2007). Band spreading takes place using a trailing shoe system, where the trailing shoe is attached to either the slurry tanker or to the storage facility via an umbilical hose. A number of techniques have been used to apply effluent in bands in Europe (Sistani et al. Citation2010; Thomsen et al. Citation2010). This technique is primarily used on grassland or other established crops. When bands are well formed and maintained on the surface, NH3 loss can be reduced by 30%–70% compared with broadcast spreading on the same crop (Rotz Citation2004). Thomsen et al. (Citation2010) found N2O emission factors from banded application of effluent of 0.5%.
Effluent injection is the direct injection of effluent into soil, which can occur at either deep or shallow depths. A large portion of the NH3 emission occurs within a few hours of spreading and rapid incorporation of manure/slurry into the soil can be a method to reduce NH3 loss (Rodhe et al. Citation2006). However, this method would be of limited use for application on grazed permanent pastures. Cultivation for pasture renewal can be an opportunity for incorporation of manure/slurry into the soil. Incorporation of effluent may also affect N2O emissions, but the results vary. Higher N2O emissions have been shown to occur in some studies (Misselbrook et al. Citation2002; Wulf et al. Citation2002; Velthof et al. Citation2003; Dell et al. Citation2011); however, this is not always the case (Vallejo et al. Citation2005). Some research has shown that in different years of the same study (e.g. Rubaek et al. Citation1996; Sistani et al. Citation2010), injection of effluent can increase, decrease or have no effect on N2O emission compared with surface broadcasting. This suggests that when conditions are favourable for denitrification, effluent injection can result in increased N2O emissions compared with surface broadcasting. But under other conditions, effluent injection has the potential to reduce both NH3 and N2O emissions.
Soil factors
Soil conditions, such as moisture content, temperature, C and N concentrations, cation exchange capacity (CEC), pH and plant or residue cover, affect NH3 and N2O losses.
Higher soil pH generally leads to enhanced NH3 emissions by affecting the equilibrium between NH4 + and NH3 (Petersen & Sommer Citation2011; Salim et al. Citation2014). The CEC of soils influences the NH3 concentration through the reaction of NH4 + ions with the negatively charged cation exchange sites. Hence, soils with low CECs are more prone to NH3 volatilisation than soils with high CECs. There is little information regarding the relationship between NH3 emissions from effluent application and CEC; however, Cameron et al. (Citation2013) reported that there was an inverse relationship between NH3 volatilisation from applied urine and the CEC of a number of soils. It has been suggested that the higher CEC of clay soils can reduce N availability through increased adsorption of NH4 + compared with sandy soils (Jarecki et al. Citation2008).
Soil physical conditions, such as soil moisture, at the time of application are also very important in terms of NH3 volatilisation. Sommer & Olsen (Citation1991) reported a two- to three-fold increase in NH3 emissions from moistened soils compared with those in an air-dry condition and they ascribed the increase to a lower absorption of the liquid fraction into the wetter soils.
Soil pH affects the rates of nitrification and denitrification and therefore the rates of N2O production (van der Weerden et al. Citation1999; Cameron et al. Citation2013). It has been suggested that most denitrifying bacteria grow best in near neutral pH conditions (pH 6–8) and account for significant N2O emissions. Under acidic conditions, availability of organic C and N mineralisation is lower which results in a decrease in the soil denitrifier community. Hence, overall denitrification rate is higher in neutral or slightly alkaline soils than acidic soils (Thangarajan et al. Citation2013). The ratio of N2O/N2 produced is also affected by soil pH. Rochester (Citation2003) found that the proportion of N2O increases as pH decreases, with N2O frequently appearing as the dominant product in acidic soil; approximately the same amounts of each gas are emitted from acidic soils (pH <6.0), whereas for the alkaline grey clays (pH 8.3–8.5) the ratio of N2O/N2 is about 0.024. Zaman et al. (Citation2013) also suggested that increasing soil pH above 6 may offer a mechanism to mitigate N2O emissions by shifting the balance between N2O and N2.
Nitrate concentrations have been observed to influence N2O in the gaseous products of denitrification. It has been found that N2O emissions increase after the addition of NO3 −, as the denitrification rate and N2O emissions depend on NO3 − concentrations (Saggar et al. Citation2004). Blackmer & Bremner (Citation1978) found that nitrate concentrations as low as 50 mg kg−1 in soil inhibit N2O reduction to N2. Therefore, at low NO3 − concentrations, N2 is the predominant product and at high NO3 − concentrations, N2O often predominates (Saggar et al. Citation2013).
Soil WFPS can reflect seasonal changes in temperature and rainfall, and therefore could also affect emissions of N2O.When WFPS is greater than 55%–60%, there is a sharp increase in N2O emissions (e.g. Luo et al. Citation2008; van der Weerden et al. Citation2014), which may result in relatively high emission factors.
Animal treading leads to soil compaction and has been shown to be an important factor affecting N2O emissions in grazed pastures (Menneer et al. Citation2005). For example, Bhandral et al. (Citation2003) observed that soil compaction resulted in a high N2O emission flux from effluent application, with about 10% of the N applied emitted from compacted soil, whereas uncompacted soil resulted in a loss of only 0.5% of N applied.
Environmental factors
The dominant environmental factors influencing NH3 and N2O losses from land-applied effluent include wind speed, rainfall and temperature.
The partial pressure of NH3 in the atmosphere affects the release of NH3 gas from the soil to the atmosphere. Hence, temperature and wind speed affect NH3 volatilisation through their effect on partial pressure close to the soil surface (Meisinger & Jokela Citation2000). Bouwman et al. (Citation2002) observed that high temperature increases the relative proportion of NH3 to NH4 + present, decreases the solubility of NH3 in water, and increases the diffusion of NH3 away from the air-soil interface. Moyo et al. (Citation1989) found that urease activity increased with an increase in temperature from 2–45 °C, and peaked at 37 °C. Furthermore, urea hydrolysis, a function of microbial activity, is also affected by temperature. When the temperature is reduced to a point where microbial activity ceases, the production of NH4 + ions and the subsequent loss of NH3 should stop, i.e. below −4 °C (Meisinger & Jokela Citation2000). However, Misselbrook et al. (Citation2005) found no relationship between temperature and NH3 emissions. They concluded that other factors were affecting NH3 emissions such as soil moisture, humidity, wind speed and rainfall, which may have negated the expected influence of increased temperature.
Wind speed is positively associated with NH3 emissions by increasing the mass transfer and air exchange between the soil surface and the atmosphere (Misselbrook et al. Citation2005). Sommer & Hutchings (Citation2001) found that there was a linear relationship between wind speeds up to about 2.5 m s−1 and NH3 volatilisation. The greatest effect of wind speed is at the beginning of an effluent application, before drying and surface depletion of NH4 +-N occur. Emissions from surface-applied manure may also be reduced by the formation of a surface crust which acts as a physical barrier to NH3 emissions (Meisinger & Jokela Citation2000).
Crust formation is inhibited by regular wetting (Misselbrook et al. Citation2005), thereby increasing NH3 emissions. Rainfall after an effluent application can reduce NH3 emissions by transporting NH4 + from the surface into the soil profile, therefore reducing the N content of the effluent on the soil surface (Misselbrook et al. Citation2005; Webb et al. Citation2012). Pain et al. (Citation1997) also reported reductions in NH3 emission of about one-third from an 18 mm rainfall event after effluent application. However, Sommer & Hutchings (Citation2001) noted an increase in NH3 volatilisation rate immediately following rainfall events several days after effluent application, perhaps due to rewetting and subsequent redrying of the solid manures.
Temperature varies temporally and can affect N2O emissions (Schils et al. Citation2013). De Klein & Van Logtestijn (Citation1996) found that with an increase in temperature from 10 °C to 20 °C, the denitrification rate increased about 10-fold in non-irrigated plots and three-fold in irrigated plots. Luo et al. (Citation2008) noticed that there were highly variable patterns of N2O flux response following effluent application during different seasons, which were considered to be caused by the differences in temperature in autumn and winter.
Enhanced N2O emissions following rainfall are commonly reported for agro-ecosystems and have been generally attributed to the dual effects of bringing applied substrates into contact with soil microorganisms and a reduction in soil O2 levels (Luo et al. Citation2013). Saggar et al. (Citation2004) suggested that the highest N2O emissions or denitrification rates in temperate grassland soils were obtained following rainfall or irrigation events. It has been suggested that more N2O is produced at lower temperatures and that the N2O:N2 product ratio is increased as the activation energy of N2O reduction is higher than the activation energy of N2O production (Holtan-Hartwig et al. Citation2002).
Management practices to control ammonia and nitrous oxide emissions
Effluent contains valuable organic matter and nutrients that, if applied to pasture, can help to rebuild soil texture and biological activity and provide nutrients required for growth of the next crop (Luo et al. Citation2008). However, environmental concerns from applying effluent encompass nitrogen gaseous losses which could reduce effluent fertiliser value and add to environmental degradation. There are a number of possible methods that can be used to reduce NH3 and N2O emissions from effluent application to pastures, but the key option is to improve overall N efficiency (Saggar et al. Citation2013). For example, soil management to minimise risk, optimum use of effluent, use of soil N process inhibitors, use of supplementary low-N feed and diet manipulation. Some of these options are currently in use by farmers, while others require further research and development (). Some strategies, such as reducing livestock numbers, lowering the amount of N, avoiding excessive manure application and using N process inhibitors can reduce both NH3 and N2O emissions. However, other strategies, such as timing of effluent application, mixing with soil and effluent pre-treatment, can result in ‘pollution swapping’ between NH3 and N2O emissions.
Table 1 Potential mitigation methods for NH3 and N2O from effluent application in pasture.
Reduce N excretion
The simplest approach to mitigate NH3 and N2O emissions from effluent application to pasture is to reduce animal livestock numbers, and hence the amount of effluent generated. Therefore, reducing meat and animal fat consumption in the industrial world would contribute to livestock numbers and animal waste reduction, and also could decrease the gaseous N emissions. However, increases in human population would lead to increased animal protein consumption, so reducing numbers of animals to lower gaseous N emissions is likely to be unacceptable, unless there are significant increases in per-animal productivity. Strategic selection of animal type or animal breeding would help to reduce NH3 and N2O emissions. For example, it is suggested that increasing milk production efficiency in dairy cows will offer the potential to reduce the amount of N that ends up in excreta, due to more N being used for milk formation than maintenance (Satter et al. Citation2002). Similarly, potential benefits might be achieved by growing meat-producing animals to their finishing weight more quickly and thereby reducing total intake and N excretion (de Klein & Eckard Citation2008).
A reduction in the amount of effluent N applied per hectare of land would help to minimise the potential risks. However, the area required for effluent treatment would then be increased. Decreasing the N content of the effluent (by decreasing N excretion) can offer potential to reduce subsequent N losses. It is suggested that avoiding excessive N in the diet or adding bacteria would keep feeding rations with a better N balance, thereby reducing the N content of the effluent. Luo et al. (Citation2008) found that use of these practices could reduce N excretion by up to 25% in animal operations. There was a 20% reduction in estimated N excretion from urine and faeces by reducing the protein content of supplemental feed (Montes et al. Citation2013). Nitrogen excretion reduction might be directly achieved by using different breeds of livestock, feed formations or other practices that improve animal performance and thereby the product yield per unit of effluent N (Luo et al. Citation2008). Although animals cannot avoid excreting N, farmers can reduce the N excretion by decreasing the crude protein (CP) content of the diet (Hristov et al. Citation2011). Emissions from land-applied manure are further reduced because low-CP diets produce manure with a slower mineralisation rate of N (Powell et al. Citation2011). It has been suggested that addition of available C to soil would increase denitrification and also the ratio of N2:N2O (Oenema et al. Citation2014). Therefore, higher C in the low-CP diet would reduce the associated N2O production of denitrification (Saggar et al. Citation2013).
Inhibitors
Technologies employing urease and nitrification inhibitors have been used as effective mitigation strategies to control N losses from urea and urine application to soil by acting on the N processes of urea hydrolysis and nitrification, respectively (Cameron et al. Citation2013; Montes et al. Citation2013). This concept has also been tested on effluent. As part of a proof-of-concept study, Li et al. (Citation2014a) found that the addition of N-(n-butyl) thiophosphoric triamide (NBTPT, commercially named Agrotain) to freshly mixed dung and urine reduced NH3 volatilisation from 15% to 8% of N following application to pasture. However, whether NBTPT should be used depends on the amount of urea in the effluent. The potential will be limited when there is only a small amount of urea in applied effluent, as most of the urea in urine would have already been transformed to NH4 + soon after the effluent was collected. Studies have also found that the application of dicyandiamide (DCD) to effluent can reduce N2O emission by about 10% to 80% (Vallejo et al. Citation2005; Li et al. Citation2014b). These inhibitor technologies require further testing under a range of soil and environmental conditions and their practicality needs to be explored.
Optimise timing of effluent application
In order to improve the efficiency of effluent N use by plants, farmers should consider climate and soil factors (e.g. rainfall and soil drainage) at the time of application and seasonal patterns of plant growth. Houlbrooke et al. (Citation2004) suggested that a reduction in the use of effluent under wet winter and spring conditions could potentially reduce N2O emissions and N leaching. Luo et al. (Citation2008) also found that strategic application of effluent to pastures under dry soil-moisture status could reduce N2O emissions by up to 96%. Delaying effluent application until after grazing events could further reduce N2O emissions by reducing the level of surplus mineral N in soil. Therefore, timing FDE application to occur when soil conditions favour quick infiltration of effluent can reduce NH3 and N2O emissions. Thorman et al. (Citation2007) suggested that effluent be applied to an actively growing pasture in spring. The best strategy to reduce N losses is to apply the right amount of effluent close to the time the nutrients are needed by the crop, as suggested by Saggar et al. (Citation2013). On a daily time scale, effluent could potentially be applied in the late afternoon or evening to take advantage of the marked diurnal trend in NH3 losses, which consist of high daytime losses and lower losses at night (Sommer & Hutchings Citation2001).
Match effluent application rate to pasture requirements
Application rate and effluent DM content can be manipulated to reduce NH3 and N2O losses. Land subjected to high effluent applications can generally emit higher N2O because the effluent adds N and available C which promote denitrification (Saggar et al. Citation2004). Moreover, if best management practices are not followed, effluent is often applied to land as a means of disposal, so rates can be excessive. Optimum levels of effluent N, however, will depend on the particular production system concerned. In farm systems, any effluent N applications should be adjusted to take into account the N loading of the applied effluent and to match pasture requirements (Luo et al. Citation2010). In this regard, use of a nutrient budget model, such as Overseer® (Wheeler et al. Citation2008), is a useful tool for assessing the sustainability of N flows within farm systems and identifying opportunities for reducing NH3 and N2O emissions.
Optimal application methods
Injection of effluent or rapid incorporation within a few hours of application, which minimises contact of the effluent with air, tends to reduce NH3 emissions (Webb et al. Citation2010). However, the potential of this measure is limited for grazed pastures. As found by Mkhabela et al. (Citation2008), water irrigation immediately following effluent application can reduce gaseous NH3 volatilisation. Incorporation of effluent into the soil can lead to N ‘pollution swapping’ with associated increased direct N2O emissions and leaching from the soil (Brink et al. Citation2001). In addition, it can increase CO2 emissions because more fuel is required by tractors for effluent incorporation (Hansen et al. Citation2003). Band spreading with a trailing shoe or similar device can provide an alternative option for an established crop or grassland where effluent incorporation is not possible (Webb et al. Citation2010).
Pre-treatment of effluent
Decreasing the effluent pH below 7 before it is applied can reduce NH3 emissions (Petersen & Sommer Citation2011). Ndegwa et al. (Citation2011) suggested that the addition of nitric or sulphuric acid to the effluent (dropping effluent pH to 6.5) reduced NH3 loss by up to 75%. Using alum or ferrous sulphate can also have an acidifying effect on effluent, which may reduce N loss. Effluents with reduced C and acidification of effluent have the potential for further reducing N2O emissions following land application (Fangueiro et al. Citation2010). Results from previous studies on the effect of pre-treatment of effluent and application method on NH3 and N2O emissions after effluent application suggested that emissions after digestion and acidification of effluent were significantly lower (P < 0.05) than those from untreated effluent (Wulf et al. Citation2002; Bhandral et al. Citation2009).
Interactions of NH3 and N2O mitigation strategies
As discussed above, there is a range of mitigation options that can be used to reduce N losses before and during effluent application. However, some of these practices may result in ‘pollution swapping’. For example, Brink et al. (Citation2001) found that NH3 abatement may have an adverse effect on N2O emissions, while abatement of N2O has no effect on NH3 volatilisation. The use of effluent injection techniques generally decreases NH3 emissions, but it can increase N2O emissions (Flessa & Beese Citation2000; Wulf et al. Citation2002). Similarly, anaerobic digestion may reduce N2O emissions from the land application of effluents, but such effluent treatment may enhance NH3 emissions resulting from a higher effluent pH (Saggar et al. Citation2004). Previous studies (e.g. Zaman et al. Citation2013; Li et al. Citation2014b) have shown that DCD can reduce N2O emissions from urine and effluent applications in pastoral soils. However, DCD application could potentially increase NH3 emissions (Schils et al. Citation2013). The measures to reduce gaseous emissions of both NH3 and N2O from land application of farm effluents would therefore require some trade-offs between these two gases.
Conclusion
Ammonia and N2O production and emissions are due to a complex combination of physical, chemical and biological processes. Studies on the general magnitude and pattern of field emissions have enhanced our understanding of gaseous emissions processes. Ammonia volatilisation is regulated by NH4 + concentration, effluent DM and pH, soil pH, CEC, soil moisture, temperature and wind velocity. Nitrous oxide emission is regulated by C supply, NO3 −-N concentration, aeration status, pH and temperature. Agricultural management practices and weather conditions can also regulate NH3 and N2O emissions in the field by affecting the basic factors that influence these gaseous losses. There is a range of mitigation options that can be used to reduce N losses before and during effluent application, including: reducing livestock numbers; lowering the amount of N; using N process inhibitors; optimising timing of effluent application; matching effluent application rates to crop requirements; and improving effluent treatment before application. Some of these options can reduce both NH3 and N2O emissions, such as reducing livestock numbers; lowering the amount of N; avoiding excessive manure application; and using N process inhibitors. It is important to remember, however, that some of these options, such as timing of effluent application, can result in ‘pollution swapping’ between these two gases and some of these options, such as inhibitor use, are in the early stages of development. Future research needs to focus on the overall impact of mitigation options on the whole suite of gaseous emissions and the practicality of those options.
Acknowledgements
The authors gratefully acknowledge funding from Ballance Agri-Nutrients Limited and the New Zealand Government through the Livestock Emissions & Abatement Research Network (LEARN) scholarship programme. The authors also acknowledge funding for Taishan Scholars Programme for overseas experts. Any view or opinion expressed does not necessarily represent the view of the funding organisations.
References
- Akiyama H, Morimoto S, Hayatsu M, Hayakawa A, Studo S, Yagi K 2013. Nitrification, ammonia-oxidizing communities, and N2O and CH4 fluxes in an imperfectly drained agricultural field fertilized with coated urea with and without dicyandiamide. Biology and Fertility of Soils 49: 213–223.10.1007/s00374-012-0713-2
- Amon B, Kryvoruchko V, Amon T, Zechmeister-Boltenstern S 2006. Methane, nitrous oxide and ammonia emissions during storage and after application of dairy cattle slurry and influence of slurry treatment. Agriculture, Ecosystems & Environment 112: 153–162.10.1016/j.agee.2005.08.030
- Barton L, Schipper LA 2001. Regulation of nitrous oxide emissions from soils irrigated with dairy farm effluent. Journal of Environmental Quality 30: 1881–1887.10.2134/jeq2001.1881
- Beauchamp EG, Kidd GE, Thurtell G 1982. Ammonia volatilization from liquid dairy cattle manure in the field. Canadian Journal of Soil Science 62: 11–19.10.4141/cjss82-002
- Bhandral R, Bittman S, Kowalenko G, Buckley K, Chantigny MH, Hunt DE et al. 2009. Enhancing soil infiltration reduces gaseous emissions and improves N uptake from applied dairy slurry. Journal of Environmental Quality 38: 1372–1382.10.2134/jeq2008.0287
- Bhandral R, Bolan NS, Saggar S, Hedley MJ 2007. Nitrogen transformation and nitrous oxide emissions from various types of farm effluents. Nutrient Cycling in Agroecosystems 79: 193–208.10.1007/s10705-007-9107-5
- Bhandral R, Saggar S, Bolan NS, Hedley MJ 2003. Nitrous oxide fluxes in soil as influenced by compaction. Proceedings of the New Zealand Grassland Association 65: 265–271.
- Bhandral R, Saggar S, Bolan N, Hedley MJ 2004. Nitrous oxide emissions from farm effluents. In: 3rd Australian New Zealand Soils Conference, Sydney, Australia, University of Sydney. Australian Society of Soil Science Incorporated/New Zealand Society of Soil Science SuperSoil. 9 p.
- Blackmer AM, Bremner JM 1978. Inhibitory effect of nitrate on reduction of N2O to N2 by soil microorganisms. Soil Biology and Biochemistry 10: 187–191.10.1016/0038-0717(78)90095-0
- Bouwman AF, Boumans LJM, Batjes NH 2002. Cutover peatlands: a persistent source of atmospheric CO2. Global Biogeochemical Cycles 16: 1–7.10.1029/2001GB001398
- Brink C, Carolien K, Zbigniew K 2001. Ammonia abatement and its impact on emissions of nitrous oxide and methane—Part 2: application for Europe. Atmospheric Environment 35: 6313–6325.10.1016/S1352-2310(01)00433-2
- Cameron KC, Di HJ, Moir JL 2013. Nitrogen losses from the soil/plant system: a review. Annals of Applied Biology 162: 145–173.10.1111/aab.12014
- Chadwick DR, Pain BF, Brookman SKE 2000. Nitrous oxide and methane emissions following application of animal manures to grassland. Journal of Environmental Quality 29: 277–287.10.2134/jeq2000.00472425002900010035x
- Chadwick D, Sommer S, Thorman R, Fangueiro D, Cardenas L, Amon B et al. 2011. Manure management: implications for greenhouse gas emissions. Animal Feed Science and Technology 166–167: 514–531.10.1016/j.anifeedsci.2011.04.036
- de Klein CAM, Eckard RJ 2008. Targeted technologies for nitrous oxide abatement from animal agriculture. Australian Journal of Experimental Agriculture 48: 14–20.10.1071/EA07217
- de Klein CAM, Van Logtestijn RSP 1996. Denitrification in grassland soils in the Netherlands in relation to irrigation, N-application rate, soil water content and soil temperature. Soil Biology and Biochemistry 28: 231–237.10.1016/0038-0717(95)00131-X
- Dell CJ, Meisinger JJ, Beegle DB 2011. Subsurface application of manure slurries for conservation tillage and pasture soils and their impact on the nitrogen balance. Journal of Environmental Quality 40: 352–361.10.2134/jeq2010.0069
- Fangueiro D, Ribeiro H, Coutinho J, Cardenas L, Trindade H, Cunha-Queda C et al. 2010. Nitrogen mineralization and CO2 and N2O emissions in a sandy soil amended with original or acidified pig slurries or with the relative fractions. Biology and Fertility of Soils 46: 383–391.10.1007/s00374-010-0444-1
- Flessa H, Beese F 2000. Laboratory estimates of trace gas emissions following surface application and injection of cattle slurry. Journal of Environmental Quality 29: 262–268.10.2134/jeq2000.00472425002900010033x
- Gerber PJ, Hristov AN, Henderson B, Makkar H, Oh J, Lee C et al. 2013. Technical options for the mitigation of direct methane and nitrous oxide emissions from livestock—A review. Animal 7: 220–234. 10.1017/S1751731113000876
- Hansen MN, Sommer SG, Madsen N P 2003. Reduction of ammonia emission by shallow slurry injection. Journal of Environmental Quality 32: 1099–1104.10.2134/jeq2003.1099
- Holtan-Hartwig L, Dörsch P, Bakken LR 2002. Low temperature control of soil denitrifying communities: kinetics of N2O production and reduction. Soil Biology and Biochemistry 34: 1797–1806.10.1016/S0038-0717(02)00169-4
- Houlbrooke DJ, Horne DJ, Hedley MJ, Hanly JA, Snow VO 2004. A review of literature on the land treatment of farm-dairy effluent in New Zealand and its impact on water quality. New Zealand Journal of Agricultural Research 47: 499–511.10.1080/00288233.2004.9513617
- Hristov AN, Hanigan M, Cole A, Todd R, McAllister TA, Ndegwa PM et al. 2011. Ammonia emissions from dairy farms and beef feedlots: a review. Canadian Journal of Animal Science 91:1–35.10.4141/CJAS10034
- Jarecki MK, Parkin TB, Chan AS, Hatfield JL, Jones R 2008. Greenhouse gas emissions from two soils receiving nitrogen fertilizer and swine manure slurry. Journal of Environmental Quality 37: 1432–1438. 10.2134/jeq2007.0427
- Li J, Shi Y, Luo J, Houlbrooke D, Ledgard S, Ghani A et al. 2014a. Effects of form of effluent, season and urease inhibitor on ammonia volatilization from dairy farm effluent applied to pasture. Journal of Soils and Sediments 14: 1341–1349. 10.1007/s11368-014-0887-3
- Li J, Shi Y, Luo J, Zaman M, Houlbrooke D, Ding W et al. 2014b. Use of nitrogen process inhibitors for reducing gaseous nitrogen losses from land-applied farm effluents. Biology and Fertility of Soils 50: 133–145. 10.1007/s00374-013-0842-2
- Lockyer DR, Pain BF, Klarenbeek JV 1989. Ammonia emissions from cattle, pig and poultry wastes applied to pasture. Environmental Pollution 56: 19–30.
- Longhurst B, Houlbrooke D, Orchiston T, Muirhead R 2012. Characterising dairy manures and slurries. In: Currie LD, Christensen CL eds. Advanced Nutrient Management: gains from the Past-goals for the Future. Occasional Report No. 25. Palmerston North, New Zealand, Fertilizer and lime Research Centre, Massey University. http://flrc.massey.ac.nz/publications.html ( accessed 8 March 2015).
- Luo J, De Klein CAM, Ledgard SF, Saggar S 2010. Management options to reduce nitrous oxide emissions from intensively grazed pastures: a review. Agriculture, Ecosystems & Environment 136: 282–291.10.1016/j.agee.2009.12.003
- Luo J, Ledgard SF, Lindsey SB 2013. Nitrous oxide and greenhouse gas emissions from grazed pastures as affected by use of nitrification inhibitor and restricted grazing regime. Science of the Total Environment 465: 107–114.10.1016/j.scitotenv.2012.12.075
- Luo J, Saggar S, Bhandral R, Bolan N, Ledgard S, Lindsey S et al. 2008. Effects of irrigating dairy-grazed grassland with farm dairy effluent on nitrous oxide emissions. Plant and Soil 309: 119–130.10.1007/s11104-008-9550-3
- MacGregor AN, Stout JD, Jackson RJ 1979. Quality of drainage water from pasture treated with dairyshed effluent. Progress in Water Technology 11: 11–17.
- Meisinger JJ, Jokela WE 2000. Ammonia volatilisation from dairy and poultry manure. Managing nutrients and pathogens from animal agriculture. Natural Resource, Agriculture, and Engineering Service (NRAES), Ithaca, New York. Pp. 334–354.
- Menneer JC, Ledgard S, McLay C, Silvester W 2005. Animal treading stimulates denitrification in soil under pasture. Soil Biology and Biochemistry 37: 1625–1629.10.1016/j.soilbio.2005.01.023
- Misselbrook TH, Powell JM, Broderick GA, Grabber JH 2005. Dietary manipulation in dairy cattle: laboratory experiments to assess the influence on ammonia emissions. Journal of Dairy Science 88: 1765–1777.10.3168/jds.S0022-0302(05)72851-4
- Misselbrook TH, Smith KA, Johnson RA, Pain BF 2002. SE-structures and environment: slurry application techniques to reduce ammonia emissions: results of some UK field-scale experiments. Biosystems Engineering 81: 313–321.10.1006/bioe.2001.0017
- Mkhabela MS, Madani A, Gordon R, Burton D, Cudmore D, Elmi A et al. 2008. Gaseous and leaching nitrogen losses from no-tillage and conventional tillage systems following surface application of cattle manure. Soil and Till Research 98: 187–199.10.1016/j.still.2007.12.005
- Montes F, Meinen R, Dell C, Rotz A, Hristov AN, Oh J et al. 2013. SPECIAL TOPICS—mitigation of methane and nitrous oxide emissions from animal operations: II. A review of manure management mitigation options. Journal of Animal Science 91: 5070–5094.10.2527/jas.2013-6584
- Moyo CC, Kissel DE, Cabrera ML 1989. Temperature effects on soil urease activity. Soil Biology and Biochemistry 21: 935–938.10.1016/0038-0717(89)90083-7
- Ndegwa PM, Hristov AN, Ogejo JA 2011. Ammonia emission from animal manure: mechanisms and mitigation techniques. In: He Z ed. Environmental chemistry of animal manure. Hauppauge, New York, Nova Science Publishers. Pp. 107–151.
- Oenema O, Ju X, de Klein C, Alfaro M, del Prado A, Lesschen JP et al. 2014. Reducing nitrous oxide emissions from the global food system. Current Opinion in Environmental Sustainability 9–10: 55–64.10.1016/j.cosust.2014.08.003
- O'Toole SE 1996. Assessing farm dairy effluent application on a selected number of Waikato dairy farms. B.Sc Technology industury report. Hamilton, The University of Waikato. 50 p.
- Pain BF, Misselbrook TH, Jarvis SC 1997. Sources of variation in ammonia emission factors for manure applications to grassland. In: Jarvis SC, Pain BF eds. Gaseous nitrogen emissions from grasslands. Wallingford, CAB International. Pp. 293–301.
- Panetta DM, Powers WJ, Lorimor JC 2005. Management strategy impacts on ammonia volatilisation from pig manure. Journal of Environmental Quality 34: 1119–1130.10.2134/jeq2004.0313
- Pelster DE, Chantigny MH, Rochette P, Angers DA, Rieux C, Vanasse A 2012. Nitrous oxide emissions respond differently to mineral and organic nitrogen sources in contrasting soil types. Journal of Environmental Quality 41: 427–435.10.2134/jeq2011.0261
- Petersen SO, Sommer SG 2011. Ammonia and nitrous oxide interactions: roles of manure organic matter management. Animal Feed Science and Technology 166: 503–513.10.1016/j.anifeedsci.2011.04.077
- Powell J M, Aguerre M J, Wattiaux M A 2011. Dietary crude protein and tannin impact dairy manure chemistry and ammonia emissions from incubated soils. Journal of Environmental Quality 40: 1767–1774.10.2134/jeq2011.0085
- Rochester IJ 2003. Estimating nitrous oxide emissions from flood-irrigated alkaline grey clays. Soil Research 41: 197–206.10.1071/SR02068
- Rochette P, Angers DA, Chantigny MH, Gagnon B, Bertrand N 2008. N2O fluxes in soils of contrasting textures fertilized with liquid and solid dairy cattle manures. Canadian Journal of Soil Science 88: 175–187.10.4141/CJSS07083
- Rochette P, Angers DA, Chantigny MH, MacDonald JD, Gasser MO, Bertrand N 2009. Reducing ammonia volatilization in a no-till soil by incorporating urea and pig slurry in shallow bands. Nutrient Cycling in Agroecosystems 84: 71–80.10.1007/s10705-008-9227-6
- Rodhe L, Salomon E. Edström M 2006. Handling of digestate on farm level. Ultunaallén 4, 756 51 Uppsala, Sweden, JTI – Institutet för Jordbruks- och Miljöteknik. 20 p.
- Rotz CA 2004. Management to reduce nitrogen losses in animal production. Journal of Animal Science 82: E119–E137.
- Rubaek GH, Henriksen K, Petersen J, Rasmussen B, Sommer SG 1996. Effects of application technique and anaerobic digestion on gaseous nitrogen loss from animal slurry applied to ryegrass (Lolium perenne). Journal of Agricultural Science 126: 481–492.10.1017/S0021859600075572
- Saggar S, Bolan NS, Bhandral R, Hedley CB, Luo J 2004. A review of emissions of methane, ammonia, and nitrous oxide from animal excreta depostion and farm effluent application in grazed pasture. New Zealand Journal of Agricultural Research 47: 513–544.10.1080/00288233.2004.9513618
- Saggar S, Jha N, Deslippe J, Bolan NS, Luo J, Giltrap DL et al. 2013. Denitrification and N2O:N2 production in temperate grasslands: processes, measurements, modelling and mitigating negative impacts. Science of the Total Environment 456: 136–146. 10.1016/j.scitotenv.2012.11.050
- Saggar S, Luo J, Kim DG, Jha N 2011. Intensification in pastoral farming: impacts on soil attributes and gaseous emissions. In: Singh BP, Cowie A, Chan Y ed. Soil health and climate change (Soil Biology Series). Berlin, Springer-Verlag. Pp. 207–236.
- Salazar F, Martínez-Lagos J, Alfaro M, Misselbrook T 2014. Ammonia emission from a permanent grassland on volcanic soil after the treatment with dairy slurry and urea. Atmospheric Environment 95: 591–597.10.1016/j.atmosenv.2014.06.057
- Salim HM, Patterson PH, Ricke SC, Kim WK 2014. Enhancement of microbial nitrification to reduce ammonia emission from poultry manure: a review. World's Poultry Science Journal 70: 839–856.10.1017/S0043933914000890
- Satter LD, Klopfenstein TJ, Erickson GE 2002. The role of nutrition in reducing nutrient output from ruminants. Journal of Animal Science 80: 143–156.
- Schils RLM, Eriksen J, Ledgard SF, Vellinga TV, Kuikman PJ, Luo J et al. 2013. Strategies to mitigate nitrous oxide emissions from herbivore production systems. Animal 7: 29–40.10.1017/S175173111100187X
- Sherlock RR, Sommer SG, Khan RZ, Wood C, Guertal EA, Freney JR et al. 2002. Ammonia, methane, and nitrous oxide emission from pig slurry applied to a pasture in New Zealand. Journal of Environmental Quality 31: 1491–1501.10.2134/jeq2002.1491
- Sistani KR, Warren JG, Lovanh N, Higgins S, Shearer S 2010. Greenhouse gas emissions from swine effluent applied to soil by different methods. Soil Science Society of America Journal 74: 429–435.10.2136/sssaj2009.0076
- Smith KA, Chambers BJ 1995. Muck: from waste to resource utilization: the impacts and implications. Agricultural Engineer 50: 33–38.
- Sommer SG, Hutchings NJ 2001. Ammonia emission from field applied manure and its reduction—invited paper. European Journal of Agronomy 15: 1–15.10.1016/S1161-0301(01)00112-5
- Sommer SG, Olsen JE 1991. Effects of dry matter content and temperature on ammonia loss from surface applied cattle slurry. Journal of Environmental Quality 20: 679–683.10.2134/jeq1991.00472425002000030029x
- Spiehs MJ, Woodbury BL, Tarkalson DD, Wienhold BJ, Eigenberg RA 2010. Long term effects of annual additions of animal manure on soil chemical, physical, and biological properties in the Great Plains. Proceedings of the International Symposium on Air Quality and Manure Management for Agriculture Number 711P0510cd. American Society of Agricultural and Biological Engineers Publication, Dallas, TX, 13–16 September 2010.
- Thangarajan R, Bolan NS, Tian G, Naidu R, Kunhikrishnan A 2013. Role of organic amendment application on greenhouse gas emission from soil. Science of the Total Environment 465: 72–96.10.1016/j.scitotenv.2013.01.031
- Thomsen IK, Pedersen AR, Nyord T, Petersen SO 2010. Effects of slurry pre-treatment and application technique on short-term N2O emissions as determined by a new non-linear approach. Agriculture, Ecosystems & Environment 136: 227–235.10.1016/j.agee.2009.12.001
- Thorman RE, Chadwick DR, Harrison R, Boyles LO, Matthews R 2007. The effect on N2O emissions of storage conditions and rapid incorporation of pig and cattle farmyard manure into tillage land. Biosystems Engineering 97: 501–511.10.1016/j.biosystemseng.2007.03.039
- Vallejo A, García-Torres L, Díez JA, Arce A, López-Fernández S 2005. Comparison of N losses (NO3–, N2O, NO) from surface applied, injected or amended (DCD) pig slurry of an irrigated soil in a Mediterranean climate. Plant and Soil 272: 313–325.10.1007/s11104-004-5754-3
- Van der Weerden TJ, Luo J, Dexter M, Rutherford AJ 2014. Nitrous oxide, ammonia and methane emissions from dairy cow manure during storage and after application to pasture. New Zealand Journal of Agricultural Research 57: 354–369.10.1080/00288233.2014.935447
- Van der Weerden TJ, Sherlock RR, Williams PH, Cameron KC 1999. Nitrous oxide emissions and methane oxidation by soil following cultivation of two different leguminous pastures. Biology and Fertility of Soils 30: 52–60.10.1007/s003740050587
- Velthof GL, Kuikman PJ, Oenema O 2003. Nitrous oxide emission from animal manures applied to soil under controlled conditions. Biology and Fertility of Soils 37: 221–230.
- Webb J, Misselbrook TH 2004. A mass-flow model of ammonia emissions from UK livestock production. Atmospheric Environment 38: 2163–2176.10.1016/j.atmosenv.2004.01.023
- Webb J, Pain B, Bittman S, Morgan J 2010. The impacts of manure application methods on emissions of ammonia, nitrous oxide and on crop response—a review. Agriculture, Ecosystems & Environment 137: 39–46.10.1016/j.agee.2010.01.001
- Webb JM, Quintã R, Papadimitrou S, Norman L, Rigby M, Thomas DN et al. 2012. Halophyte filter beds for treatment of saline wastewater from aquaculture. Water Research 46: 5102–5114.10.1016/j.watres.2012.06.034
- Whalen SC, Phillips RL, Fischer EN 2000. Nitrous oxide emission from an agricultural field fertilized with liquid lagoonal swine effluent. Global Biogeochemical Cycles 14: 545–558.10.1029/1999GB900093
- Wheeler DM, Ledgard SF, DeKlein CAM 2008. Using the OVERSEER nutrient budget model to estimate on-farm greenhouse gas emissions. Animal Production Science 48: 99–103.10.1071/EA07250
- Wulf S, Maeting M, Clemens J. 2002. Application technique and slurry co-fermentation effects on ammonia, nitrous oxide, and methane emissions after spreading. Journal of Environmental Quality 31: 1795–1801.10.2134/jeq2002.1795
- Zaman M, Nguyen ML, Blennerhassett JD, Quin BF 2008. Reducing NH3, N2O and NO3–-N losses from a pasture soil with urease or nitrification inhibitors and elemental S-amended nitrogenous fertilisers. Biology and Fertility of Soils 44: 693–705.10.1007/s00374-007-0252-4
- Zaman M, Zaman S, Nguyen ML, Smith TJ, Nawaz S 2013. The effect of urease and nitrification inhibitors on ammonia and nitrous oxide emissions from simulated urine patches in pastoral system: a two-year study. Science of the Total Environment 465: 97–106.10.1016/j.scitotenv.2013.01.014