
Abstract
Soil aeration effects on the efficacy of dicyandiamide (DCD) at reducing reactive nitrous oxide (N2O) fluxes from ruminant urine patches have not been assessed. We tested the null hypothesis that increasing soil aeration and dissolved organic carbon (DOC) levels, following ruminant urine deposition, would reduce DCD efficacy, as determined from measurements of N2O fluxes. Soil aeration was controlled (−1 or −10 kPa, the former being wetter and less aerated) within a factorial experiment that also included DCD and ruminant urine (700 kg N ha−1) treatments, destructively sampled over 40 days. Increased soil aeration corresponded with a decrease in DCD efficacy. However, contrary to the null hypothesis, increasing soil DOC concentrations following urine application did not correspond with greater DCD degradation rates. In fact, at −1 kPa applying urine increased the DCD half-life from 23.5 (±3.0) to 53.3 (±7.5) days, while at −10 kPa the DCD half-life was not affected by urine application (14.9 [±2.9] and 16.7 [±2.7] days, with or without urine, respectively). The efficacy of DCD at mitigating urine-induced cumulative N2O fluxes was 95% at −1 kPa and 57% at −10 kPa. This study confirms that the degradation of DCD is slower, and thus its efficacy is better, in wet soils compared with well-aerated soils.
Introduction
New Zealand's pastoral land accounts for 45% of the total land area (Stevenson et al. Citation2010). Since 1990, New Zealand's grazed pasture systems have undergone rapid intensification resulting in increased stocking rates and excreta-N returns following the conversion of dry land to irrigated land, higher N inputs due to more intensive fertiliser-N usage, and the greater use of imported feed-N (Parfitt et al. Citation2012). Intensification of pasture management systems results in higher losses of reactive-N (Nr) in the nitrous oxide (N2O) and nitrate () forms (Di & Cameron Citation2000; Parfitt et al. Citation2012). Nitrous oxide is a greenhouse gas that comprises 14.3% of New Zealand's greenhouse gas inventory (Ministry for the Environment Citation2014). Emissions of N2O arise directly from N inputs, such as fertiliser or ruminant excreta, or indirectly following the movement of Nr throughout the landscape. Nitrate leaching from soils contributes to eutrophication of waterways, contamination of potable waters and indirect emissions of N2O (Galloway et al. Citation2003; Parfitt et al. Citation2012). In grazed pasture systems, the excretion and subsequent deposition of ruminant urine on to pasture soils forms ‘hot spots’ where the losses of
and N2O are exacerbated (Selbie et al. Citation2015). These losses are greater under dairy pasture systems due to the relatively high rates of N deposition in bovine urine patches. As a consequence, in New Zealand, declining water quality has been linked to the intensification of dairy production (McDowell et al. Citation2011).
Nitrification inhibitors, particularly dicyandiamide (DCD), have been used in New Zealand grazed pasture systems in an attempt to reduce the leakage of N2O and from ruminant urine patches. However, a series of New Zealand-wide field trials has shown N use efficiency and DCD's efficacy at inhibiting nitrification under ruminant urine patches varies substantially (Carey et al. Citation2012; Cameron et al. Citation2014; Kim et al. Citation2014; de Klein et al. Citation2014; Ledgard et al. Citation2014). Currently, DCD has been withdrawn from the New Zealand market due to traces of DCD being found in milk products. Thus, it is important to better understand the factors affecting both the longevity and efficacy of DCD in pasture soils.
Variation in DCD efficacy results from differences in soil microbial community composition and function since microbial degradation of DCD has been linked to microbial activity (Reddy Citation1964). This is in turn a function of the microbial environment resulting from the interaction of soil factors such as substrate supply, temperature and moisture (Harrison-Kirk et al. Citation2013). It is now well recognised that the half-life of DCD, and thus its efficacy, decreases with increasing soil temperature (Kelliher et al. Citation2008, Citation2014; Kim et al. Citation2012). A soil's oxygen (O2) status varies both temporally and spatially and is affected by the soil's water content and the relative O2 supply and demand status of the soil (Petersen & Sommer Citation2011). The O2 status of a soil can also affect a soil's microbial community function. For example, Zhu et al. (Citation2013) showed that soil O2 concentrations determined if nitrification, nitrifier–denitrification or denitrification dominated as a pathway for N2O.
Few experiments have directly examined the factors affecting DCD degradation in any detail, especially the effect of soil aeration on DCD efficacy. Vilsmeier (Citation1991) performed a laboratory experiment and found that DCD degraded more slowly under anaerobic conditions, while Corre & Zwart (Citation1995) suggested that DCD degraded faster at the soil surface where the soil was drier and where there was more organic matter. However, neither of these earlier studies directly measured DCD degradation. To our knowledge, the only study that has directly measured degradation of DCD under varying levels of soil aeration was the study by Balaine et al. (Citation2015).
By manipulating soil matric potential and measuring relative gas diffusivity of O2 as a direct measure of the soil's level of aeration, in conjunction with direct measurement of soil DCD concentrations over time, Balaine et al. (Citation2015) carefully showed that the increasing ability of O2 to diffuse into the soil resulted in a reduced half-life for DCD. Balaine et al. (Citation2015) found higher rates of DCD degradation with increasing soil organic matter content if soils were aerobic (−6 to −10 kPa). Although Balaine et al. (Citation2015) examined soil aeration effects on DCD concentrations, they did not assess how soil aeration affected actual efficacy of DCD with respect to soil N2O or fluxes in the presence of ruminant urine.
To address this research gap, N2O emissions were measured in an experiment with ruminant urine, DCD and soil aeration treatments, to determine if DCD efficacy would be affected by soil aeration. Based on the results of Balaine et al. (Citation2015), we hypothesised that decreasing soil aeration would increase DCD efficacy, as determined by reductions in soil N2O emissions, but that this effect would be confounded by the presence of urine enhancing the availability of dissolved organic carbon (DOC), which in turn would reduce DCD efficacy.
Materials and methods
Soil collection and experimental design
Soil, classified as a silt loam soil (Wakanui series, Uric Ustochrept, USDA Classification), was collected (0–15 cm depth) from a long-term pasture site (43o40′0.391″S, 172o28′11.76″E) that had been under pasture for 14 years (Fraser et al. Citation2013). Soil texture comprised 33% sand, 48% silt and 19% clay. Average (±SD) (n = 4) soil pH, organic matter, total carbon (C) and total nitrogen (N) contents were 5.25 (0.03), 53.4 (2.6) mg g−1, 31.0 (1.4) mg g−1, and 3.0 (0.1) mg g−1, respectively. Soil was air-dried at room temperature and then sieved (<2 mm). The sieved soil was then packed into stainless steel rings (7.3 cm internal diameter) to a depth of 4.1 cm, 189 g per ring, while attaining a soil bulk density of 1.1 Mg m−3. A total of 256 soil cores were packed and then arranged in a factorial experiment consisting of two soil moisture treatments × four urine-DCD treatments × eight destructive sample times × four replicates. These soil cores were randomly divided into two soil moisture treatments set at matric potentials of either −1 or −10 kPa during the experiment, resulting in volumetric water contents of 0.51 ± 0.05 and 0.31 ± 0.04 m3 water m−3 soil pores, and air-filled pore spaces of 0.27 ± 0.04 and 0.07 ± 0.05 m3 air-filled pores m−3 soil pores, respectively (±SD). The urine-DCD treatments consisted of four possible solutions: deionised water (DI), ruminant bovine urine only (700 kg N ha−1), ruminant bovine urine (700 kg N ha−1) plus DCD (16 mg kg−1) and DCD only (16 mg kg−1). Soil cores were then randomly assigned a destructive sampling date: 0, 3, 7, 14, 21, 28, 35 or 40 days.
Ruminant urine was collected from Friesian cows, at the Lincoln University dairy farm, that were grazing perennial ryegrass (Lolium perenne L.) and white clover (Trifolium repens L.). This urine was immediately sub-sampled and analysed (LECO Truspec C/N analyser) to determine its total N content with the remainder frozen until use. Prior to application, urine was brought to room temperature and additional N was added, as urea-N, to raise the total urine-N content from 5.8 to 9.7 g N L−1.
Soil cores were wetted up with DI water so that the subsequent addition of the treatment solution (30 mL) brought the soil cores to their designated soil matric potential. The required volumes of DI water to apply were previously determined using separate soil cores (Balaine et al. Citation2015). When applying the urine-DCD treatments, the soil cores received 30 mL of either; DI water, urine, urine+DCD (100 µg DCD mL−1) or DCD (100 µg DCD mL−1) as dictated by the treatment regime. Following treatment applications, the soil cores were arranged on tension tables set to maintain the designated soil matric potentials. Soil cores were kept at a constant room temperature of 21 ± 1.5 °C (SD).
Measurements
Soil surface pH was measured using a flat surface pH electrode (Broadley-James Corp, Irvine, CA) prior to destructive soil core sampling on designated days, Following this, the soil was extruded from the soil cores and mixed. Soil gravimetric water contents (θg) were determined by taking soil sub-samples and drying them at 105 °C for 24 h. Soil inorganic-N concentrations were determined by taking the equivalent of 10 g dry soil and extracting this with 100 mL of 2M KCl by shaking for 1 h on a reciprocal shaker followed by filtration (Whatman 42). Inorganic-N concentrations in the 2M KCl extracts were determined using flow injection analysis (Blakemore et al. Citation1987). DOC concentrations were determined on DI water extracts using a total organic carbon (TOC) analyser (Shimadzu Oceania Ltd, Sydney, Australia) on days 3, 14, 27 and 40. Soil water extracts were obtained by taking a 5 g sub-sample of moist soil and adding 30 mL of DI prior to shaking for 30 min, centrifuging for 20 min at 3500 rpm and then filtering (Advantec 5C) prior to DOC analysis (Ghani et al. Citation2003).
Concentrations of DCD in the soil were determined by shaking the equivalent of 5 g dry soil with 25 mL of DI water for 1 h, centrifuging at 4000 rpm for 20 min, and then filtering the extract sequentially through Whatman 42 filter paper and Phenomenex® syringe filters with a particle retention size of 0.22 μm. The DCD concentrations in these extracts were determined using a high-performance liquid chromatography (HPLC) system comprising a Prominence Degasser (DGU-20A3); LC-20AB/Prominence liquid chromatograph (LC-20AB); Prominence auto sampler (SIL-20A HT); Prominence UV/Vis detector (SPD-20A); and Prominence column oven (CTO-20A). The HPLC system included a Rezex RHM-Monosaccharide column (50 × 7.8 mm, Phenomenex®) with 0.0225 H2SO4 as the eluent at a flow rate of 1 mL min−1 and an analysis temperature of 45 °C. The detector wavelength was 210 nm and the sample injection volume was 50 μL. A DI matrix and high purity DCD (Sigma-Aldrich) were used to make standards to establish a standard curve.
The potential for diel variation in N2O fluxes was considered negligible since both diel temperature trends and plants were absent. Nevertheless, the fluxes of N2O were determined at 1000 h each day as previously recommended (van der Weerden et al. Citation2013). Fluxes of N2O from the soil surface were determined by placing the soil cores inside 1 L tins. These were fitted with a gas-tight lid that contained a rubber septum to facilitate gas sampling. After sealing the headspace, gas samples (10 mL) were taken at 0, 15 and 30 min, that is, t0, t1 and t2, respectively. A 20 mL glass syringe fitted with a three-way gas tap and a 25 gauge, 0.5 × 16 mm needle (Precision Glide, Becton-Dickinson, NJ) was used to take the gas samples. Gas samples were transferred into pre-evacuated (−1 atm.) 6 mL vials (Exetainers®, Labco, UK). The N2O concentrations in the gas samples were determined using gas chromatography (Clough et al. Citation2006) with an automated GC (8610, SRI Instruments, Torrance, CA) interfaced to an auto-sampler (Gilson 22XL, Middleton, WI). The N2O fluxes were calculated using the change in N2O concentration over time and the methods of Hutchinson & Mosier (Citation1981). Cumulative N2O fluxes were determined by integrating the area under the daily N2O fluxes over time using a trapezoidal method.
Measurements of relative O2 diffusivity (Dp/Do) were performed according to Rolston & Moldrup (Citation2002) as described by Balaine et al. (Citation2015). Briefly, an O2 sensor (KE-25, figaro Engineering Inc, Osaka, Japan) was placed in a chamber that was then purged with an argon (90%):dinitrogen (10%) gas mixture to create anaerobic conditions, while the soil core base was isolated from the chamber. Once anaerobic, the soil core base was exposed to the anaerobic chamber and O2 in the atmosphere diffused through the soil into the anaerobic chamber. Increases in O2 concentrations in the chamber were recorded over time. Consumption of O2 was considered negligible (Moldrup et al. Citation2000). The O2 diffusion coefficient in soil was calculated according to Rolston & Moldrup (Citation2002) with calculations performed at 25 °C and with the value of Do (O2 diffusion in air) taken to be 0.074 m2 h−1 (Currie Citation1960).
Statistical analyses
The Anderson-Darling test in Minitab® 16 (Minitab Inc, PA, USA) was used to check data for normality with log-transformed data used if deviations occurred. Data in figures and tables are original data. The 95% confidence interval was considered statistically significant. Analysis of variance was performed using the general linear model in Mintab® 16.
For each treatment that contained DCD, a first-order exponential function was fitted to the time series of the soil DCD concentrations as follows:(1)
Where C is the concentration of DCD (mg kg−1) at time t (days), Co is the initial DCD concentration (mg kg−1) and k is the degradation constant (day−1). Values for the DCD half-life (t½) were calculated as follows:(2)
Standard error of this DCD half-life was calculated using an inverse regression method, in which the limits of the 95% confidence interval of the half-life were given as the values corresponding to the limits of the 95% prediction interval of the DCD concentration corresponding to the half-life (the DCD concentration value at the half-life time, calculated by Equation 1) (Lavagnini & Magno Citation2007). Since the 95% confidence interval of the half-life was asymmetric about the mean (the distance from the mean to the upper limit was longer than the distance to the lower limit), the standard error was obtained by dividing the distance from the mean to the upper limit by two, to be conservative.
Results
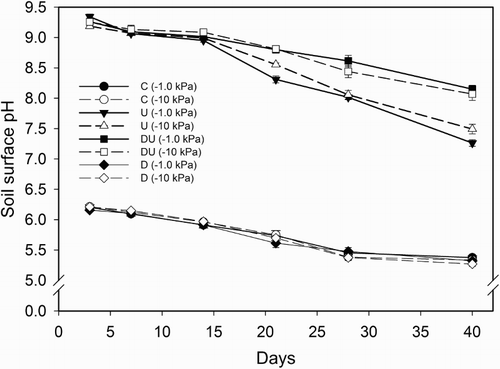
Soil surface pH values in the control and DCD-only treatments ranged from 6.3 to 5.3 during the 40 day experimental period with no difference due to DCD presence or soil matric potential, but values were lower (P < 0.01) than in urine-affected treatments (). Where urine was applied as a treatment, the soil surface pH increased to 9.3 by day 3 with no difference due to DCD presence (). Soil surface pH values in the urine-treated soil cores declined at a greater rate (P < 0.01) in the urine-only treatment from days 21 to 40 when compared with the urine-plus-DCD treatment (). Soil matric potential only affected soil surface pH in the urine-treated cores on day 21 where values were lower (P < 0.01) at −10 kPa ().
Figure 1 Average soil surface pH over a period of 40 days. Error bars are ± SEM, n = 4. Legend abbreviations: C = control, U = urine only, D = dicyandiamide only, DU = urine plus dicyandiamide, with soil matric potential (kPa) in brackets.
In urine-treated soil cores, concentrations ranged from 1380 to 1520 mg kg−1 soil on day 3 and from 889 to 1094 mg kg−1 soil on day 40. These concentrations were higher than those in the control and DCD-only treatments (A). The addition of DCD to the urine resulted in higher (P < 0.01) soil
concentrations from day 21 onwards in both the −1 and −10 kPa treatments with no effect over this time due to matric potential (A).
Figure 2 Average soil inorganic-N concentrations over a period of 40 days for A, soil ; B, soil
; and C, soil
concentrations. Error bars are ± SEM, n = 4. Legend abbreviations: C = control, U = urine only, D = dicyandiamide only, DU = urine plus dicyandiamide, with soil matric potential (kPa) in brackets.
Soil concentrations were higher (P < 0.01) under urine treatments than the control or DCD-only treatments, and several orders of magnitude lower than the
concentrations (B). The highest soil
concentrations were observed during the first 21 days of the experiment in the urine-only treatment at −1 kPa, reaching a maximum of 6.5 mg kg−1 soil on day 14 (B). In the urine treatments, an interaction (P < 0.01) between the DCD and kPa treatments occurred over the first 21 days; adding DCD to the urine, at −1 kPa, lowered (P < 0.01) the soil
concentrations in the urine-treated soils over the first 21 days. However, DCD had no significant effect on the soil
concentrations in the urine-treated soils at −10 kPa over this time (B). After day 21 there were few differences in soil
concentrations due to matric potential or DCD addition in the urine-treated soil cores (B).
Soil concentrations were higher in urine-treated soils and ranged from 2.5 to 220 mg kg−1 soil (C). Between days 21 and 40, the
concentrations in these urine-treated soils were affected by an interaction (P < 0.01) between treatments due to
concentrations increasing at different rates. In the absence of DCD, the soil
concentrations increased faster at both −10 and at −1 kPa; however, with DCD present, soil
concentrations increased more slowly at −10 kPa while at −1 kPa
concentrations remained constant (C).
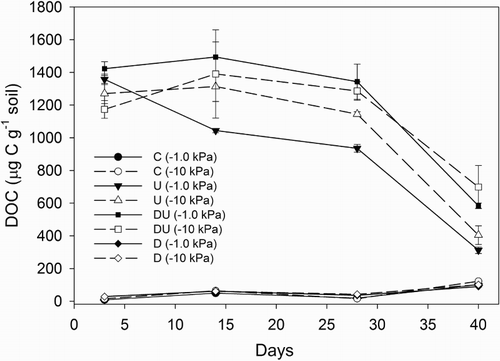
Over the course of the experiment, soil DOC concentrations in the control and DCD-only treatments ranged from mean values of 9 to 122 mg kg−1 (). However, in urine-affected treatments, DOC concentrations increased following urine application (P < 0.01) with mean values ranging from 1173 to 1423 on day 3. By day 40, these concentrations still remained elevated above those found in non-urine treatments (P < 0.01), ranging from 312 to 700 mg kg−1 (). When DCD was absent from the urine-treated soils, the DOC concentrations were lower (P < 0.01) on days 28 and 40 (). Soil moisture treatment had no significant effect on DOC concentrations.
Figure 3 Average soil DOC concentrations over a period of 40 days. Error bars are ± SEM, n = 4. Legend abbreviations: C = control, U = urine only, D = dicyandiamide only, DU = urine plus dicyandiamide, with soil matric potential (kPa) in brackets.
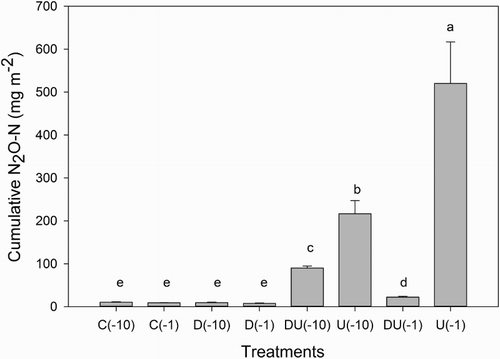
Application of urine elevated N2O–N fluxes with maximum fluxes at −1 and −10 kPa of 1341 μg m−2 h−1 and 729 μg m−2 h−1, on days 30 and 24, respectively (). Cumulative N2O–N fluxes, over the 40 days, were greater in the urine-treated soils in the absence of DCD and with more N2O-N evolved at −1 kPa than at −10 kPa (). Adding DCD reduced the cumulative N2O–N flux under the urine-treated soils by 95% and 57% in the −1 and −10 kPa treatments, respectively, but had no effect on cumulative N2O emissions in the absence of urine ().
Figure 4 Average hourly soil N2O–N fluxes over a period of 40 days. Error bars are ± SEM, n = 4. Legend abbreviations: C = control, U = urine only, D = dicyandiamide only, DU = urine plus dicyandiamide, with soil matric potential (kPa) in brackets.
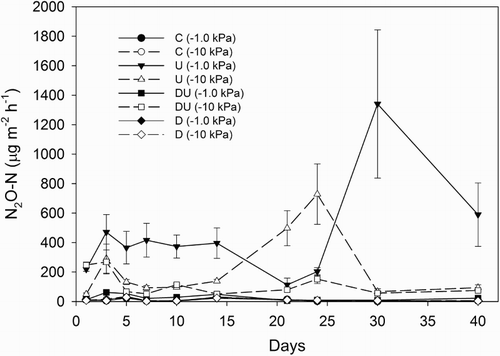
Figure 5 Cumulative N2O-N over 40 days. Error bars are ± SEM, n = 4. Legend abbreviations: C = control, U = urine only, D = dicyandiamide only, DU = urine plus dicyandiamide, with soil matric potential (kPa) in brackets.
Regression-fitted concentrations of DCD in the soil at time zero (Co) were in the range of 13.69 to 14.85 mg kg−1 () and decreased over time (). Treatment degradation rate constants (k), derived from plotting DCD concentration versus time (), were higher at −10 kPa (P < 0.05). At −1 kPa, urine application decreased the value of k, whereas at −10 kPa, the value of k increased under urine (P < 0.05, ). Consequently, calculated half-lives for DCD at −1 kPa, with or without urine present, were 53.3 (±7.5) and 23.5 (±3.0) days (±standard error regression estimate), respectively. Under drier soil conditions at −10 kPa the DCD half-lives, with or without urine present, were 14.9 (±2.9) and 16.7 (±2.7) days (±standard error regression estimate), respectively. Values of Dp/Do showed O2 was unable to diffuse through the soil cores at −1 kPa (Dp/Do = 0), while at −10 kPa, O2 diffusion occurred readily with Dp/Do equal to 0.07 ().
Figure 6 Dicyandiamide (DCD) concentrations versus time showing fitted regressions. Legend abbreviations: D = dicyandiamide only, DU = urine plus dicyandiamide, with soil matric potential (kPa) in brackets.
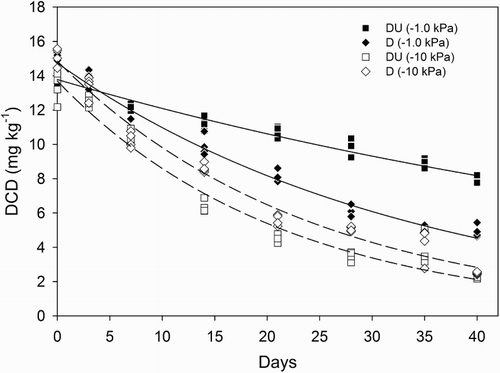
Table 1 Regression parameters (Co and k), obtained after fitting a first-order exponential function to the DCD data, and measured relative gas diffusivity (Dp/Do).
Discussion
Ruminant urine-N is dominated by urea (Doak Citation1952; Whitehead Citation1970) and the subsequent hydrolysis of this urea results in the formation of carbonate ions. When these carbonate ions are in turn hydrolysed, the net release of OH− ions increases the soil pH following urine application (Sherlock & Goh Citation1984). This hydrolysis sequence explains the increase in soil pH treatments observed in the urine-treated soil. Ammonium, a further product of urea hydrolysis, is also available for nitrification, a process that reduces concentrations with a net release of H+ ions (Wrage et al. Citation2001). As a consequence, the soil pH decreases as nitrification proceeds, as observed in the urine treatments. The slower rate of pH decrease observed in the urine-plus-DCD treatments can be attributed to DCD inhibiting nitrification since its concentrations at time zero were adequate for nitrification inhibition based on previous field studies (e.g. Cameron et al. Citation2014).
When is nitrified it is initially converted to
(Wrage et al. Citation2001). Thus the higher
concentrations observed under the urine treatments results from a greater substrate pool being available for nitrification. A slower rate of nitrification will influence
dynamics in a soil, as was in fact observed in the current study. The highest
concentrations occurred under urine in the absence of DCD at −1 kPa, but when DCD was applied under these conditions
concentrations were markedly lower. A similar DCD effect was not observed under drier soil conditions which suggests that the efficacy of the DCD compound at −10 kPa differed. A possible alternative explanation for the elevated
concentrations at −1 kPa under urine, in the absence of DCD, is the denitrification of
producing elevated
concentrations. Thus soil inorganic-N dynamics generally followed expected trends following urine deposition as seen in other studies (e.g. Wakelin et al. Citation2013).
Similarly, the increased DOC concentrations under urine replicated earlier studies (Monaghan & Barraclough Citation1993) and occurred as a result of the elevated soil pH hydrolysing soil organic matter. The absence of DCD in the urine treatments produced relatively lower DOC concentrations over time because some of the DOC was most likely utilised by heterotrophic organisms, such as denitrifiers, which had a greater supply of substrate. Supporting this interpretation was the prolonged presence of
where DCD was applied and so
was not so readily available for denitrifiers and consequently DOC was not utilised to the same degree.
The k values measured in the current study in the absence of urine at −1 and −10 kPa of 0.030 and 0.041 day−1, respectively, are very comparable with those of Balaine et al. (Citation2015), who reported k values of 0.025 and 0.045 day−1, respectively, for the same soil. Variation may be due to the initial DCD concentrations since Balaine et al. (Citation2015) had Co values of 7.43 and 11.45 mg kg−1 day−1 at −1 and −10 kPa, respectively, while in the current study the respective Co values were 14.73 and 14.85 mg kg−1. These values of Co are well within the range reported for field studies where DCD has been shown to be effective (Cameron et al. Citation2014; de Klein et al. Citation2014). The measures of soil aeration, O2 relative diffusivity, also aligned well with the previous values reported by Balaine et al. (Citation2015) of 0.07 and 0 for soil at −10 kPa and −1 kPa, respectively, and at −10 kPa the soil was well aerated (Stepniewski Citation1981).
Clearly, in the current experiment the application of DCD was initially effective at slowing nitrification within the urine-treated soil, as shown by the slower declines in soil pH, the enhanced duration of the soil pool and the altered dynamics of the soil
and
concentrations. However, at −10 kPa the higher k values and lower calculated half-life of the DCD compound demonstrated that DCD was being degraded faster at −10 kPa. This is consistent with the findings of Balaine et al. (Citation2015). The DCD molecule is chemically stable and unlikely to volatilise from moist soil and previous DCD recoveries from the soil used in this current study suggests no significant effect of adsorption of DCD to organic matter (Balaine et al. Citation2015 and references therein). Hence decreasing DCD concentrations can be attributed to chemical or biological degradation of the DCD.
The N2O molecule may be produced via nitrification, nitrifier-denitrification or denitrification with the latter two processes only occurring as the soil tends to anaerobicity or becomes anaerobic (Wrage et al. Citation2001; Zhu et al. Citation2013). Thus at −1 kPa with a Dp/Do value of 0 there was greater potential for N2O production in the urine only treatment and this explains why this treatment had the highest cumulative N2O flux. The null hypothesis stated DCD efficacy, as determined by reductions in N2O emissions, would decrease under the more aerated soil as a result of greater DCD degradation. This was observed to occur with the reduction in N2O emissions decreasing from 95% at −1 kPa to 57% at −10 kPa.
The lack of difference in soil concentrations in the urine and urine-plus-DCD treatments at −10 kPa suggests this is the reason for the reduced efficacy of DCD, given that N2O formation is strongly linked to the presence of
in soils (Maharjan & Venterea Citation2013). By the end of the experiment at day 40, soil DCD concentrations averaged only 2.5 mg kg−1 at −10 kPa without urine, compared with 7.9 mg kg−1 at −1 kPa under urine, and the concentration was insufficient to suppress nitrification and N2O production ensued, potentially through a range of mechanisms (Wrage et al. Citation2001). Soil volumetric water contents varied with soil moisture treatment and so it is possible that the amount of soil water itself influenced the efficacy of DCD in the soil solution. However, the relative ratio of the soil volumetric water contents (51% and 31%) was 1:1.6 and, assuming all the DCD is dissolved in the soil water, this does not explain the reduced efficacy at −10 kPa since the concentration should have been higher at 31% volumetric water content, all things being equal. It is perhaps also possible that under the drier soil conditions (−10 kPa),
was lost in other gaseous forms, such as nitric oxide, which has been shown to occur under urine patches and drier soil conditions (Venterea et al. Citation2005; Khan et al. Citation2014).The very limited work to date has either demonstrated greater DCD degradation in soils with higher organic matter contents (Balaine et al. Citation2015) or inferred greater DCD degradation in soils with higher organic matter contents or when organic matter has been added to soils (Reddy Citation1964; Amberger & Vilsmeier Citation1979; Puttanna et al. Citation1999). This was the basis for the hypothesis that increased levels of DOC would enhance DCD degradation. Contrary to this hypothesis, at −10 kPa there was no statistically significant effect of the soil DOC on k values and the half-life of the DCD. This suggests that organisms responsible for DCD degradation preferred the DCD as a substrate over the DOC made available following urine application.
Previous work has shown that the efficacy of DCD can also vary due to the numbers of amoA genes present (Wakelin et al. Citation2014). Thus the higher degradation rates observed by Balaine et al. (Citation2015) in soil with a higher organic matter content may have been the result of the ammonia-oxidising microbial community varying with soil organic matter content.
At −1 kPa, the influence of DOC was also contrary to the hypothesis proposed with the half-life of DCD actually increasing in the presence of urine, where the DOC levels were higher. It is possible that urine and/or the increased DOC concentrations provided alternative and more easily accessible carbon and N substrates for soil organisms operating under the near anaerobic conditions, which reduced the demand or need to catabolise the DCD compound. Alternatively, activity of the organisms responsible for DCD degradation may have been reduced as a result of the soil's reduced oxidation status at −1 kPa. Further studies specifically aimed at understanding the microbial degradation pathway are needed to fully understand the effect of soil aeration status and soil organic matter levels on DCD degradation.
These results have implications for maximising the efficacy of DCD, with DCD application frequency and rates needing to be matched with an understanding of soil drainage class, since soil drainage determines the level of soil aeration and DCD's degradation rate. Furthermore, the results of this study could be used in nutrient budgeting models such as Overseer® (Wellington, New Zealand).
Conclusion
This study shows that efficacy of the nitrification inhibitor DCD depends on soil aeration and that DCD degradation can be influenced by DOC concentrations. Increasing soil aeration decreased the efficacy of the DCD compound, as assessed by measuring N2O emissions from under urine treatments, with DCD concentrations becoming too low to inhibit the formation of and
, which are both utilised in N2O formation processes. Contrary to the hypothesis proposed, the increase in DOC following urine application at −1 kPa increased the half-life of DCD, and thus its efficacy, while DOC had no effect at −10 kPa. Further studies are needed to identify and better understand the role that microrganisms play in DCD degradation under environments varying in soil aeration and DOC levels, and the subsequent implications for DCD efficacy as a nitrification inhibitor.
Acknowledgements
The funding was provided by the Ministry for Primary Industries (MPI), New Zealand under the Sustainable Land Management and Climate Change programme (contract number LU30677). We thank Craig Tregurtha for his help with soil collection. We also thank Joy Jiao and Teresa Symon Parayil for their help with DCD analysis.
Disclosure statement
No potential conflict of interest was reported by the authors.
References
- Amberger A, Vilsmeier K 1979. Breakdown of dicyandiamide in quartz sand and soils. Zeitschrift für Pflanzenernährung und Bodenkunde 142: 778–785. doi: 10.1002/jpln.19791420603
- Balaine N, Clough TJ, Kelliher FM, vanKoten C 2015. Soil aeration affects the degradation rate of the nitrification inhibitor, dicyandiamide. Soil Research 53: 137–143.
- Blakemore LC, Searle PL, Daly BK 1987. Methods for chemical analysis of soils. Lower Hutt, New Zealand Soil Bureau. Scientific Report 80: 78–79.
- Cameron KC, Di HJ, Moir JL 2014. Dicyandiamide (DCD) effect on nitrous oxide emissions, nitrate leaching and pasture yield in Canterbury, New Zealand. New Zealand Journal of Agricultural Research 57: 251–270. doi: 10.1080/00288233.2013.797914
- Carey PL, Jianga S, Roberts AH 2012. Pasture dry matter responses to the use of a nitrification inhibitor: a national series of New Zealand farm trials. New Zealand Journal of Agricultural Research 55: 63–72. doi: 10.1080/00288233.2011.644628
- Clough TJ, Kelliher FM, Wang YP, Sherlock RR 2006. Diffusion of 15N-labelled N2O into soil columns: a promising method to examine the fate of N2O in subsoils. Soil Biology and Biochemistry 38: 1462–1468. doi: 10.1016/j.soilbio.2005.11.002
- Corre WJ, Zwart KB 1995. Effects of DCD addition to slurry on nitrate leaching in sandy soils. Netherlands Journal of Agricultural Science 43: 195–204.
- Currie JA 1960. Gaseous diffusion in porous media Part 1. – a non-steady state method. British Journal of Applied Physics 11: 314–317. doi: 10.1088/0508-3443/11/8/302
- Di H, Cameron KC 2000. Calculating nitrogen leaching losses and critical nitrogen application rates in dairy pasture systems using a semi-empirical model. New Zealand Journal of Agricultural Research 43: 139–147. doi: 10.1080/00288233.2000.9513415
- Doak BW 1952. Some chemical changes in the nitrogenous constituents of urine when voided on pasture. The Journal of Agricultural Science 42: 162–171. doi: 10.1017/S0021859600058767
- Fraser PM, Curtin D, Harrison-Kirk T et al. 2013. Winter nitrate leaching under different tillage and winter cover crop mangement practices. Soil Science Society of America Journal 77: 1391–1401. doi: 10.2136/sssaj2012.0256
- Galloway J, Aber JD, Erisman JW et al. 2003. The nitrogen cascade. Bioscience Biotechnology and Biochemistry 53: 341–356.
- Ghani A, Dexter M, Perrott KW 2003. Hot-water extractable carbon in soils: a sensitive measurement for determining impacts of fertilisation, grazing and cultivation. Soil Biology and Biochemistry 35: 1231–1243. doi: 10.1016/S0038-0717(03)00186-X
- Harrison-Kirk T, Beare MH, Meenken ED, Condron LM 2013. Soil organic matter and texture affect responses to dry/wet cycles: Effects on carbon dioxide and nitrous oxide emissions. Soil Biology and Biochemistry 57: 43–55. doi: 10.1016/j.soilbio.2012.10.008
- Hutchinson GL, Mosier AR 1981. Improved soil cover method for field measurement of nitrous oxide fluxes. Soil Science Society of America Journal 45: 311–316. doi: 10.2136/sssaj1981.03615995004500020017x
- Kelliher FM, Clough TJ, Clark H, Rys G, Sedcole JR 2008. The temperature dependence of dicyandiamide (DCD) degradation in soils: A data synthesis. Soil Biology and Biochemistry 40: 1878–1882. doi: 10.1016/j.soilbio.2008.03.013
- Kelliher FM, van Koten C, Kear MJ et al. 2014. Effect of temperature on dicyandiamide (DCD) longevity in pastoral soils under field conditions. Agriculture, Ecosystems and Environment 186: 201–204. doi: 10.1016/j.agee.2014.01.026
- Khan S, Clough TJ, Goh KM, Sherlock RR 2014. Nitric and nitrous oxide fluxes following bovine urine deposition to summer-grazed pasture. New Zealand Journal of Agricultural Research 57: 136–147. doi: 10.1080/00288233.2014.897633
- Kim DG, Giltrap D, Saggar S, Palmada T, Berben P, Drysdale D 2012. Fate of the nitrification inhibitor dicyandiamide (DCD) sprayed on a grazed pasture: effect of rate and time of application. Soil Research 50: 337–347. doi: 10.1071/SR12069
- Kim DG, Giltrap DL, Saggar S, Hanly JA 2014. Field studies assessing the effect of dicyandiamide (DCD) on N transformations, pasture yields, N2O emissions and N-leaching in the Manawatu region. New Zealand Journal of Agricultural Research 57: 271–293. doi: 10.1080/00288233.2013.855244
- de Klein CAM, Letica SA, Macfie PI 2014. Evaluating the effects of dicyandiamide (DCD) on nitrogen cycling and dry matter production in a 3-year trial on a dairy pasture in South Otago, New Zealand. New Zealand Journal of Agricultural Research. 57: 316–331. doi: 10.1080/00288233.2014.941508
- Lavagnini I, Magno F 2007. A statistical overview on univariate calibration, inverse regression, and detection limits: application to gas chromatography/mass spectrometry technique. Mass Spectrometry Reviews 26: 1–18. doi: 10.1002/mas.20100
- Ledgard SF, Luo J, Sprosen MS, Wyatt JB, Balvert SF, Lindsey SB 2014. Effects of the nitrification inhibitor dicyandiamide (DCD) on pasture production, nitrous oxide emissions and nitrate leaching in Waikato, New Zealand. New Zealand Journal of Agricultural Research 57: 294–315. doi: 10.1080/00288233.2014.928642
- Maharjan B, Venterea RT 2013. Nitrite intensity explains N management effects on N2O emissions in maize. Soil Biology and Biochemistry 66: 229–238. doi: 10.1016/j.soilbio.2013.07.015
- McDowell RW, Snelder T, Littlejohn RP, Hickey M, Cox N, Booker DJ 2011. State and potential management to improve water quality in an agricultural catchment relative to a natural baseline. Agriculture, Ecosystems & Environment 144: 188–200. doi: 10.1016/j.agee.2011.07.009
- Ministry for the Environment. 2014. New Zealand's Greenhouse Gas Inventory 1990–2012. 464 p.
- Moldrup P, Olesen T, Gamst J, Schjønning P, Yamaguchi T, Rolston DE 2000. Predicting the Gas Diffusion Coefficient in Repacked Soil: Water-Induced Linear Reduction Model. Soil Science Soceity of America Journal 64: 1588–1594. doi: 10.2136/sssaj2000.6451588x
- Monaghan RM, Barraclough D 1993. Nitrous oxide and dinitrogen emissions from urine-affected soil under controlled conditions. Plant and Soil 151: 127–138. doi: 10.1007/BF00010793
- Parfitt RL, Stevenson BA, Dymon JR, Schipper LA, Baisden WT, Ballantine DJ 2012. Nitrogen inputs and outputs for New Zealand from 1990 to 2010 at national and regional scales. New Zealand Journal of Agricultural Research 55: 241–262. doi: 10.1080/00288233.2012.676991
- Petersen SO, Sommer SG 2011. Ammonia and nitrous oxide interactions: Roles of manure organic matter management. Animal Feed Science and Technology 166–167: 503–513. doi: 10.1016/j.anifeedsci.2011.04.077
- Puttanna K, Gowda NMN, Rao EVSP 1999. Effect of concentration, temperature, moisture, liming and organic matter on the efficacy of the nitrification inhibitors benzotriazole, o-nitrophenol, m-nitroaniline and dicyandiamide. Nutrient Cycling in Agroecosystems 54: 251–257. doi: 10.1023/A:1009826927579
- Reddy GR 1964. Effect of mixing varying quantities of dicyandiamide with ammonium fertilizers on nitrification of ammonia in soils. Canadian Journal of Soil Science 44: 254–259. doi: 10.4141/cjss64-036
- Rolston DE, Moldrup P 2002. Gas diffusivity. In: Topp GC, Dane JH eds. Methods of soil analysis – part 4 – physical methods. Madison, WI, Soil Science Society of America. Pp. 1113–1139.
- Selbie DR, Buckthought LE, Shepherd MA 2015. The challenge of the urine patch for managing nitrogen in grazed pasture systems. Advances in Agronomy 129: 229–292. doi: 10.1016/bs.agron.2014.09.004
- Sherlock RR, Goh KM 1984. Dynamics of ammonia volatilization from simulated urine patches and aqueous urea applied to pasture. I. Field experiments. Fertilizer Research 5: 181–195. doi: 10.1007/BF01052715
- Stepniewski W 1981. Oxygen diffusion and the strength as related to soil compaction. II Oxygen diffusion coefficient. Polish Journal of Soil Science 14: 3–13.
- Stevenson BA, Parfitt RL, Schipper LA, Baisden WT, Mudge P 2010. Relationship between soil δ15N, C/N and N losses across land uses in New Zealand. Agriculture Ecosystems and Environment 139: 736–741. doi: 10.1016/j.agee.2010.10.020
- Venterea RT, Rolston DE, Cardon ZG 2005. Effects of soil moisture, physical, and chemical charcteristics on abiotic nitric oxide production. Nutrient Cycling in Agroecosystems 72: 27–40. doi: 10.1007/s10705-004-7351-5
- Vilsmeier K 1991. Turnover of 15N ammonium sulfate with dicyandiamide under aerobic and anaerobic soil conditions. Fertilizer Research 29: 191–196. doi: 10.1007/BF01048959
- Wakelin SA, Clough TJ, Gerard EM, O'Callaghan M 2013. Impact of short-interval, repeat application of dicyandiamide on soil N transformation in urine patches Agriculture. Ecosystems and Environment 167: 60–70. doi: 10.1016/j.agee.2013.01.007
- Wakelin SA, Williams E, O'Sullivan CA, Cameron KC, Di H, Cave V, O'Callaghan M 2014. Predicting the efficay of the nitrification inhibitor dicyandiamide in pastoral soils. Plant and Soil 381: 35–43. doi: 10.1007/s11104-014-2107-8
- van der Weerden TJ, Clough TJ, Styles TM 2013. Using near-continuous measurements of N2O emission from urine-affected soil to guide manual gas sampling regimes. New Zealand Journal of Agricultural Research 56: 60–76. doi: 10.1080/00288233.2012.747548
- Whitehead DC 1970. The role of nitrogen in grassland productivity. Aberystwyth, Commonwealth Agricultural Bureau. 195 p.
- Wrage N, Velthof GL, van Beusichem ML, Oenema O 2001. Role of nitrifier denitrification in the production of nitrous oxide. Soil Biology and Biochemistry 33: 1723–1732. doi: 10.1016/S0038-0717(01)00096-7
- Zhu X, Burger M, Doaneb TA, Howarth WR 2013. Ammonia oxidation pathways and nitrifier denitrification are significant sources of N2O and NO under low oxygen availability. Proceedings of the National Academy of Sciences of the United States of America 110: 6328–6333. doi: 10.1073/pnas.1219993110